By: Eduardo Pivaral | Comments (3) | Related: > Power BI
Problem
Since information can come from a lot of different data sources (both structured and unstructured data), you need a solution to be able to gather and visualize data, and have the ability to share your findings among your team in a clear-concise way. In this tip, we will cover how Power BI can get you started.
Solution
Power BI provides a set of tools to gather, prepare and interactively visualize and share data across your organization, in an optimal, secure way. You can create reports fast and easy, with enterprise-grade quality. Power BI provides three main tools: data discovery, data preparation and data visualization.
In this tip we will show how Power BI works and how to create a simple report from scratch and the options available for creating reports.
How does Power BI work?
According to this Microsoft documentation, Power BI consists of three parts:
- Power BI Desktop: to create reports in a friendly user interface.
- Power BI Service: a cloud SaaS used to publish and maintain reports via dashboards.
- Mobile Power BI: apps available for consuming reports on mobile devices.
Power BI Basic Workflow
For most of the reports, you start by creating a report (.pbix extension) using Power BI desktop, then you publish it to the Power BI Service and then the report is consumed with the power BI app or via a web browser.
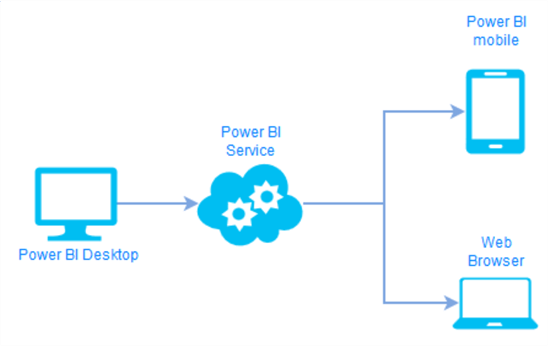
In this post we will show you how to create a basic report and the options available in Power BI Desktop.
Install Power BI Desktop
First, download Power BI Desktop. The latest version is available here.
Proceed to install (all the defaults are OK).
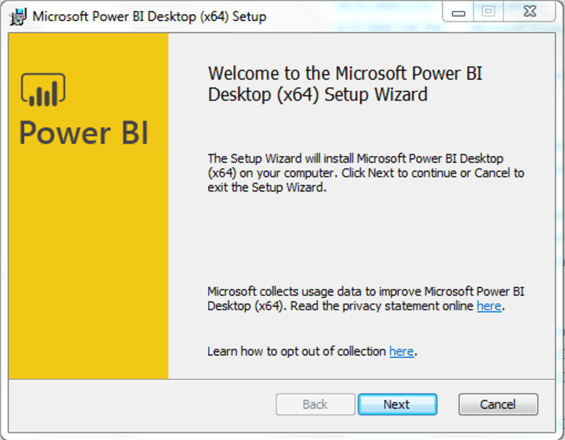
After this simple setup is finished you can begin.
Configure Power BI Desktop
To work with Power BI, you need to register first, the required fields are listed below for the first time you open the IDE.
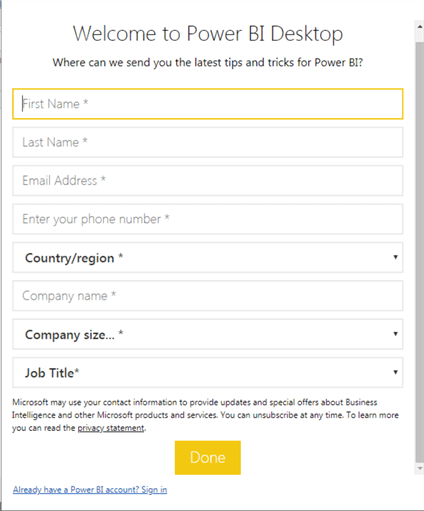
Also, if you already have an account you can choose to sign in, this information is used to be able to publish reports to the Power BI Service.
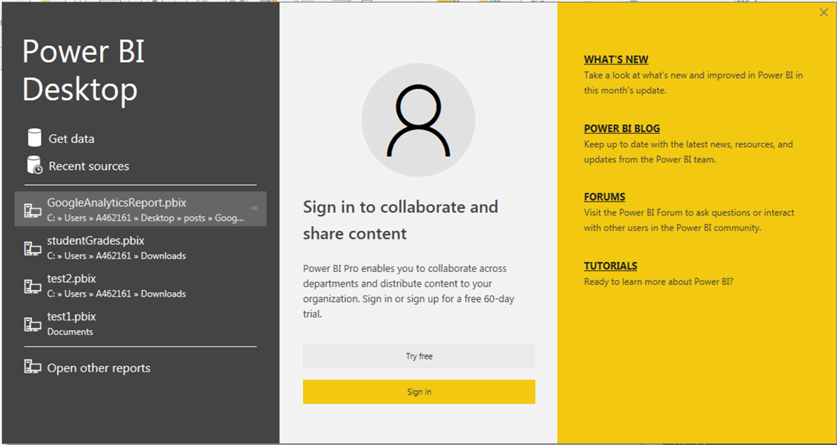
Also, if you don’t plan to use the Power BI service (for example if you will only develop and visualize reports locally) you can choose to not register and start using it right away.
You can always sign in later via the main menu:
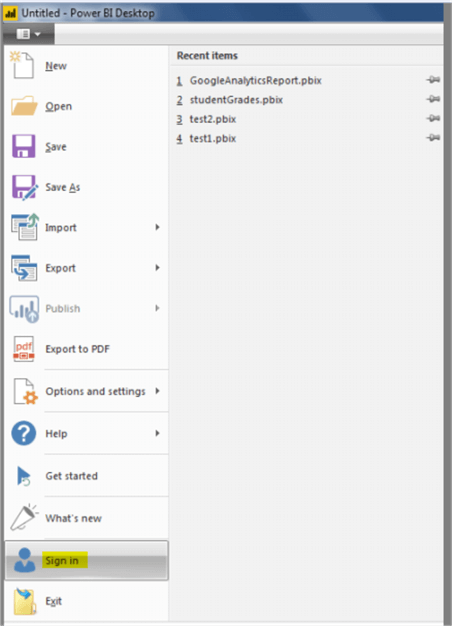
That is all for the configuration, we will now learn how to create a report and the options available.
Gathering Data for Power BI
As we mentioned earlier, Power BI supports data from multiple sources, so you can select from a list of both structured and unstructured data sources.
To connect to a data source, just select Get Data in the home tab as follows:
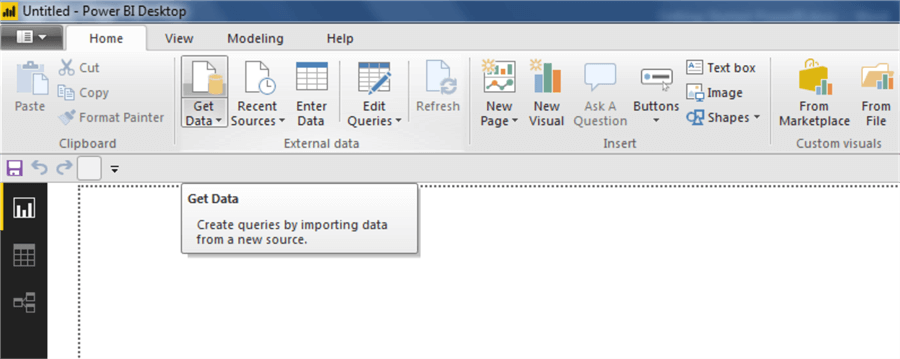
A new window will open where you can select your desired data source (more source options are added with each release).
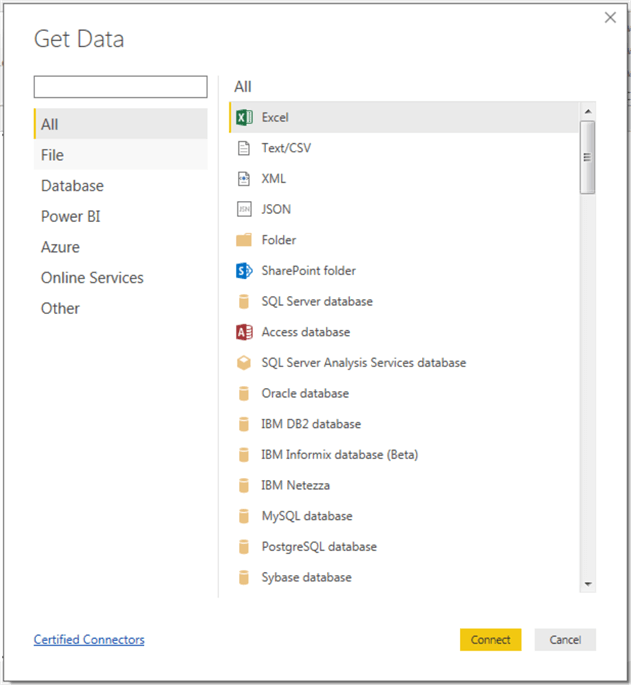
For this example, we will connect to a SQL Server database. A new window will open where you define the server to connect, also you can select the data connectivity mode, this is very important since many of the features, availability and performance of your reports depend on this option.
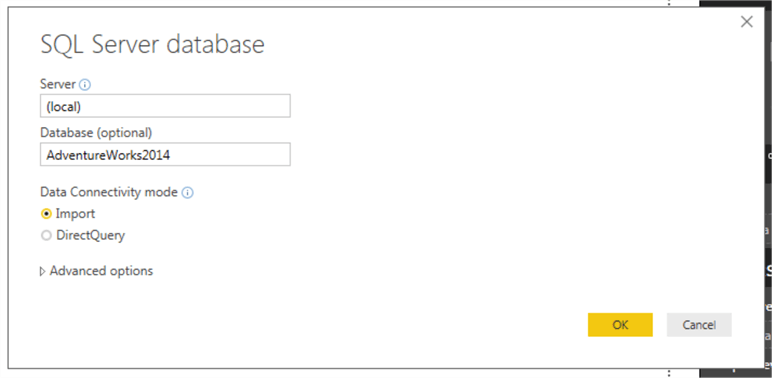
We will explain each data connectivity mode:
- Import:
- Most common option for reports, all data sources support the import option.
- You can work with multiple data sources.
- All of the Power BI engine features can be used with this option (like Q&A).
- The data is imported and stored on the report (encrypted) until you refresh the data, when a new import occurs.
- The data you can import depends on your hardware, since both disk and RAM are used to work with the data.
- Is the fastest data access method since there is no latency for data retrieval?
- DirectQuery:
- Not all data sources support DirectQuery. For a list of supported datasources you can check here.
- All the data remains on the data source, the report just stores the object definitions and queries.
- There is no limit on the data you can use since it is only retrieved at visualization.
- Not all features are supported (like Q&A).
- Some latency or timeout issues can occur while retrieving the data.
- You can use just one data source.
- Not all query constructs are supported.
Even though there are a lot of disadvantages on using DirectQuery over Import, there are some cases when you really need to use it, for example:
- Data from your source is so big that it cannot fit on your hardware using Import.
- Because of design requirements, you need to visualize live data.
For this example, we will select the import option. In the next window, you can browse the objects and then pre-visualize them. We will select some of the sales tables from the AdventureWorks test database.
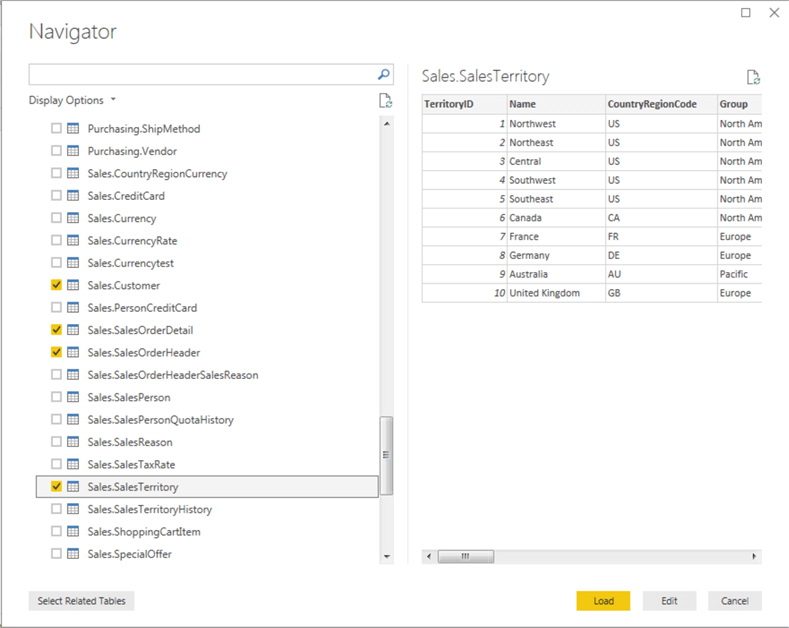
When you are happy with your selection, click Load, then click on apply changes on the next window.

Depending on the size of the data, the process can take some time to complete. After the load is complete, you are now able to build your report. You can drag and drop controls or fields from the right-side options.
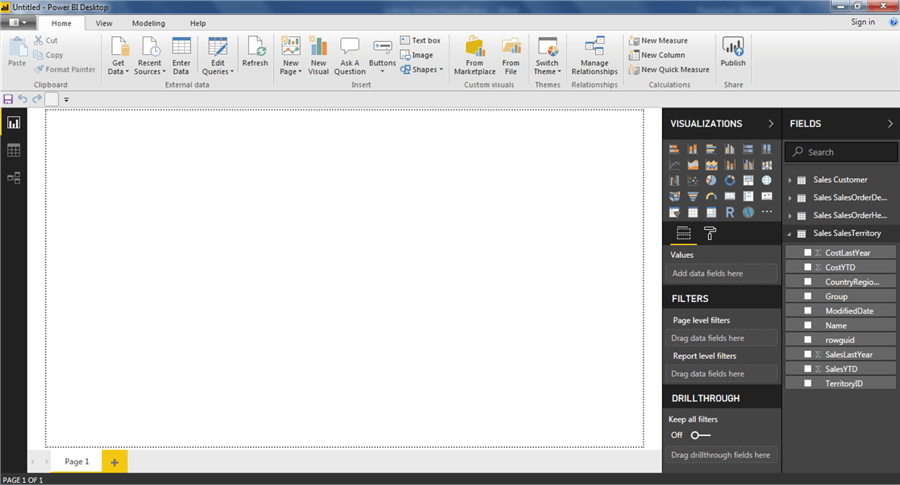
You can select the fields you want to use to build a simple report and this is known as a dashboard (a very simple one).
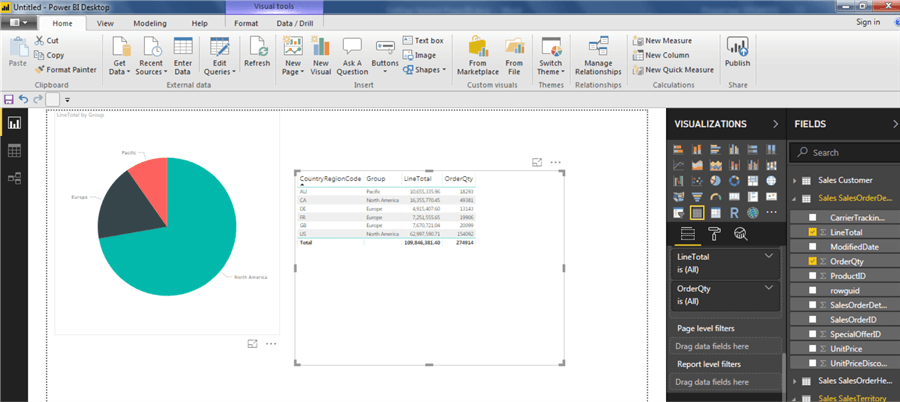
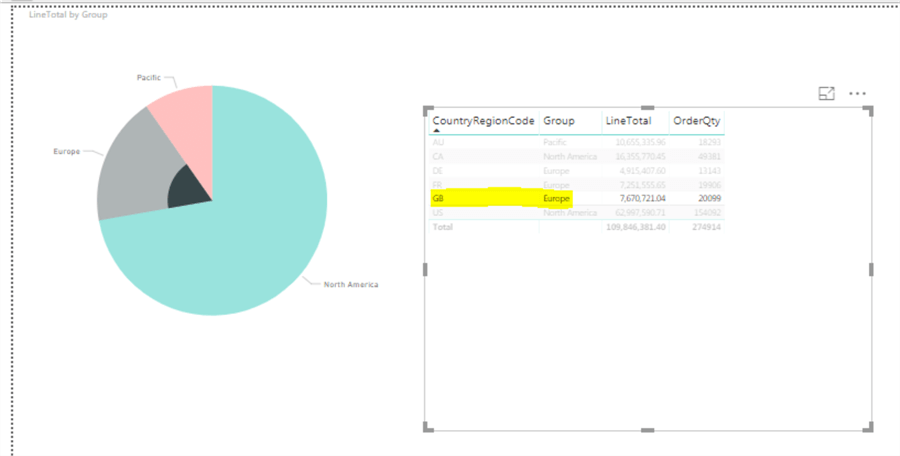
As mentioned earlier, Power BI is an interactive reporting tool, so if you click on any record on the grid, it will highlight the related data on the chart:
At this point you can save your report and publish it if you want.
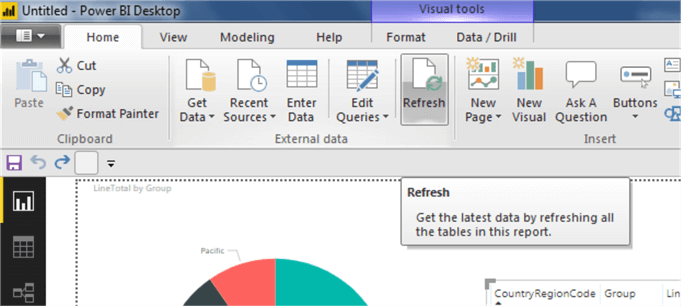
To refresh the imported data, you just have to click on the refresh button on the Home menu, this will update the data from all the datasets you have in your report.
In upcoming tips, we will discuss report format, Power Query and report publishing.
Next Steps
- Stay tuned for future tips about other Power BI features.
- Power BI desktop can be downloaded from here.
- You can check the Microsoft official documentation on Power BI architecture here.
- The data source list you can use for DirectQuery changes constantly in each release, you can check the list here.
- You can check all Power BI tips here.
Learn more about Power BI in this 3 hour training course.
About the author
 Eduardo Pivaral is an MCSA, SQL Server Database Administrator and Developer with over 15 years experience working in large environments.
 This author pledges the content of this article is based on professional experience and not AI generated.
View all my tips


