Problem
One of the most common challenges in leveraging a complex Power BI solution is a lack of visibility into what filters have been applied on the reports. Report users would ideally want to know at a glance what slicers have been applied. This is particularly where there are multiple slicers on the same report page.
Although, this is not a new concept, there have been loads of blogs and YouTube videos done to demonstrate how to achieve this goal. Some include the use of external tools like DAX Studio to generate the DAX code. However, I have written this post to demonstrate an optional step-by-step approach to solving this user experience challenge. I will walk through a scalable DAX pattern to dynamically display in a clean and readable format for the slicers selected in a report page.
Solution
Let’s walk through how to build a Power BI report that shows the slicers used to filter and display the data.
Building the Power BI Report
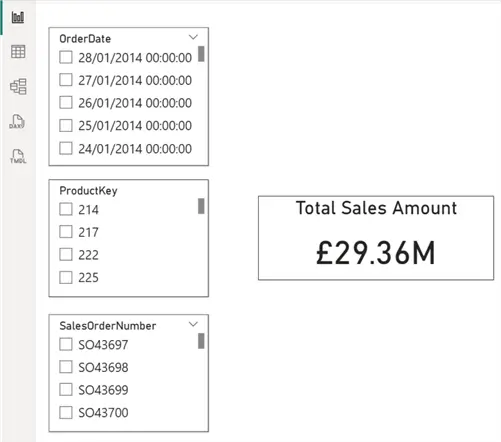
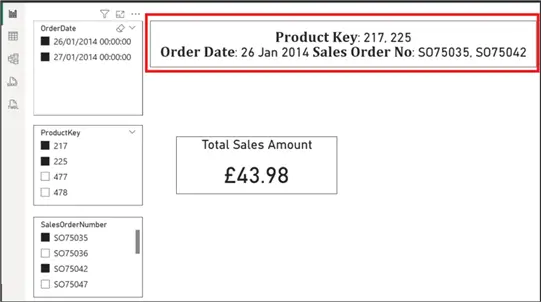
To demonstrate this approach, I will be using the example Power BI report as seen in the image below. In the report, I have three slicers which are OrderDate, ProductKey, and SalesOrderNumber. In your case it might be more than that number or less than or even in a slicer panel with lots of slicers from different tables modeled in the report, depending on your use case. The approach is still same since it will be designed in a scalable way.
The “Total Sales Amount” in the Card visual is the only measure in this sample report. Your reports might be a more complex solution.
So, for this demonstration, the requirement is that once a slicer or more is selected, we want to show the report users what has been selected in the slicers. If nothing is selected in all slicers, we need to return a message to show that too.
The step-by-step approach below will make the task easy to manage, scale, and understand. I have broken this into different steps to make the approach very clear and easy to scale and understand. I will combine all of the steps at the end.
Step 1: Create a DAX Measure to detect if any slicer is applied
This is the step where you add all the fields that you are using for your slicers.
_Detect if Slicer is applied =
VAR _AnyFilterApplied =
ISFILTERED ( FactInternetSales[SalesOrderLineNumber] )
|| ISFILTERED ( FactInternetSales[ProductKey] )
|| ISFILTERED ( FactInternetSales[OrderDate] )
RETURN
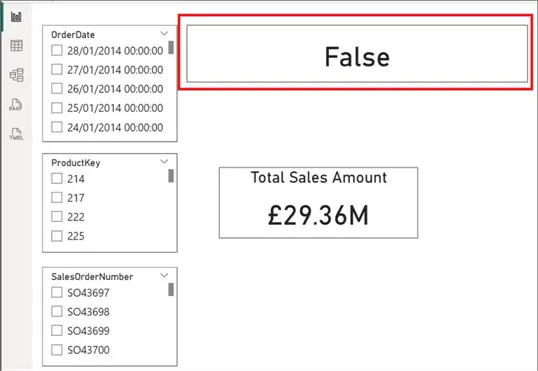
_AnyFilterAppliedSo as can be seen in the DAX code, I have only included the slicers I am using. In your case just add the other slicer fields within an ISFILTERED function. The output of the DAX code is “FALSE” when no slicer is selected as seen in the image below.
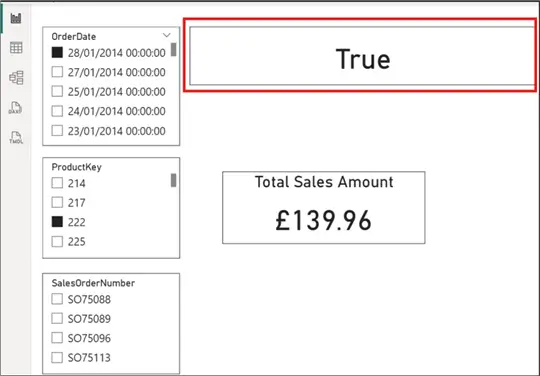
The output will be “TRUE” when at least one slicer is selected. See the image below.
Step 2: Create a readable label for each slicer line
In this step, we will build each slicer line to ensure that only selected values are shown, nothing will appear when a slicer is not used, and multiple selections are comma-separated.
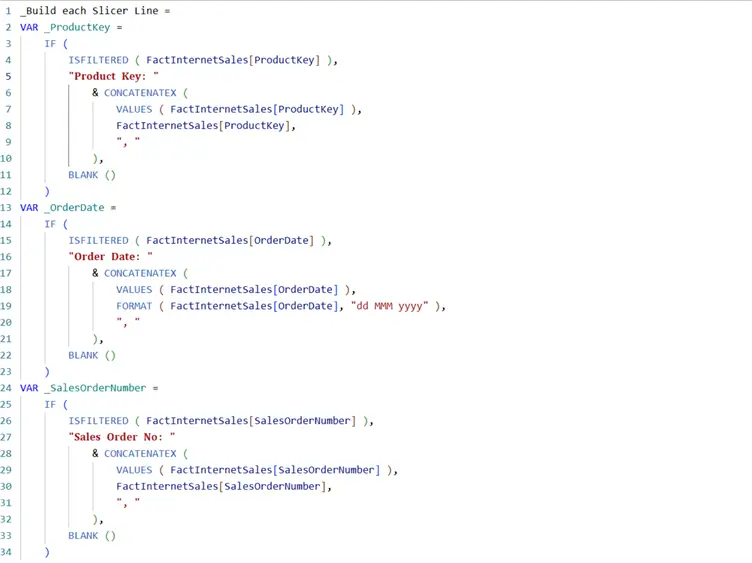
_Build each Slicer Line =
VAR _ProductKey =
    IF (
        ISFILTERED ( FactInternetSales[ProductKey] ),
        "Product Key: "
            & CONCATENATEX (
                VALUES ( FactInternetSales[ProductKey] ),
                FactInternetSales[ProductKey],
                ", "
            ),
        BLANK ()
    )
VAR _OrderDate =
    IF (
        ISFILTERED ( FactInternetSales[OrderDate] ),
        "Order Date: "
            & CONCATENATEX (
                VALUES ( FactInternetSales[OrderDate] ),
                FORMAT ( FactInternetSales[OrderDate], "dd MMM yyyy" ),
                ", "
            ),
        BLANK ()
    )
VAR _SalesOrderNumber =
    IF (
        ISFILTERED ( FactInternetSales[SalesOrderNumber] ),
        "Sales Order No: "
            & CONCATENATEX (
                VALUES ( FactInternetSales[SalesOrderNumber] ),
                FactInternetSales[SalesOrderNumber],
                ", "
            ),
        BLANK ()
    )
VAR _Lines = { _ProductKey, _OrderDate, _SalesOrderNumber }

RETURN
    CONCATENATEX (_Lines, [Value])
As you can see in the DAX code, I have built each slicer line separately using DAX variables. Also, note how I have handled the OrderDate slicer field separately to ensure it is well formatted. This is because date slicer fields require special formatting.
The output of the DAX code in this step is as seen in the image below. However, you can see that there is no clear spacing between each slicer selected, and a bit difficult to understand at the moment.
Step 3: Combine all filters together and make it clean
At this step, we just need to add additional logic to the code to ensure we can remove blank lines, add line breaks and produce clean readable outputs.
_Combine and add clean output =
VAR _ProductKey =
    IF (
        ISFILTERED ( FactInternetSales[ProductKey] ),
        "Product Key: "
            & CONCATENATEX (
                VALUES ( FactInternetSales[ProductKey] ),
                FactInternetSales[ProductKey],
                ", "
            ),
        BLANK ()
    )
VAR _OrderDate =
    IF (
        ISFILTERED ( FactInternetSales[OrderDate] ),
        "Order Date: "
            & CONCATENATEX (
                VALUES ( FactInternetSales[OrderDate] ),
                FORMAT ( FactInternetSales[OrderDate], "dd MMM yyyy" ),
                ", "
            ),
        BLANK ()
    )
VAR _SalesOrderNumber =
    IF (
        ISFILTERED ( FactInternetSales[SalesOrderNumber] ),
        "Sales Order No: "
            & CONCATENATEX (
                VALUES ( FactInternetSales[SalesOrderNumber] ),
                FactInternetSales[SalesOrderNumber],
                ", "
            ),
        BLANK ()
    )
VAR _Lines = { _ProductKey, _OrderDate, _SalesOrderNumber }
VAR _Output =
    CONCATENATEX (
        FILTER ( _Lines, NOT ISBLANK ( [Value] ) ),
        [Value],
        UNICHAR ( 10 )
    )
RETURN
   _Output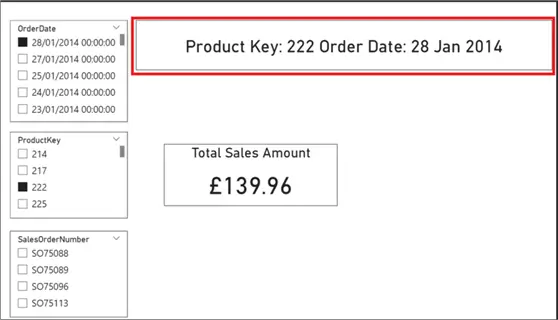
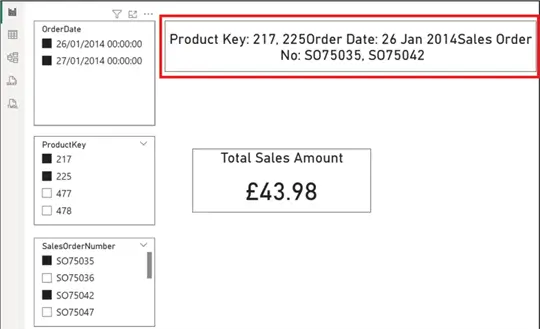
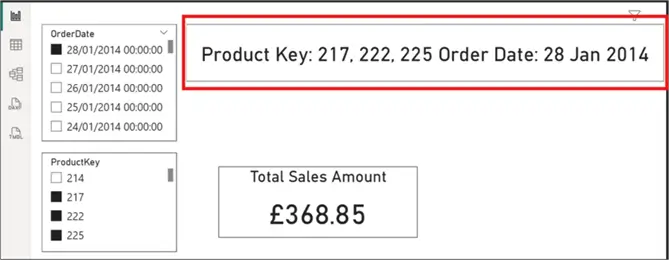
Note that when you select more than one slicer it points to instance ProductKey 222, 217, and 225 it will also list all out as seen in the image below. Same applies to all other slicers included.
Step 4: Display a fallback message when no slicer is selected
Adding a fallback message makes the user experience much easier and clearer. This is where we would add a fallback message like “You have not selected any slicers” when there are no active slicers selected.
To achieve this, I have added simple logic at the end of the code used in step 2.
_Add a fallback Message =
VAR _ProductKey =
IF (
ISFILTERED ( FactInternetSales[ProductKey] ),
"Product Key: "
& CONCATENATEX (
VALUES ( FactInternetSales[ProductKey] ),
FactInternetSales[ProductKey],
", "
),
BLANK ()
)
VAR _OrderDate =
IF (
ISFILTERED ( FactInternetSales[OrderDate] ),
"Order Date: "
& CONCATENATEX (
VALUES ( FactInternetSales[OrderDate] ),
FORMAT ( FactInternetSales[OrderDate], "dd MMM yyyy" ),
", "
),
BLANK ()
)
VAR _SalesOrderNumber =
IF (
ISFILTERED ( FactInternetSales[SalesOrderNumber] ),
"Sales Order No: "
& CONCATENATEX (
VALUES ( FactInternetSales[SalesOrderNumber] ),
FactInternetSales[SalesOrderNumber],
", "
),
BLANK ()
)
VAR _Lines = { _ProductKey, _OrderDate, _SalesOrderNumber }
VAR _Output =
CONCATENATEX (
FILTER ( _Lines, NOT ISBLANK ( [Value] ) ),
[Value],
UNICHAR ( 10 )
)
RETURN
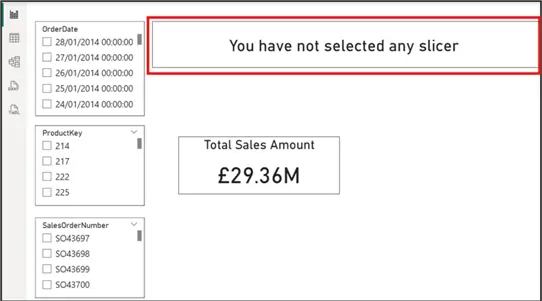
IF ( ISBLANK ( _Output ), "You have not selected any slicer ", _Output )The output on the image below shows when no slicer selection is made.
Following this approach, you would not need to leverage any external tools to build the DAX for this purpose. The step-by-step approach ensures that it is easy to understand and adapt this approach in any Power BI report.
Differentiate Slicer Names and Values
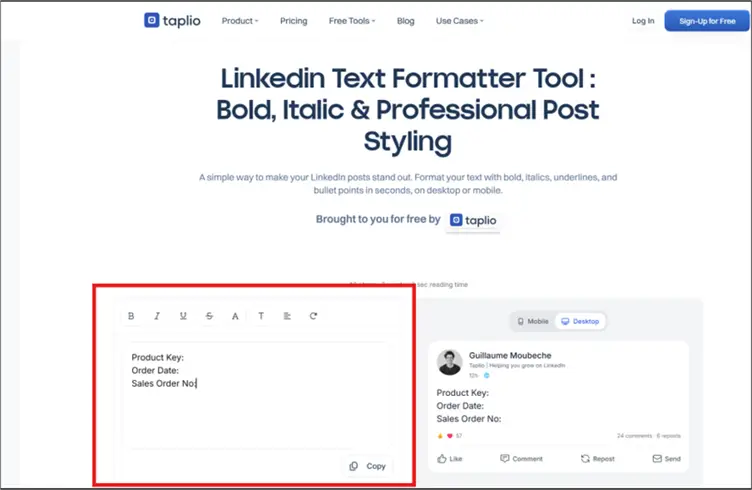
I would like to add one additional tip to further enhance this approach. As you can see on the card displaying the selected slicer values, it is difficult to differentiate the slicer names from the values selected. This is because it’s not possible by default in Power BI to alter the font type or use bold for the names and non-bold fonts for the values. But we can do this using other means.
What you need to do is search and use https://taplio.com/linkedin-post-formatter to alter the fonts style of the part of the texts as you want. See an example how I have used this.
Firstly, I copied the names of each slicer as written in the DAX code in Step 2 and Step 3, and pasted into taplio as seen in the image below. Might be easier to do this individually though.
Then I highlighted all texts and made it bold font as seen in the image below.
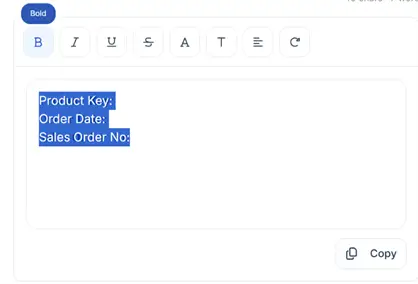
Then I will copy each text again and paste it in the DAX code in Step 3. Ensure to use the “Copy” button at the bottom as seen in the image above.
Once done correctly, my DAX code will now look like the one in the image below.
As you can now see in the image below, it’s now very clear what the card is showing and the user experience is now far better than before.
Summary
In summary, this approach is very efficient and easy to understand. We achieved the following:
- Scalable – Just add more slicer variables
- Maintainable – Since each slicer is isolated as demonstrated
- User Friendly – Due to the clear formatting approach used
- Enterprise Ready
In this blog post, it is even more evident that displaying active slicers is a small feature, but with a massive impact. In the long run, it helps to improve report clarity, user adoption, and trust in report solutions.
Next Steps
- Check out the following resources:
- Try this tip out in your own data as business requires.
- Check out additional Power BI articles

Kenneth A. Omorodion is a Microsoft Certified Solutions Associate (MCSA) with 12+ years of enterprise application experience in Power BI, DAX, Microsoft Fabric, Business Intelligence, data warehousing, SSRS, T-SQL, and Azure. Beyond his technical skills, Kenneth has expertise working with stakeholders’ and business leaders to help them better understand key insights. He has a great track record of successfully delivering full life cycle Business Intelligence and data solutions to organizations with measurable business impact.
- MSSQLTips Awards
- Achiever Award (75+ Tips) – 2025
- Author of the Year-2021
- Author Contender-2022/2023/2024


