Problem
For Power BI developers, one very common (and frustrating) issue is when measures spill into future dates on charts especially when working with some time intelligence DAX calculations (e.g. MTD, YTD, etc.), date dimensions that extend beyond current date, and forecast-enabled tables.
In Power BI charts (e.g. line or bar charts), apart from dates with data, measures are also evaluated for every date on the axis, regardless if there is data or not. For example, if my dates table runs to 2026 December, but my data table only have data up to today, when I create a measure that leverages MTD or YTD for example, Power BI will tend to evaluate the measure for all dates that exist in my Dates table, unless I explicitly apply a logic to prevent this behaviour. This behaviour might result in flat lines on charts, misleading trends, and confusion to intended users.
In this article, I will demonstrate some examples of approaches to prevent or manage future dates spillage in Power BI.
Solution
Let’s take a look at this problem and ways this can be solved.
Table of contents
- Sample Dataset
- Approach 1: Using ISINSCOPE + TODAY() or ISINSCOPE + MAX Sample_Survey_Data[ResponseDate]
- Approach 2: Using MAX Date > TODAY() or MAX Date > MAX Sample_Survey_Data[ResponseDate]
- Approach 3: Explicitly Using Filter Dates inside CALCULATE
- Approach 4: Use of Maximum Available Data date
- Summary
Sample Dataset
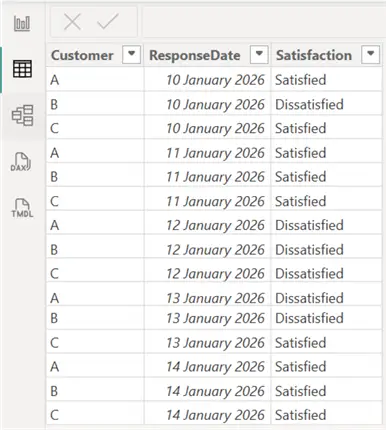
To demonstrate the approaches, I will be leveraging the dataset (Sample_Survey_Data) as seen in the image below.
I will be creating a Dates table too as seen in the image below.
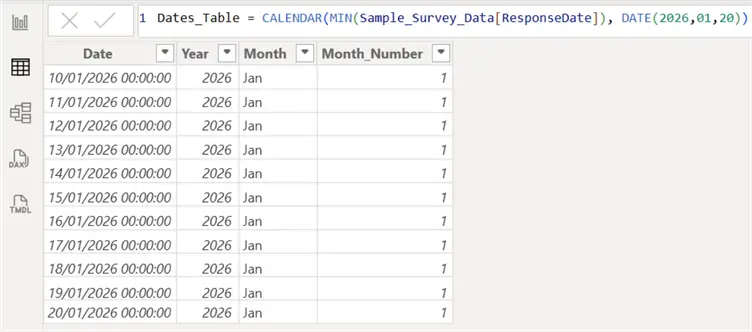
As you can see on the “Sample_Survey_Data” the dates with data spans from 10th to 14th January 2026. But on the other hand, the Dates Table has dates that go beyond the 14th January up to 20th January. Note that in your case, these dates might even be months or years of dates in the future without data.
DAX Code
Before describing some approaches we can leverage to manage this issue, I will need to create the base measure to ensure this is clear enough. As seen in the DAX code below, I have created two measures that calculate the Count of Satisfied Responses and a Month-to-Date measure to calculate the MTD of Satisfied Responses.
Satisfied Count =
CALCULATE(
    COUNTROWS(Sample_Survey_Data),
    Sample_Survey_Data[Satisfaction] = "Satisfied"
)
Satisfied MTD =
CALCULATE(
[Satisfied Count],
DATESMTD(Dates_Table[Date])
)Charted Data
Having defined the base measures, let’s see how the issues reflect on a line chart in Power BI as seen in the image below. I will be using the “Satisfied MTD” in my Y-axis, and the Dates column from my Dates Table on my X-axis.
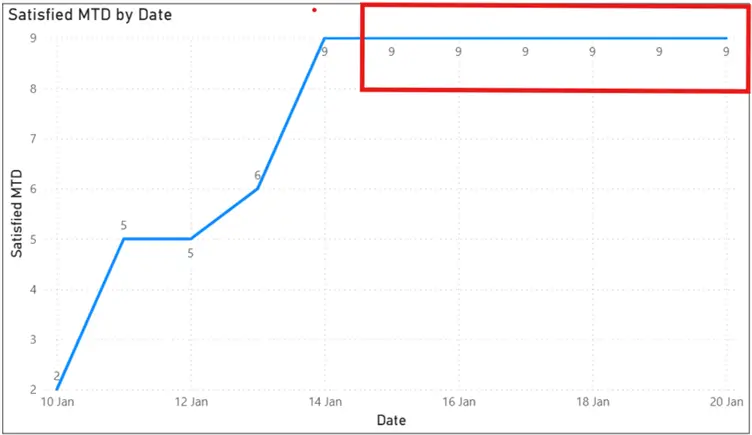
As you can see on the line chart, the issue begins after 14th January (which had the last date in my data table). This can be very misleading to reporting users.
So how can we prevent or manage this issue?
Approach 1: Using ISINSCOPE + TODAY() or ISINSCOPE + MAX Sample_Survey_Data[ResponseDate]
This approach is very simple and efficient. It ensures the logic only applies when the Date is on the axis of the visual. It also identifies future dates and then prevents Power BI from plotting on those dates. See the DAX code example below.
Using ISINSCOPE =
IF(
ISINSCOPE(Dates_Table[Date]) && MAX(Dates_Table[Date]) > MAX(Sample_Survey_Data[ResponseDate]),
BLANK(),
[Satisfied MTD]
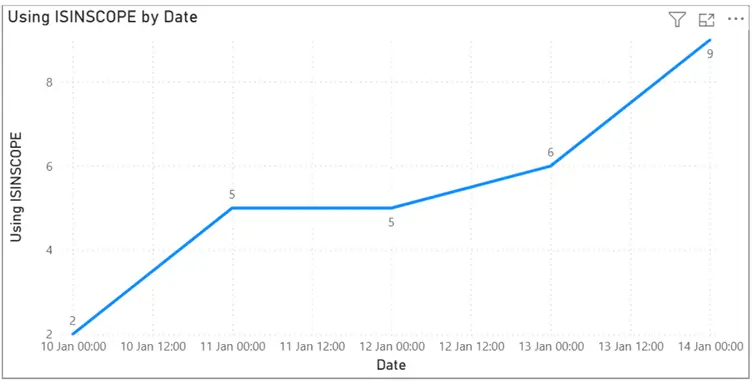
)The advantage of using this approach includes that it keeps totals intact, prevents future dates, and its safe for drilldowns.
The output chart from using Approach 1 is as seen in the image below.
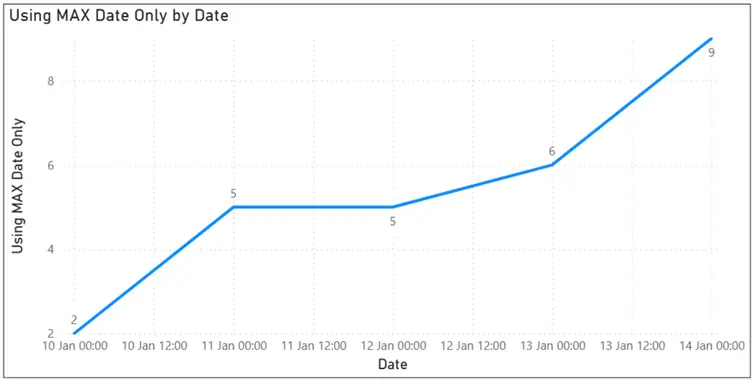
Approach 2: Using MAX Date > TODAY() or MAX Date > MAX Sample_Survey_Data[ResponseDate]
This approach is also simple, but its less flexible. But caution should be taken when using it as it may suppress totals, less predictable in some visuals like matrices, and can be found to misbehave in some multidate contexts.
See an example in the DAX code below.
Using MAX Date Only =
IF(
    MAX(Dates_Table[Date]) > MAX(Sample_Survey_Data[ResponseDate]),
    BLANK(),
    [Satisfied MTD]
)
The scenarios where this approach might be more useful include where totals are not required or you just require a quick prototype.
The output chart from using Approach 2 is as seen in the image below.
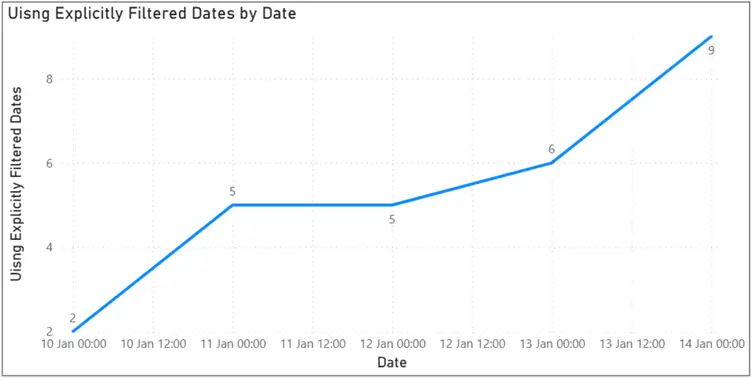
Approach 3: Explicitly Using Filter Dates inside CALCULATE
This approach can be used without ISINSCOPE used in Approach 1. It is very explicit in nature. However, it is important to note that is might not work well with time intelligence logic, it can also override slicers.
See an example in the DAX code below.
Using Explicitly Filtered Dates =
CALCULATE(
    [Satisfied MTD],
    Dates_Table[Date] <= MAX(Sample_Survey_Data[ResponseDate])
)
The output chart from using Approach 3 is as seen in the image below.
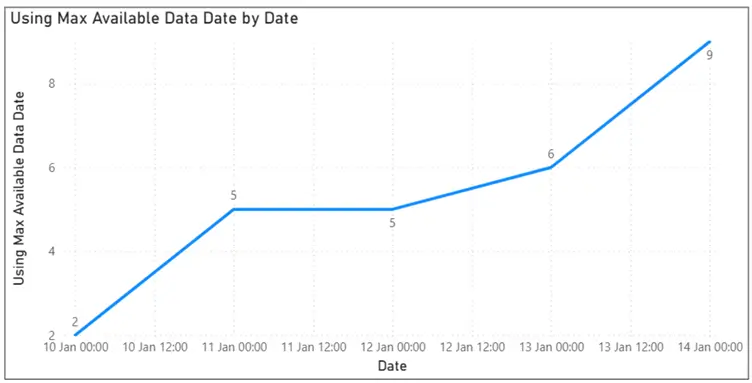
Approach 4: Use of Maximum Available Data date
This could be described as a more enterprise standard approach where we anchor measures to the most recent dates with data.
Like the other approaches already mentioned, this approach will ignore empty future dates, align visuals with actual available data, and additionally, it handles data that arrives late.
An example of how to implement this is seen in the code below.
Using Max Available Data Date =
VAR _LastDataDate =
    CALCULATE(
        MAX(Sample_Survey_Data[ResponseDate]),
        ALL('Dates_Table')
    )
RETURN
IF(
    MAX('Dates_Table'[Date]) > _LastDataDate,
    BLANK(),
    [Satisfied MTD]
)
The image below shows how approach 4 has solved this problem.
Summary
In summary, it is also possible to leverage a visual-level filtering where the “Dates” column from the dates table is applied on a visual filter to be “less than or equal to today”. But there are loads of caveats in using this approach including that it is not reusable, does not protect measures elsewhere, can break consistency, and is easy to forget. A DAX-based approach would always be a better option.
It is now clear from this article that in these sorts of scenarios, unless we explicitly use an approach in DAX, Power BI would not naturally know which dates are valid.
It would be great to learn from the community how you approach these sorts of scenarios in your reporting.
Key Takeaways
- Power BI often suffers from date spillage issues when measures spill into future dates on charts, especially with DAX calculations like MTD and YTD.
- The article presents several approaches to manage date spillage: using ISINSCOPE, applying MAX date checks, filtering with CALCULATE, and anchoring to the maximum available data date.
- Approach 1 ensures measures only apply when dates are relevant and maintains totals, while Approach 2 is simpler but may suppress totals.
- Approach 3 is explicit but may not work well with time intelligence, and Approach 4 focuses on the most recent data date for accuracy.
- Summarizing, a DAX-based solution for date spillage is crucial as Power BI does not automatically determine valid dates.
Next Steps
- You can read more about the DAX ISINSCOPE function here.
- Read more about the DAX MAX function here.
- View and read my other articles here.
- Try this tip out in your own data as business requires.

Kenneth A. Omorodion is a Microsoft Certified Solutions Associate (MCSA) with 12+ years of enterprise application experience in Power BI, DAX, Microsoft Fabric, Business Intelligence, data warehousing, SSRS, T-SQL, and Azure. Beyond his technical skills, Kenneth has expertise working with stakeholders’ and business leaders to help them better understand key insights. He has a great track record of successfully delivering full life cycle Business Intelligence and data solutions to organizations with measurable business impact.
- MSSQLTips Awards
- Achiever Award (75+ Tips) – 2025
- Author of the Year-2021
- Author Contender-2022/2023/2024


