Problem
How do I calculate MTD, QTD, YTD and Running Total in Power BI?
Solution
In this tip, I will walk through a method to calculate MTD, QTD, YTD and running total in Power BI. This method is useful in stock calculations and balance sheet calculations.
Calculate Running Total in Excel and Power BI
Running total will provide the total at a given point in time without having to sum the entire sequence each time.
Calculating Running Total in Excel
First let us understand how to calculate the running total in excel with sample data.
We have collected daily web page views of a specific website for our analysis. Now we want to calculate the cumulative total (Running Total). In Excel, the sum formula can be used with absolute and relative references to calculate the running total. Let’s create a new column “Cumulative Total” in column C and update the formula as “=SUM(SB$2:132)”
For the first row, the value of cumulative total is the same as number of views for that day. Now let us copy the formula and apply it to all the rows. As per the screenshot, the cumulative total has been calculated correctly across all the rows. The below screenshot represents the sample data with a running total calculation in Excel.

Calculating Running Total in Power BI using DAX expression
The ideal Power BI data model should have a date table that other tables can reference for analysis. The previous Creating a Date Dimension Table in Power BI has detailed information on creating the data table in Power BI. The below screen shows the date table and its attributes.

As a first step, I would like to import the Date dimension table created in the previous tip. For convenience purposes, I have created and stored the Date dimension as a Power BI template. This template will be imported into the current Power BI model.
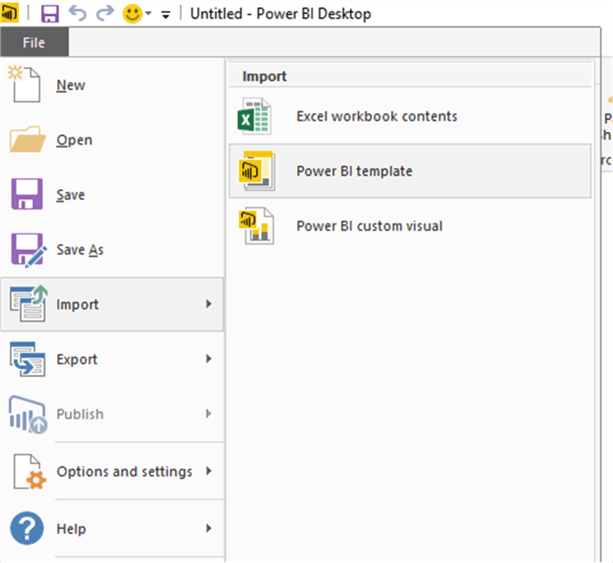
Click on the File > Import > Power BI Template to select the “Date_Dimension” template.
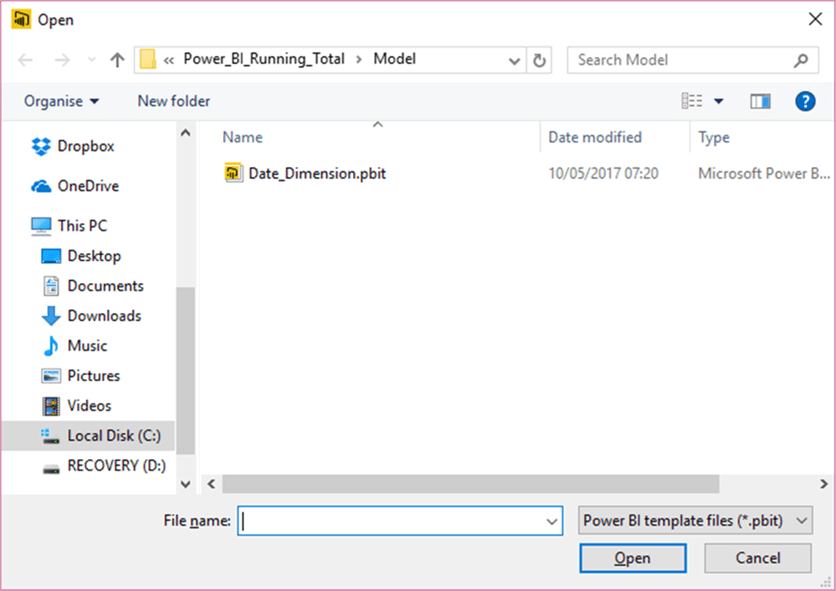
Now select the “Date_Dimension” template to import.
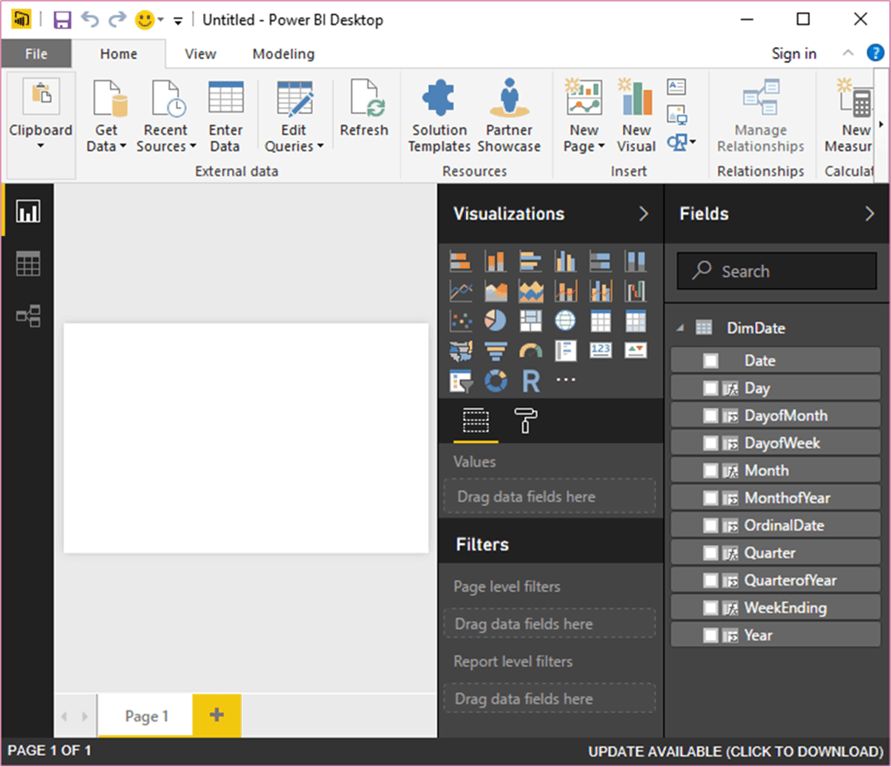
Once imported, we can see the Date dimension table as per the screenshot below.
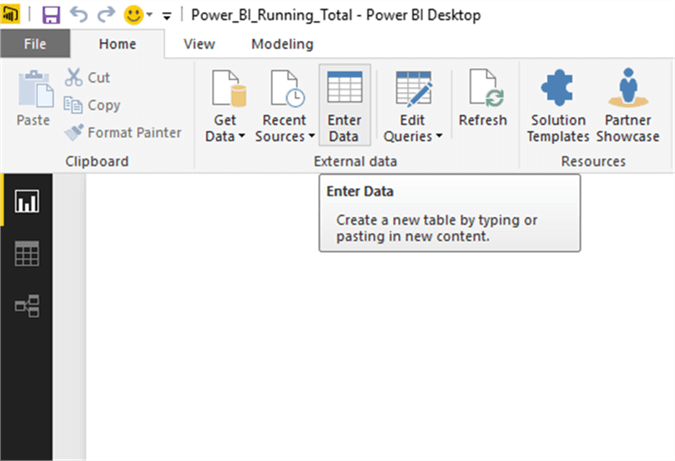
Let us create a new table in Power BI and key in sample data. This table will store the webpage views for each day. I have created the “Weblog” table with two columns Date and PageViews which is the number of views to store the details. This can be done by clicking “Enter Data” on the Home ribbon.
It will launch a separate window where you can update the column name and enter sample data as mentioned in the screenshot below. The below screenshot confirms that the table has been created with sample data.

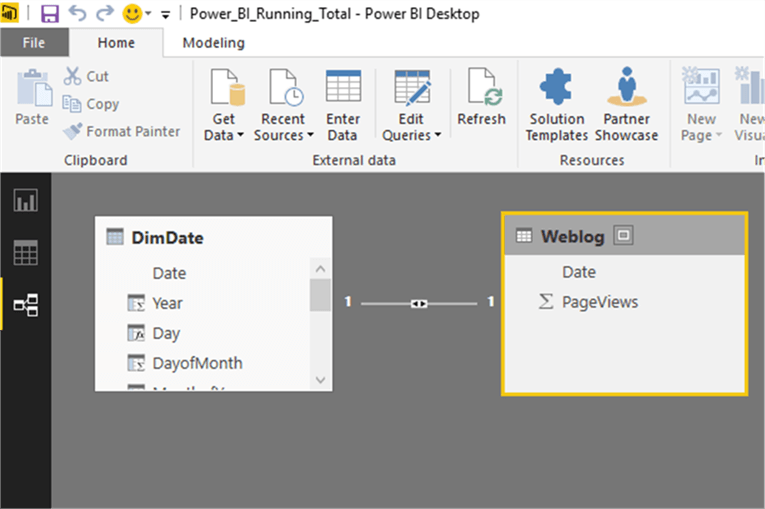
Once the table has been created, it can be seen on the data mode as per the screenshot below.

It is mandatory to create a relationship between the Weblog table and the Date dimension table on the date column. All the time related functions will work only if the relationship has been defined correctly. The below screenshot represents the relationship between the tables.
Calculating MTD in Power BI
Now let us create a new column “MTD” to calculate Month to Date. A new column has been added and the below DAX expression has been used to calculate MTD.
MTD = TOTALMTD(SUM(Weblog[PageViews]),DimDate[Date])

MTD Calculation Results
The page views of 12th Dec has been added to the 15th Dec to calculate the MTD as at 15th Dec and it has been calculated as 60 (25 + 35). However the 2nd Jan page views has been added to the 1st Jan page views and the MTD has been calculated as 30 (20+10).
Calculating QTD in Power BI
Now let us create a new column “QTD” to calculate Quarter to Date. A new column has been added and the below DAX expression has been used to calculate QTD.
QTD = TOTALQTD(SUM(Weblog[PageViews]),DimDate[Date])

QTD Calculation Results
The page views of Jan and Feb have been added to calculate the QTD as at 3rd Feb and it has been calculated as 85. However the April and May views have been added and the QTD has been calculated as 55.
Calculating YTD in Power BI
Now let us create a new column “YTD” to calculate Year to Date. A new column has been added and the below DAX expression has been used to calculate YTD.
YTD = TOTALYTD(SUM(Weblog[PageViews]),DimDate[Date])

YTD Calculation Results
The page views of Dec 2016 has been added to calculate the YTD as on 15th Dec and it has been calculated as 60. However the Jan, Feb, April and May views have been added and the YTD has been calculated as 140.
Calculating Running Total in Power BI
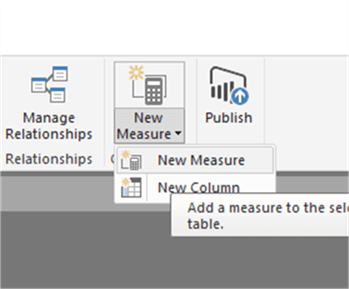
Now let us create a new measure to calculate the “Running Total”. New measure can be created by clicking on the new measure button on the home ribbon (Data tab).
We will be using the Calculate function to derive the Running Total.
Calculate Function
The Calculate function will evaluate the given expression based on the context defined by the filters.
Calculate function format:
CALCULATE(<expression>,<filter1>,<filter2>...)
The expression used in the first parameter is as same as a measure. The filter expression is a boolean expression. We will be using the calculate function to calculate the Running Total. Now let us add a measure “Cumulative Page Views” and use the formula below.
CumulativeTotal = CALCULATE(Sum(Weblog[PageViews]),FILTER(ALL(DimDate[Date]),DimDate[Date] <= Max(DimDate[Date])))
Calculation Details
There are two filter expressions which have been mentioned in the calculate function. This expression returns the list of all the dates that are less than or equal to the last date in the current selection. The filter must be applied to the date columns in the date table. This is the actual date table in the model.
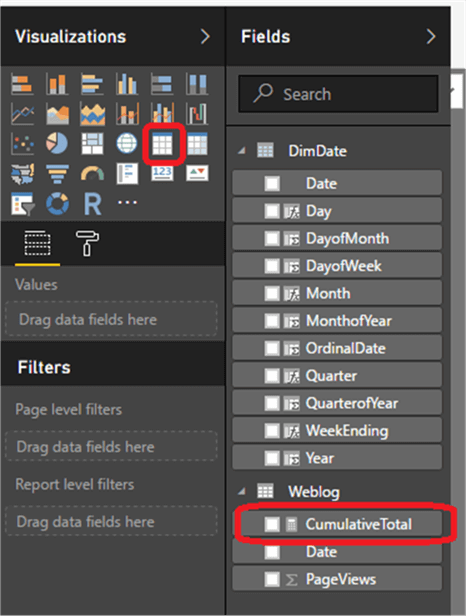
The below screen shot represents the DAX expression for the new measure. As it is a measure, it is not visible in the table view.

Running Total Calculation Results
We will be creating a small report to validate the Running Total measure. Let us add a new table from the visualization as per the screen shot below.
Let us add the Columns Date, Page Views, YTD and Running Total to the data table in the visualization as per the screenshot below.

It is confirmed that the cumulative page views are calculated without year boundaries as per the screenshot above.
Summary
The concept of Cumulative/Running total is simple and it is extremely useful in day to day use. The calculation can also be used to build historical / predicted data analysis models.
Next Steps
- Read about Calculate function.
- Read other Power BI Tips here.

Nat Sundar is working as an independent SQL BI consultant in the UK with a Bachelor’s Degree in Engineering. He has considerable years of experience with the UK Financial Services Industry (mainly in Insurance and Investment Banking).
He is passionate about SQL Server, SSIS, SSAS, SSRS and MDX. He has presented at SQLBits, SQLPass and the SQL London User Group. He has special interest towards Continuous Integration, Continuous Delivery and Deployment automation for the SQL BI (SSIS, SSAS and SSRS) stack.
He can be contacted at sqlnat@gmail.com, via LinkedIN and on Twitter at @SQLNat.


great explaination , no one can explain better then this step wise