Problem
Sometimes, users need simple functionality to invoke basic arithmetic operations like addition, subtraction, multiplication, and division without invoking complicated DAX functions in Power BI. We can do that using the standard calculation option in the Power Query Editor of Power BI. Furthermore, this option also includes other calculations like integer-divide, modulo, etc. In this tip, we will outline the basic process of using this calculation option and where it might be relevant to the data analysis process.
Solution
You are most likely familiar with the basic arithmetic operations: addition, subtraction, multiplication, and division. Not only are these operations among the first things we learn in school, but they are also a very common use case in our day-to-day lives. Need to scale up a recipe? Multiply. Need to divide a pack of cookies evenly among your children? Divide. Need to do taxes? You will probably have to use a combination of all the operations above.
Needless to say, we are very familiar with these operations, at least on paper. But what if we need to implement these same operations in a more complicated setting? For instance, consider how to standardize a variable in Power BI. Since there is no native functionality for this, we will have to resort to the standard calculations option in the Power Query Editor.

Let’s take a look at the different functions available under the standard calculation option:
- Add: Summing up values is a common practice, especially when dealing with numerical data. Aggregating sales data and computing total revenue or profit all use the addition operation.
- Multiply: We can always multiply a constant with numerical data to scale it. This practice of feature scaling is especially common in Machine Learning, where it allows the gradient descent algorithm to converge faster.
- Subtract: Subtraction allows us to measure changes. For instance, in baseline comparison, we can subtract the baseline quantity from all other values to allow comparison in relative terms. Furthermore, it is also a vital operation in the mean normalization of a variable.
- Divide: Division is similar to multiplication in terms of scaling. For instance, we divide a random variable by its standard deviation to ensure a variance of 1 after the operation. This operation is also part of the mean normalization process, as we will see later.
- Integer-Divide: This operation is essentially the same as the normal division operation, except it retains the whole number in the quotient and discards any decimal terms. This property is especially useful in the process of binning or discretizing continuous data into discrete intervals.
- Modulo: This operator provides the remainder after a division. For instance, 10 mod 10 is 0, as 10 evenly divides 10 to yield 1. However, 1 mod 10 returns 1 as the remainder is 1 when we divide 1 by 10. This operation is often used to identify cycle-type patterns in data.
- Percentage: The percentage operation in the Power Query Editor multiplies a data series with a certain percentage. For example, multiplying a column by 200% implies that the values in each cell will be doubled. Again, this can be used for scaling purposes.
- Percentage-Of: Here, we do a relative analysis, finding the percentage of all the observations in a column relative to a given value. Later in this tip, we will see how this operation can be helpful.
Creating a Sample Data in SQL Server
We need a dataset before we can explore how to implement these operations using the statistical calculations option in Power BI. To do so, we will first create an example database with relevant tables for analysis purposes.
To get started, we will first create our database by executing the following command:
--MSSQLTips.com
CREATE DATABASE std;
USE std;
First, we will create two tables containing scores for two entrance exams conducted by a hypothetical firm for hiring purposes. Let’s run the following queries:
--MSSQLTips.com
CREATE TABLE exam1_scores
(
    [name] VARCHAR(255),
    [score] FLOAT
);
--MSSQLTips.com
CREATE TABLE exam2_scores
(
    [name] VARCHAR(255),
    [score] FLOAT
);
Now, we can insert normally distributed values into these tables. We are using a normal distribution for the scores because most real-life scenarios, such as scoring, can be modeled using this distribution.
As we can see below, 14 candidates attempted exam 1.
--MSSQLTips.com
INSERT INTO exam1_scores VALUES
('JA', 7.8),
('KL', 13.9),
('BS', 19),
('AA', 9.9),
('PA', 11.7),
('LQ', 8.2),
('JJ', 14.1),
('JK', 13.8),
('LA', 14.5),
('MA', 8.4),
('WJ', 16.1),
('NK', 6.3),
('LM', 10.3),
('AS', 17.3);
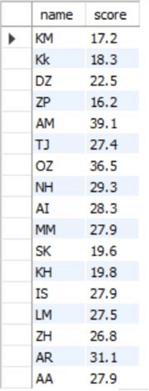
Whereas 17 candidates attempted exam 2.
--MSSQLTips.com
INSERT INTO exam2_scores VALUES
('KM', 17.2),
('KK', 18.3),
('DZ', 22.5),
('ZP', 16.2),
('AM', 39.1),
('TJ', 27.4),
('OZ', 36.5),
('NH', 29.3),
('AI', 28.3),
('MM', 27.9),
('SK', 19.6),
('KH', 19.8),
('IS', 27.9),
('LM', 27.5),
('ZH', 26.8),
('AR', 31.1),
('AA', 27.9);
We can visualize these tables below by executing the following command:
--MSSQLTips.com
SELECT * FROM std.dbo.exam1_scores;

--MSSQLTips.com
SELECT * FROM std.dbo.exam2_scores;
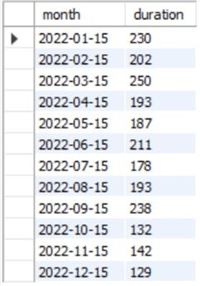
Both of these exams are conducted simultaneously every month. Suppose we also have data on the total duration of each monthly exam. To model this, let’s create a table to store this data:
--MSSQLTips.com
CREATE TABLE total_time
(
    [month] DATE,
    [duration] INT
);
Now, we can also populate this table to contain relevant values.
--MSSQLTips.com
INSERT INTO total_time VALUES
('2022-01-15', 230),
('2022-02-15', 202),
('2022-03-15', 250),
('2022-04-15', 193),
('2022-05-15', 187),
('2022-06-15', 211),
('2022-07-15', 178),
('2022-08-15', 193),
('2022-09-15', 238),
('2022-10-15', 132),
('2022-11-15', 142),
('2022-12-15', 129);
We can view this table by running the following command:
--MSSQLTips.com
SELECT * FROM std.dbo.total_time;
Using the Standard Calculation Option in Power BI
Now that we have a dataset, we can import it from the SQL Server to Power BI and then analyze it using the standard calculations option. To get started, let’s go through the following steps.
Step 1: Importing the Dataset
First, we need to import our dataset from SQL Server. To do so, click on the SQL Server icon (below) in the Data section of the Home ribbon in the main interface of Power BI.

The SQL Server database window will open. Enter the relevant server and database credentials, then click OK at the bottom.

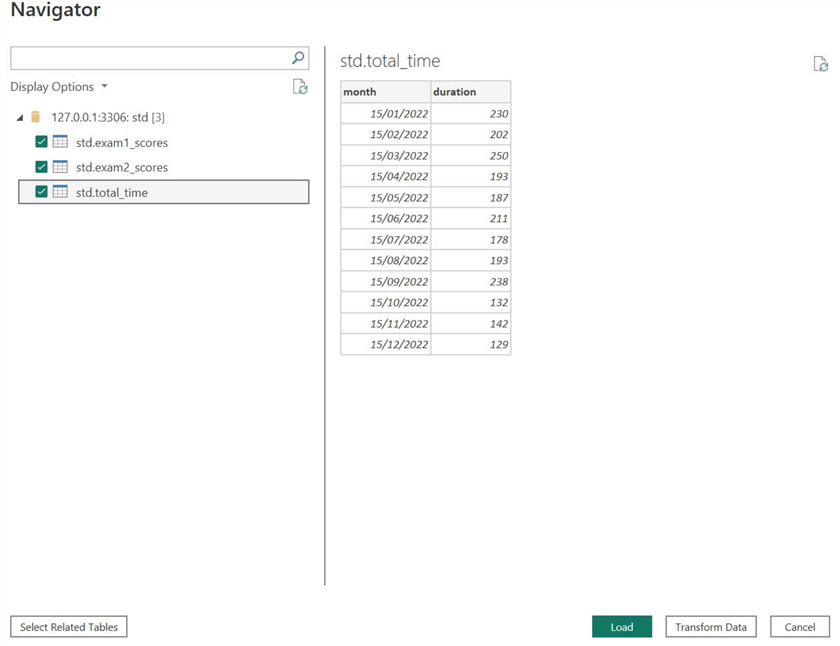
If Power BI successfully connects with your database, the Navigator window will open, as shown below. Beneath the Display Options, select all relevant tables and click Transform Data at the bottom to go to Power Query Editor. At this stage, Power BI also allows users to preview the tables.
You are now in Power Query Editor. The “Queries [3]” tab contains all of our tables (queries).

Step 2: Subtraction and Division
Consider the following scenario: Your firm is hiring for a general managerial position, and so far, 31 candidates have successfully passed the initial screening and final interview stage. The hiring body is tied between two candidates: WJ and AR. Both candidates have a similar skill set and impressed the interviewers more than the other candidates. The only distinguishing factor between the two is their scores in the interview entrance exam.
WJ took exam 1 and scored 16.1/30. On the other hand, AR took exam 2 and scored 31.1/50. Since the exams are separate, how do we compare and judge which candidate performed better? One way would be to calculate the aggregate percentage of the two candidates; however, we want to judge them with respect to the other exam takers.
The answer is variable standardization, which allows us to fairly compare different distributions by ensuring that the standardized distribution has a mean of 0 and a standard deviation of 1. This can be achieved by the following formula, where ![]() are the mean of the original distribution and its standard deviation, respectively:
are the mean of the original distribution and its standard deviation, respectively:
In short, we can standardize the scores of exam 1 and exam 2 and see which candidates’ scores are higher to make a judgment.
Let’s start by standardizing the exam 1 scores. To do so, we also need to find the mean and variance of the score column, which we can see below.

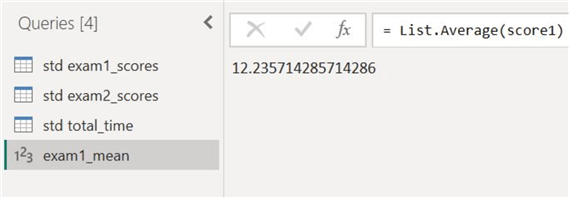
To find the mean of the score column of exam 1, right-click on the column and select Add as New Query, as shown below.

Next, go to the Statistics option and select Average to get the mean.

The mean score of candidates who took exam 1 is as follows:
Similarly, to get the standard deviation of the exam 1 scores, we add the score column as a new query and then select the Standard Deviation option from Statistics.

The spread of the exam 1 scores is as follows:

Now, we repeat the same methodology and calculate the mean score and standard deviation of exam 2. Afterwards, we will get the following results:


To standardize both exam 1 and exam 2 scores, we first need to subtract the mean of each respective distribution from its data points. As shown below, we can do so by selecting the score column and then selecting the Subtract function from the Standard option.

The Subtract dialog box will open. Enter the mean value of the exam 1 scores and click OK.

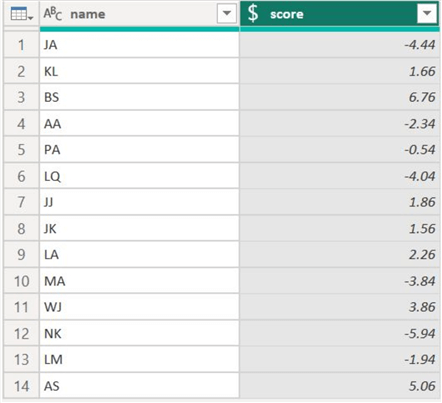
Below is the score column with the mean zeroed out. Some data points are negative, as those scores were initially below the mean.
We now need to divide the zero-mean scores by the standard deviation of the original score 1 column. Select the Divide function as shown below.

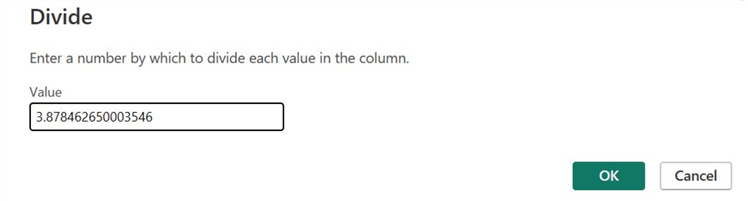
The Divide dialog box will appear. In it, you can enter the standard deviation of exam 1 scores and then click OK.
Our standardized exam 1 scores are as follows:

Similarly, we can also standardize the exam 2 scores to get the following distribution:
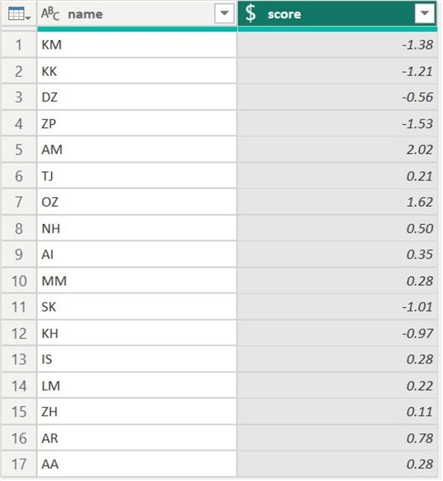
To compare, candidate WJ has a standardized score of 1, whereas the competing candidate AR’s score is 0.78. Since WJ’s score is higher than AR’s, WJ’s are more likely to be hired by the firm.
Furthermore, we can also verify that the standardized scores are indeed standardized. Theoretically, the mean and standard deviation of the standardized column should be 0 and 1, respectively. As a demonstration, we have duplicated the standardized score column of exam 2 and calculated its mean and standard deviation to get the following results:
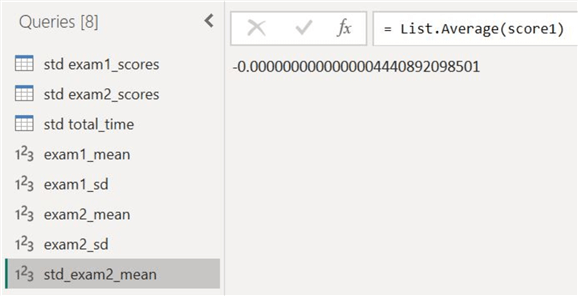
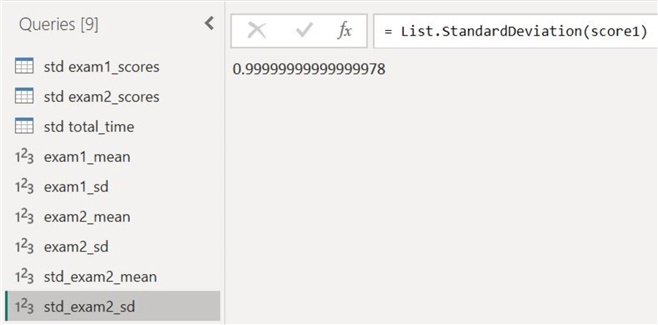
As we can see, the mean and standard deviation are indeed very close to 0 and 1, respectively.
Step 3: Integer-Divide and Modulo
Remember our table containing information about exam duration? Let’s see how integer divide and modulo operations can help split the duration column into hours and minutes.

For our Hours column, we first duplicate our duration column. We can do this by right-clicking on the duration column and selecting Duplicate Column, as shown.

Next, select the new column and choose the Integer-Divide option, as shown below.

The Integer-Divide dialog box will appear. To get the hours from the duration column, integer divide it by 60, as it was initially in minutes.

The Hours column can be seen below. It shows that a duration of 230 minutes contains a whole 3 hours.

To get the remaining minutes, we again duplicate the original duration column and apply the Modulo function, as shown below.

The Modulo dialog box will appear. Since we want the remaining minutes (after dividing the duration by 60), we will add the value 60 here and then click OK.

The Minutes column can be observed below. We have effectively deconstructed the duration column into hours and minutes using the integer-divide and modulo operations.

Step 4: Percentage-Of
Let’s also conduct a baseline analysis of the duration column. We want to see how the rest of the data points fare relative to the longest duration in the dataset.
To find the maximum value in the dataset, we add the duration column as a new query and then select the Maximum function from the Statistical option to get the value below:

Go back to the total_time table, and after selecting the duration column, select Percent Of from the Standard calculations list.

The Percent Of dialog box will appear. Enter the previously calculated maximum value and then click OK.

The new Percent Of column will appear, as shown below. For the exam with a duration of 250 minutes, the percentage value relative to the maximum value is 100%, as it is the maximum value itself. This implies that the rest of the data points can only have percentages less than or equal to 100. The minimum duration of 129 minutes has a percentage of 51.6%, which means it is nearly half of the maximum value.

Conclusion
In this tip, we explored the implementation of standard arithmetic operations like addition, subtraction, division, and multiplication in Power BI. We created a specialized dataset in SQL Server, allowing us to practically demonstrate the various use cases where such calculations are necessary using Power BI and Power Query Editor.
Next Steps
Readers interested in this topic should explore the other functions in the standard calculation list. They can explore different use cases where addition, multiplication, and the percentage function will be useful.
Various functions like calculating roots, logarithms, exponents, and factorials are missing from this list. Perhaps users can explore different methods to implement these functions in Power BI.
Another essential concept is the arithmetics between two different columns. Interested users who want to delve deeper should learn how to do element-wise addition, multiplication, division, and subtraction of two columns.
Readers can also investigate implementing the dot product of columns in Power BI. Such concepts are fundamental in statistical learning methods.
Check out all the Power BI Tips on MSSQLTips.com.

Harris Amjad currently works as a Software Engineer at Strategic Systems International. He is Microsoft Certified Data Analyst and Microsoft Certified Trainer. A rigorous, task-driven Data Enthusiast with substantial experience in Data Science, Data Analysis, and Data Engineering.
- MSSQLTips Awards: Trendsetter (25+ tips) – 2024 | Author Contender – 2023, 2024 | Rookie Contender – 2022


Hi Michael
I have reviewed the steps and found nothing specific causing the option to be grayed out, except that the particular column is not numeric. Ensure that it is of the correct data type.
Let me know if I am missing out the context here.
We are assuming nothing, but it may be due to some recent updates in Power BI. Let me look into this, and will get back to you by tomorrow.
I’m Sorry, this simply did not reflect the behaviour of Power BI. Statistics is greyed out. No matter what. Is there some instruction in this tutorial assumed or missing?