Problem
Power BI can be used for many purposes and in this tip we will look at how to use Power BI to build a personal expenses score card.
Solution
Almost all banks have the facility to download bank statements in a CSV file format. In this tip, I will help you build a Personal Finance Tracker using Power BI. We will also create KPI’s and key indicators to understand how to track expenses and income.
Bank Statements
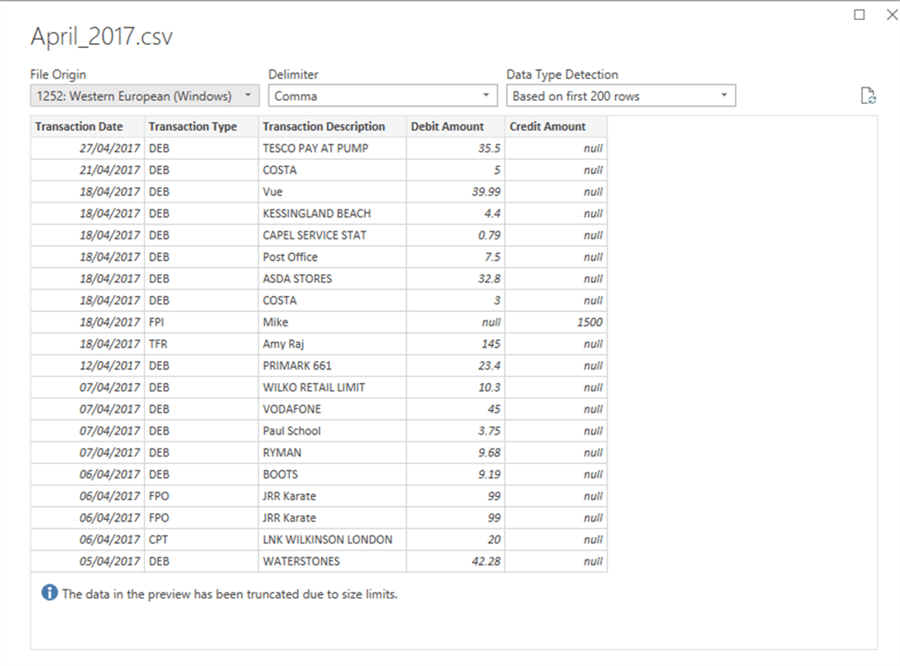
The image below represents the bank statement in a CSV format. This file has the following columns:
- TransactionDate - The date in which the actual transaction happened
- TransactionType - The type of transaction denotes the mode of transaction (Debit,Transfer,Standing Order, etc.)
- TransactionDescription - Full details of the transaction
- Debit Amount - Amount debited in case of expense
- Credit Amount - Amount credited in case of income

Import File into Power BI Desktop
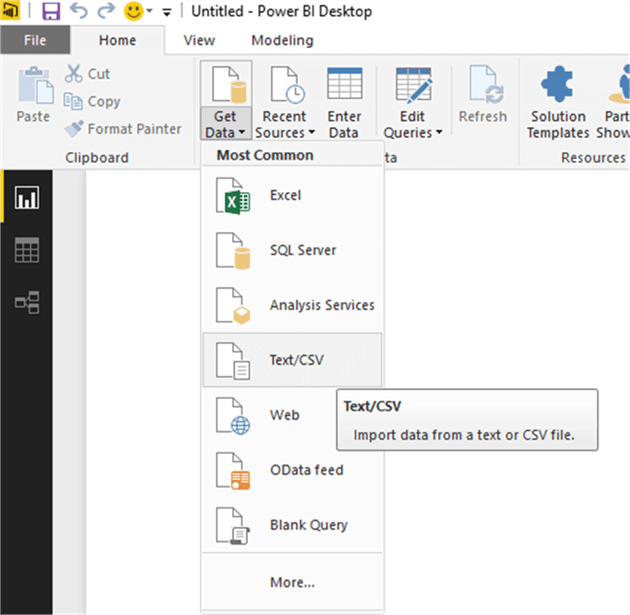
Now let’s import the bank statement file into Power BI using Get Data > Text/CSV as shown below.
Power BI has correctly identified the columns.
Now let’s edit the query to modify the properties and name this “Transactions” as shown below.
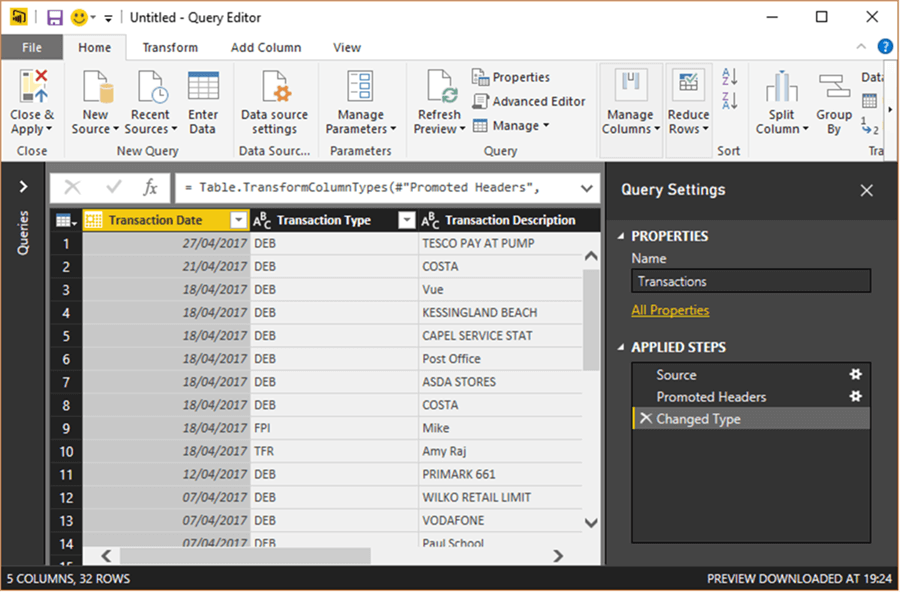
Now Close & Apply the query to save the changes.

Creating Date Table with Attributes
Now let’s create a date table using calculated tables. This previous tip details the creation of a Date table with many attributes. As per the previous tip, the date table has been created with the DAX expression below.
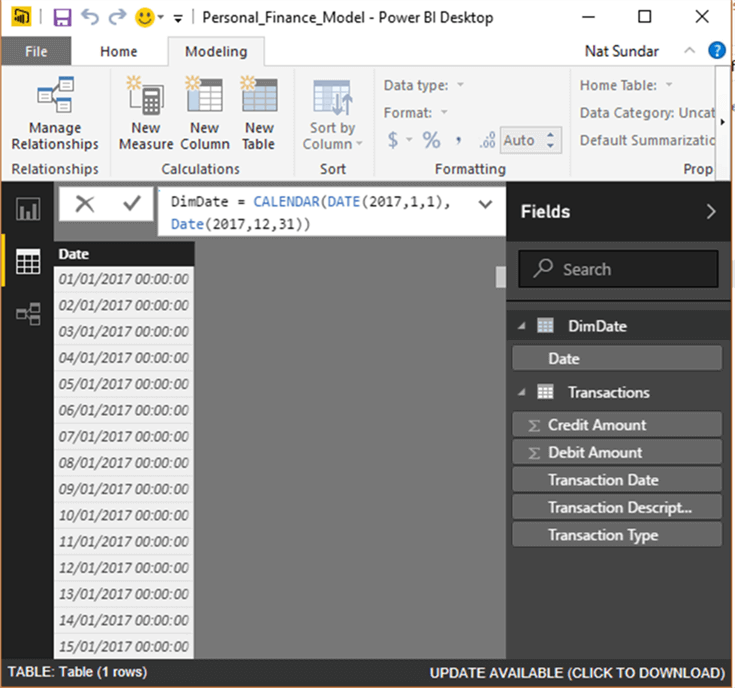
Now the date table can be extended with attributes such as Month, Quarter and Year.
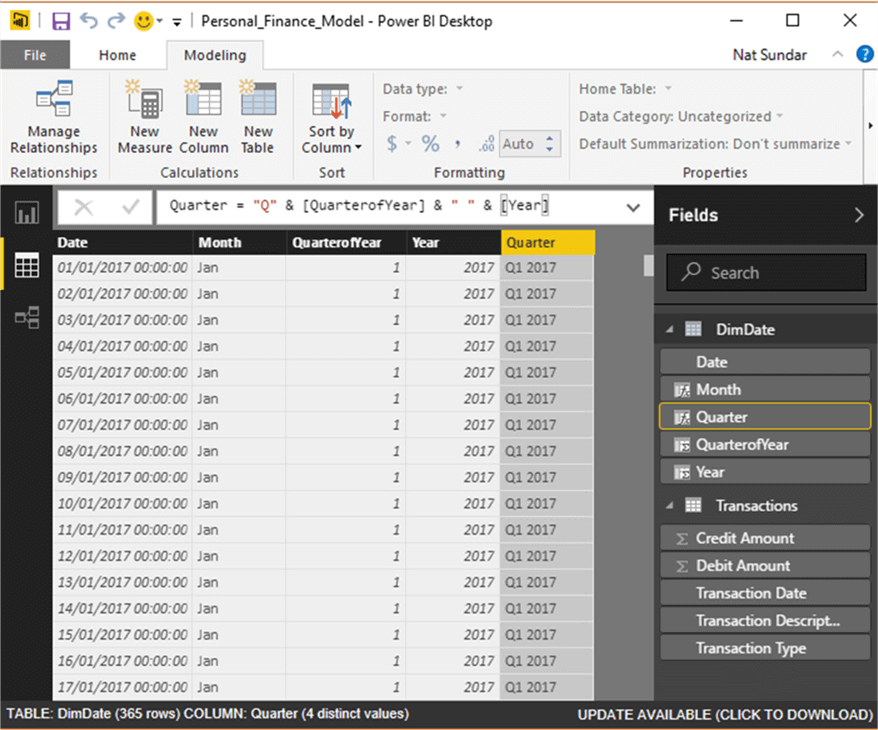
In addition, a relationship has been created between the transaction table and the date dimension table as shown below.

Create Report
Now let’s create a simple report to list all the transactions. A data table visualization has been chosen to represent the transactions. As the relationship has been created between the Date table and the Transactions, now we can make use of the additional columns defined in the Date table for reporting.
The following columns have been chosen for this report.
- Date (DimDate table)
- CreditAmount (Transactions)
- DebitAmount (Transactions)
- TransactionType (Transactions)
- TransactionDescription (Transactions)
Now the actual report can be seen below, sorted by the most expensive debit.

Creating KPI’s for Personal Expenses
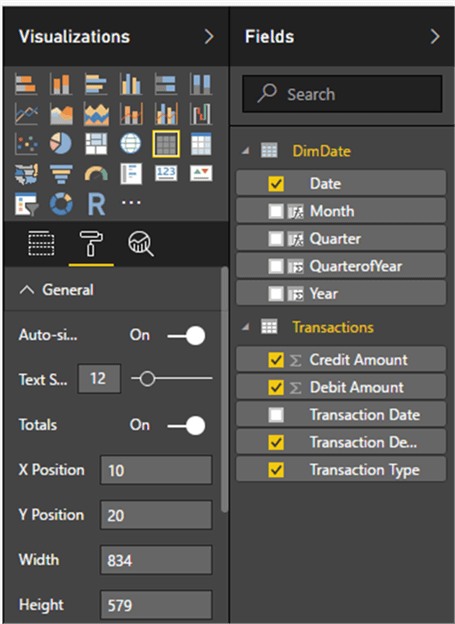
Now let’s create a simple KPI to understand the overall expense and income. This can be easily achieved by adding the DebitAmount and CreditAmount columns to a multirow card. Power BI automatically sums all the values in the table and presents them in the multicard visualization.
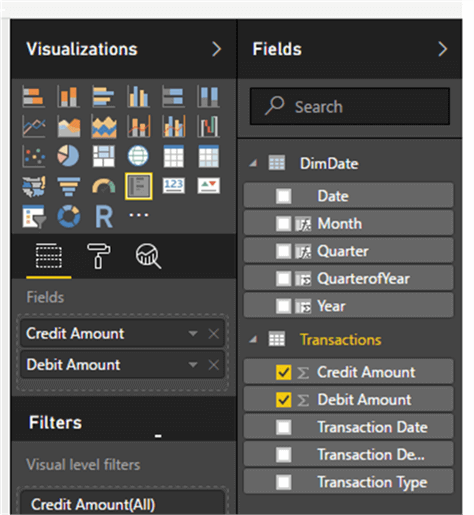
The actual report generated by Power BI can be seen below.

The report above can be enhanced by adding another key metric “Expense ratio”. Expense ratio represents the spending, when compared with the income. The below DAX expression will be used to calculate the expense ratio.
Expense Ratio = Sum(Transactions[Debit Amount]) / SUM(Transactions[Credit Amount])
As this is a ratio, this measure has been formatted as “Percentage” in the modeling ribbon.

In addition, the DebitAmount and CreditAmount columns have been formatted as currency columns with currency a symbol.
Now we can add the expense ratio measure to the multi row card and the KPI’s will appear.

Detailed Analysis
Now we have developed high level KPI’s about the expenses. As the expense ratio is higher than expected, let’s dive deeper into the expenses. To take control of our expenses, we need to know which item cost the most and the sum of the remaining expenses. Also, to allow us to analyze income versus expenses, we need to calculate “Major expense % of total expense” and “Major expense % of total income”.
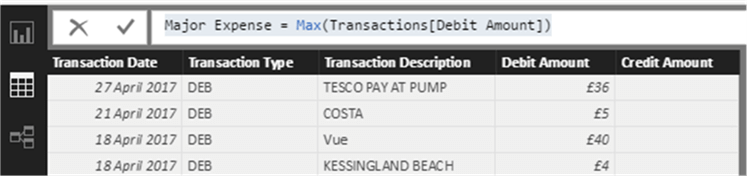
Calculating Major Expense:
Let’s create a measure “Major Expense”, with the below DAX expression. This will show us the most expensive debit.
Major Expense = Max(Transactions[Debit Amount])
Other Expenses
As we have calculated the Major expense, now we can calculate the rest of the expenses. However, calculating the rest of the expenses is a little bit difficult because we need to exclude the Major expense in the calculation. This can be achieved by using the Filter table function.
The DAX expression below will help us calculate other expenses, excluding the Major expense.
Other Expenses = SumX(FILTER(Transactions,Transactions[Debit Amount] <> MAX(Transactions[Debit Amount])),Transactions[Debit Amount])
DAX evaluates the inner most expression first. In this case, the Filter table function will be evaluated first. The Filter table function accepts two parameters, name of the table and the expression.
- Table Name - Transactions
- Expression – Transactions[Debit Amount] <> MAX(Transactions[Debit Amount]). This expression will return all the records excluding the major expense
The Filter table function returns a table which consists of expenses excluding the Major expense. The outer SumX function summarizes all the expenses and returns the results as a measure.
Measures for Expenses & Income
Before creating other metrics, we need to create measures for income and expenses. These can be created using the DAX expression below.
The Income measure can be created using the expression below:
Income = Sum(Transactions[Credit Amount])
The Expense measure can be created using the expression below:
Expenses = Sum(Transactions[Debit Amount])
Calculating Ratios
Now with the help of the measures above, we can create measures for ratios.
The “Major Expense % of Total Expense” measure can be created by using the expression below:
Major Expense % of Total Expense = [Major Expense] / [Expenses]
The “Major Expense % of Total Income” measure can be created using the expression below:
Major Expense % of Total Income = [Major Expense] / [Income]
Report Visualization
All expense measures can be added to a multi row card and the report would look like below.

Limitations
In the above example the Major expense and the sum of the Other expenses should equal the total expenses. However, if you have more than one transaction with the same highest amount, these duplicate values will be excluded because of the simple formula that was used. In a future tip, I will help you overcome this problem.
Summary
The KPI’s above are a good way to start analyzing your personal finances. This Power BI model can be extended further to analyze the expenses on daily, weekly and monthly basis. In addition, the transactions can be logically grouped as a category and the expenses can be analyzed as well.
Next Steps
- Stay tuned to read the next tip to analyze personal finance with daily expense and category analysis.
- Read more about the Summarize function.
- Read other Power BI Tips here.

Nat Sundar is working as an independent SQL BI consultant in the UK with a Bachelor’s Degree in Engineering. He has considerable years of experience with the UK Financial Services Industry (mainly in Insurance and Investment Banking).
He is passionate about SQL Server, SSIS, SSAS, SSRS and MDX. He has presented at SQLBits, SQLPass and the SQL London User Group. He has special interest towards Continuous Integration, Continuous Delivery and Deployment automation for the SQL BI (SSIS, SSAS and SSRS) stack.
He can be contacted at sqlnat@gmail.com, via LinkedIN and on Twitter at @SQLNat.


