Problem
In this tip we look at how you can use calculated tables to solve business problems when using Power BI.
Solution
By using calculated tables we can add new tables to the model that can be used to query the data. We can use a DAX expression to derive the calculated table’s values and in this tip I will walk through a few design patterns for using calculated tables to store intermediate results.
Calculated Tables
Calculated tables can be created by using the “New Table” feature in Power BI Desktop. Calculated tables store intermediate results for querying. Just like normal tables, relationships can be created with calculated tables. The columns in the calculated tables have a data type which can also be formatted. Calculated tables and their columns can be used in report visualization similar to normal tables. Calculated tables are re-calculated if the base table’s data gets updated or refreshed and they are in-memory tables.
Sample Power BI Model
I have used the “ContosoSalesForPowerBI” Power BI model in this tip. This sample Power BI model can be downloaded from here.
The model has several master tables (Product, Currency, etc.) and a transaction table (Sales). In this tip, I will be using the “Sales” table for demonstration purposes.

Design Pattern #1
The below image represents the Product master table. This table has many attributes such as ProductSubCategory, Manufacturer, Brand, Class and Style. Let us assume the manufacturer details are available only in the Product table.
Let us assume that you have been asked to generate a unique Manufacturer list from this table.
A manufacturer could supply more than one product. Hence you can see the manufacturer name multiple times. So how can we get a unique list? This is where calculated tables can be of great help.

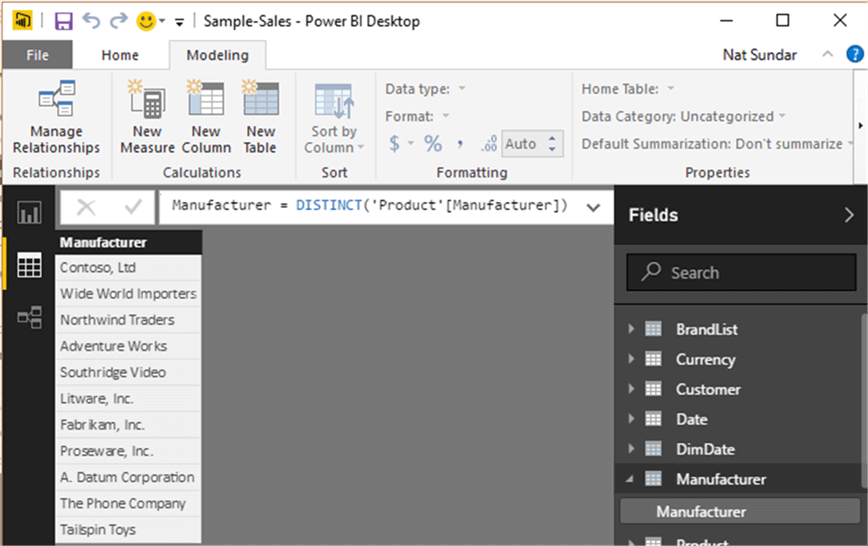
A new calculated table can be created using the “New Table” option in the modeling ribbon as shown below.

The below DAX expression will create a calculated table “Manufacturer”. In this case, the Distinct will return unique values of Manufacturer from the Product table.
Manufacturer = DISTINCT('Product'[Manufacturer])
The Calculated table “Manufacturer” is now like a normal table and it can be used in relationships and the reporting visualization.
Design Pattern #2 (Copying table)
Let us assume that we want to copy the Sales table into the Sales_History table. So that the Sales_History table can be used for ad-hoc analysis. This can be easily achieved by using the below DAX expression.
Sales_History = Sales

Design Pattern #3 (Union)
Now let us assume that we have two sales tables named “Sales_2016” and “Sales_2017” and we would like to combine the two tables for analysis.
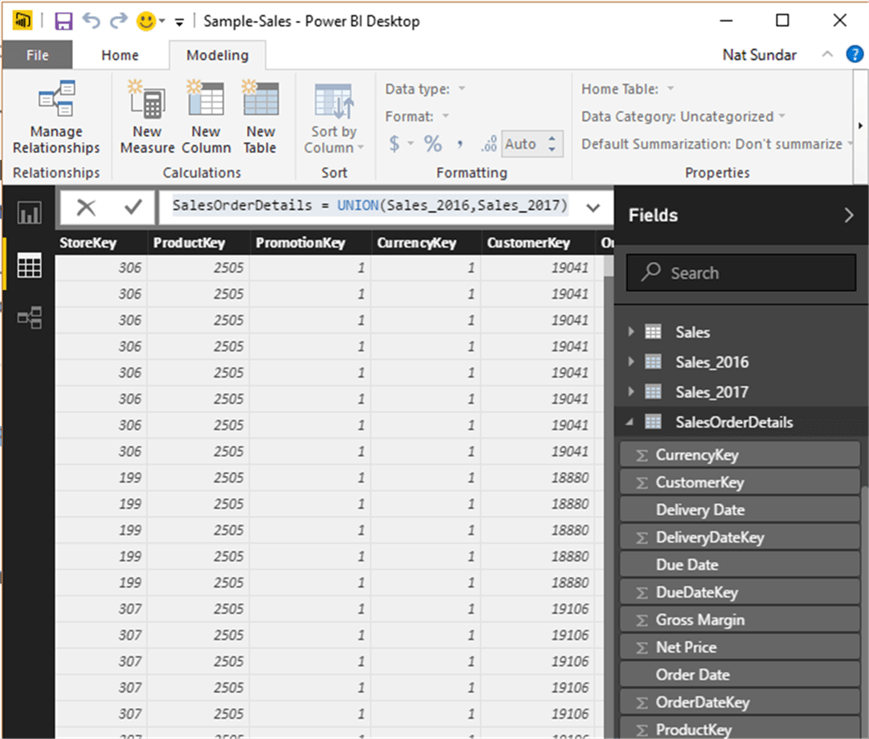
This can be easily achieved by using the Union table function in DAX. The below DAX expression can be used to combine the two Sales tables.
SalesOrderDetails = UNION(Sales_2016,Sales_2017)

The below image represents the newly created calculated table “SalesOrderDetails” using the UNION table function.
Design Pattern #4 (Summarize)
In this examples, I would like to calculate total sales for each product in the Sales table.
In SQL, the Group By clause would help us to achieve this functionality. In Power BI this can be achieved by using the DAX expression “Summarize”.
The syntax for the Summarize DAX function is below:
SUMMARIZE(<table>, <groupBy_columnName>,<Name>],<expression>])
Parameters:
- table – The name of the table where we would like to apply the groupby functionality
- groupBy_columnName - The name of the column to be used for grouping
- name – The name of the output column enclosed in double quotes
- expression -The actual calculation/expression to be applied for each group
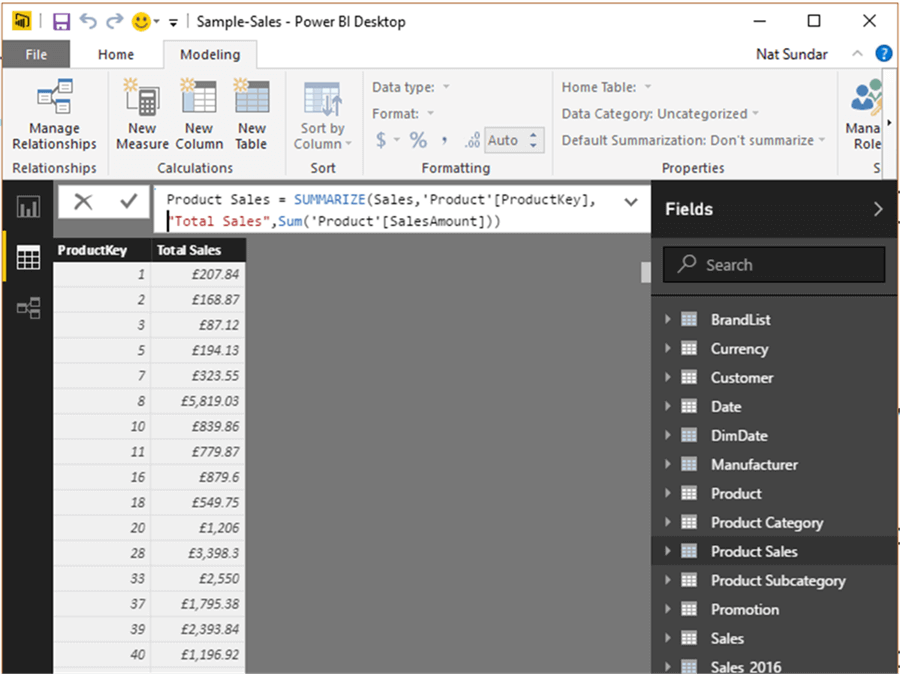
The below DAX expression will summarize the Sales table based on ProductKey and return the sum of SalesAmount for each ProductKey.
Product Sales = SUMMARIZE(Sales,'Product'[ProductKey],"Total Sales",Sum('Product'[SalesAmount]))
This DAX expression will return a table with two columns “ProductKey” and “Total Sales” as shown below.
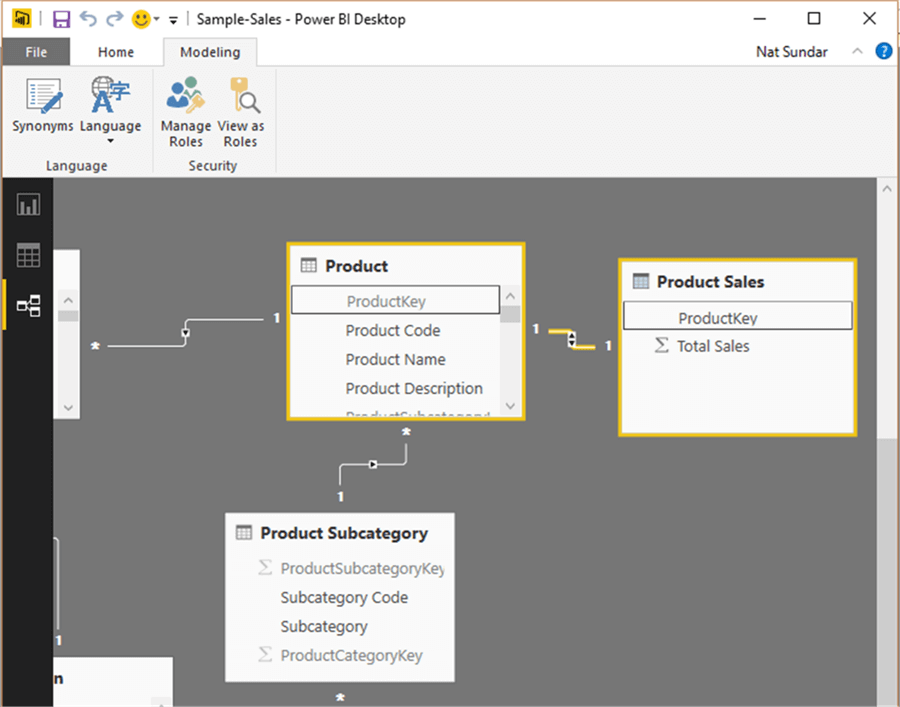
As the calculated tables are similar to normal tables, a relationship can be created as well. A relationship has been created between the ProductKey of the “Product” table and the ProductKey of the calculated table “Product Sales”.
Now a calculated column can be added to this table with the below DAX expression.
ProductName = RELATED('Product'[Product Name])

Design Pattern #5 (Top n)
Most likely, business users will be interested to understand top n performers. Now let us assume that we have a requirement to display Top 5 products based on the sales amount.
The DAX expression “TOPN” can be used to meet this requirement.
TOPN(<n_value>, <table>, <orderBy_expression>,<Order>)
Parameters:
- n_value – Number of rows to return
- table – The name of the table where we would like to apply the Top n functionality
- orderBy_expression – Order by column
- Order – Order by expression ASC or DESC
The below mentioned DAX expression will calculate and list the top 5 products based on sales amount.
Top 5 Products = TOPN(5,'Product Sales','Product Sales'[Total Sales],DESC)

Summary
Similar to the above examples, other functions such as CROSSJOIN, UNION, NATURALINNERJOIN , NATURALLEFTOUTERJOIN, INTERSECT, CALENDAR and CALENDARAUTO can be used for calculated tables.
Calculated tables can also be extremely helpful while debugging report related issues.
Since calculated tables are in-memory tables, it is recommended to estimate the table size in in advance for optimal performance.
Next Steps
- Read more about Calculated tables
- Read more about Summarize function.
- Read more about TOPN function.
- Read other Power BI Tips here.

Nat Sundar is working as an independent SQL BI consultant in the UK with a Bachelor’s Degree in Engineering. He has considerable years of experience with the UK Financial Services Industry (mainly in Insurance and Investment Banking).
He is passionate about SQL Server, SSIS, SSAS, SSRS and MDX. He has presented at SQLBits, SQLPass and the SQL London User Group. He has special interest towards Continuous Integration, Continuous Delivery and Deployment automation for the SQL BI (SSIS, SSAS and SSRS) stack.
He can be contacted at sqlnat@gmail.com, via LinkedIN and on Twitter at @SQLNat.


