Problem
SQL Server can be quite complex to monitor and troubleshoot. There are so many ways to collect and analyze data, that it is easy to overlook or just not capture the data you need to ensure SQL Server is running smoothly. In most cases, a problem is detected or you are notified of an issue but by the time you have a chance to start capturing data to determine the root cause, SQL Server is happily running again. You might get lucky once in a while and find the problem, but this is not the best approach for database management.
Solution
As with any profession, if you are truly an expert at your job, one of the most important parts is having the right tools and knowing how to use these tools. Managing a database environment is no different. Microsoft provides many tools to help you troubleshoot and manage SQL Server but these tools are disconnected and not correlated. At times, you’re just making an educated guess as to what the issue is and how to resolve the problem.
Key Items
SQL Diagnostic Manager
Idera SQL Diagnostic Manager was built to provide all the necessary components to truly monitor and tune SQL Server.
Over the past 20+ years, Idera has been perfecting SQL Diagnostic Manager to assist DBAs at all skill levels to manage, monitor, troubleshoot, and tune their SQL Server databases and servers. With an integrated data collection process to collect data at the SQL Server level and OS level, SQL Diagnostic Manager provides one interface to manage all of your databases across the enterprise along with correlated data for both current activity and historical activity. This can be done for both on-premises and cloud-based SQL Server instances.
This unified environment allows you to manage all servers equally, if needed, but also provides the ability to group database instances based on criticality, region, use, or whatever breakdown makes sense for your environment. This allows you, as the DBA, to focus on what you deem the most important. In addition, servers that may not be critical are still treated equally with data collection and analysis in case the need arises.
Unified View
One of the key components of managing one or several hundred SQL Servers is having a unified view into your environment. As someone that manages SQL Server, you don’t have time to connect to each server, one by one, to determine what is most critical. You need a quick and easy way to see your entire estate so you can act quickly. As shown in the image below, Idera SQL Diagnostic Manager lets you see all of your servers at once. Also, SQL Diagnostic Manager color codes instances that need attention, so you can quickly see what needs to be addressed. Instances in red have critical issues that should be addressed.
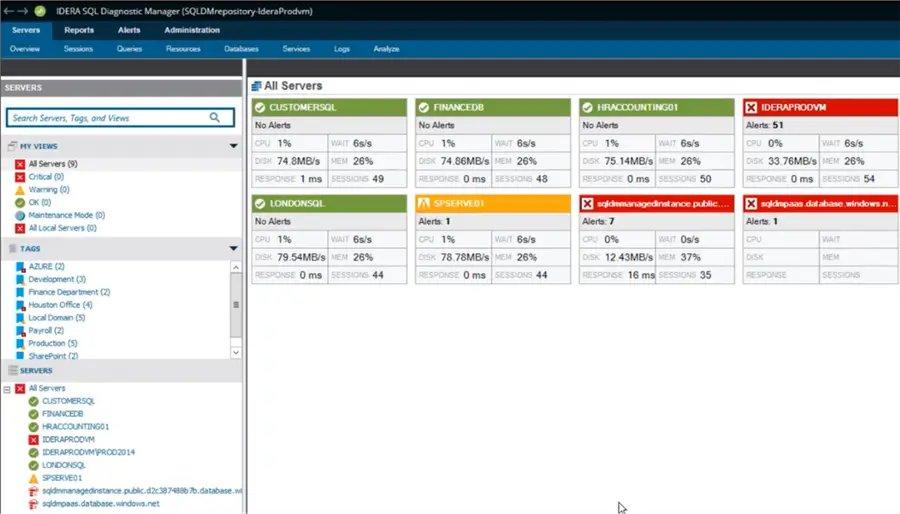
In addition, on the left side of the screen, there are options to drill into a subset of SQL Servers based on configuration and tagging servers. This is totally customizable to meet environment and management needs.
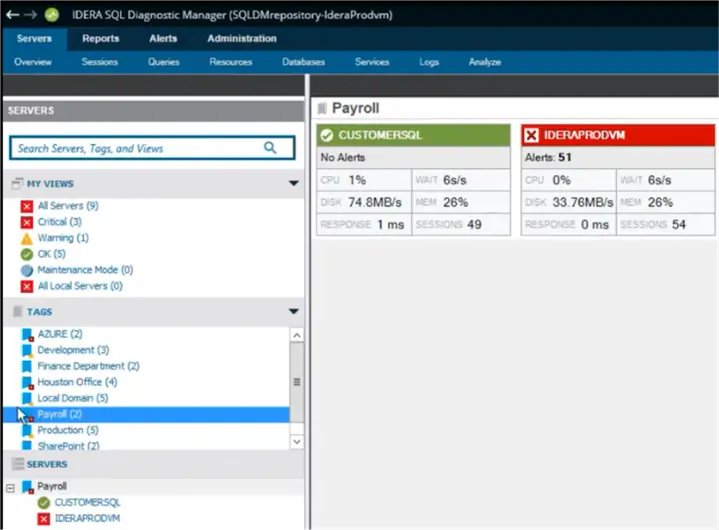
As an example, below we can see just the payroll related servers.
Deep Drill Down Capabilities
Once you have identified the SQL Server instance you want to analyze, you can drill into detailed performance metrics, diagnostic visualizations, and real-time monitoring data to quickly identify bottlenecks, investigate anomalies, and resolve issues proactively.
Based on the color-coded health indicators, we can immediately identify potential memory pressure and blocking conditions impacting active sessions. These visual diagnostics help pinpoint likely problem areas, eliminate guesswork, and accelerate root-cause analysis. With minimal navigation, you can drill into the affected components and prioritize remediation efforts.
In the following, we examine a blocking scenario, though this is just one of many ways Idera SQL Diagnostic Manager supports proactive performance analysis and issue resolution.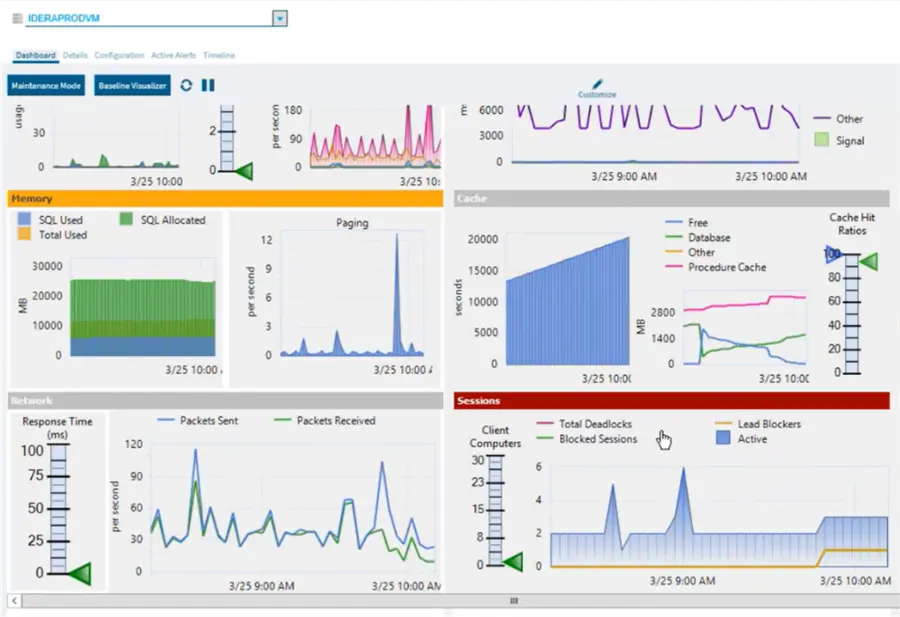
Drill into Sessions
To take the analysis further, drill into a problem area to access deeper diagnostic data, session-level details, and historical performance information. In the example below, blocking activity has been identified on this instance and can be further analyzed to isolate the cause, understand the impact, and troubleshoot the issue efficiently 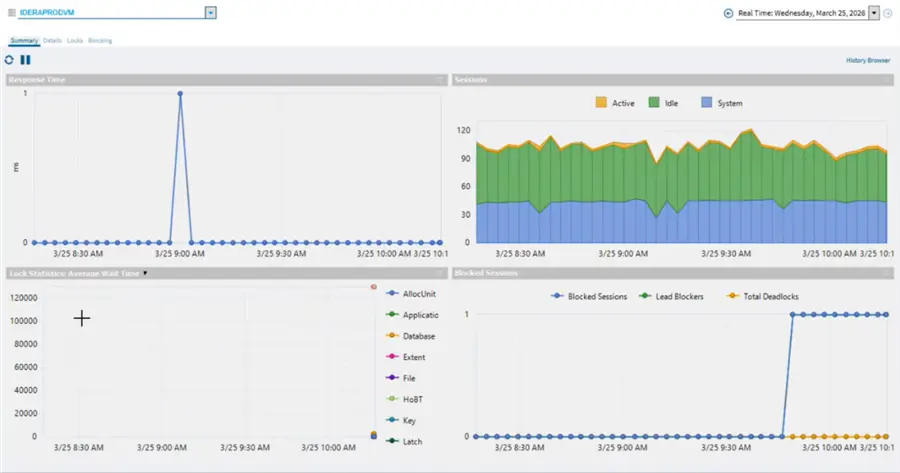
Drill into Blocking
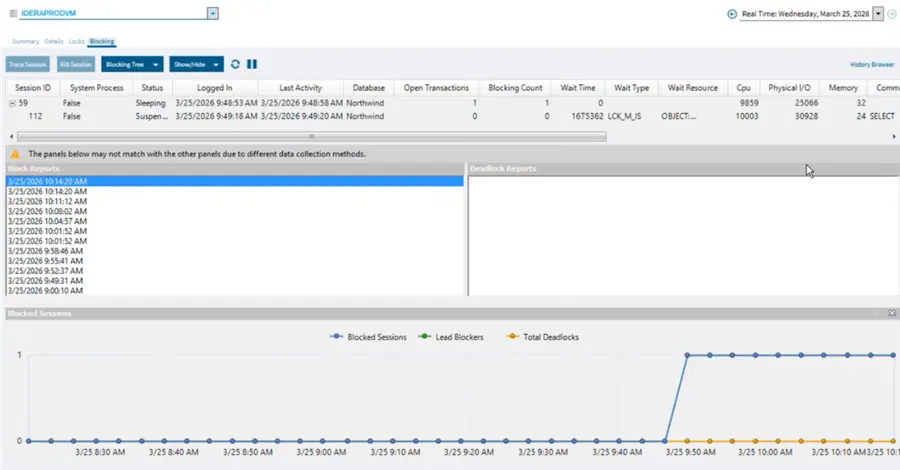
By drilling down into the blocked sessions, we can then see different time periods of when blocking occurred along with a graph of the number of blocked sessions for each time period.
Drill deeper and get additional info
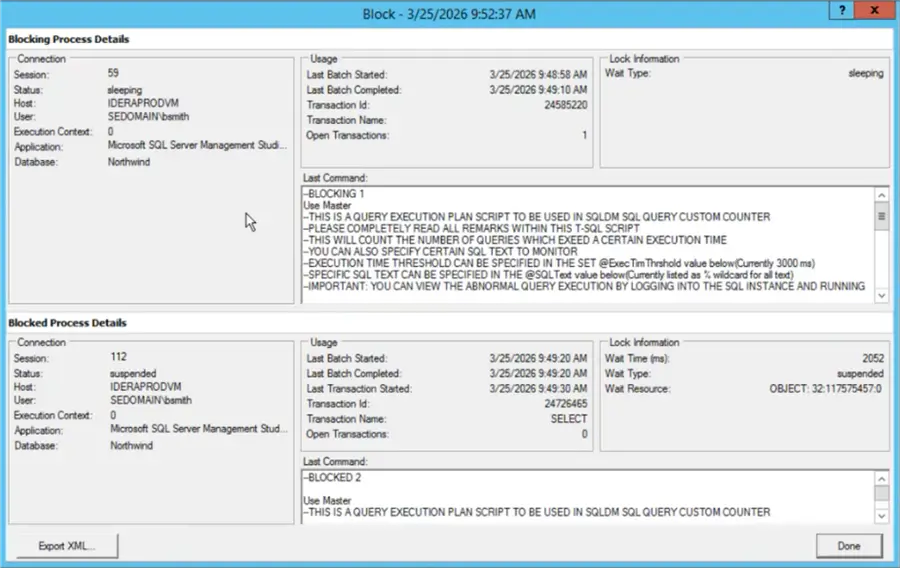
We can then drill even deeper to see the actual sessions that are being blocked, the blocking session or sessions, and SQL statements to determine how to resolve the blocking problem. Without constant data collection, it would be much harder to capture when a block occurred and the cause of blocking. This is just one example of how SQL Diagnostic Manager can be used with its drill through capabilities. By allowing a macro view of the environment, SQL Diagnostic Manager can quickly drill down and isolate the issue to begin fixing the problem.
History Browser
As we all know, you have to be pretty lucky to be looking at a SQL Server instance the exact time an issue occurs. This is where the SQL Diagnostic Manager history browser functionality comes into play.
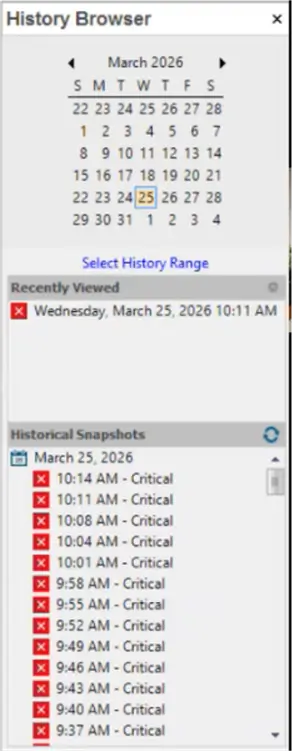
You may get a call that the system is slow but by the time you look, everything is running fine again. The history browser lets you go back to previous periods to see what was captured at that time so you can make informed decisions based on real data. Whether it was a few minutes ago or days earlier, the history browser let’s you see exactly what was happening for that period of time. To make it even easier, when you use the history browser you can see exact time periods that had critical issues as shown below. This way you are not searching for trouble spots, SQL Diagnostic Manager tells you.
Alert Actions and Responses
Proactive database management is key, but who has the time to consistently sit and watch one database instance let alone hundreds or thousands. With SQL Diagnostic Manager you have the ability to configure alerts and alert actions based on criteria you define. This could be a simple check such as running out of disk space or a more specific check such as an overload of transactions on a particular table for a specific instance and database. The alert identifies the problem based on the criteria you set and the alert response can be a simple email notification or actual corrective action by automatically running a script.
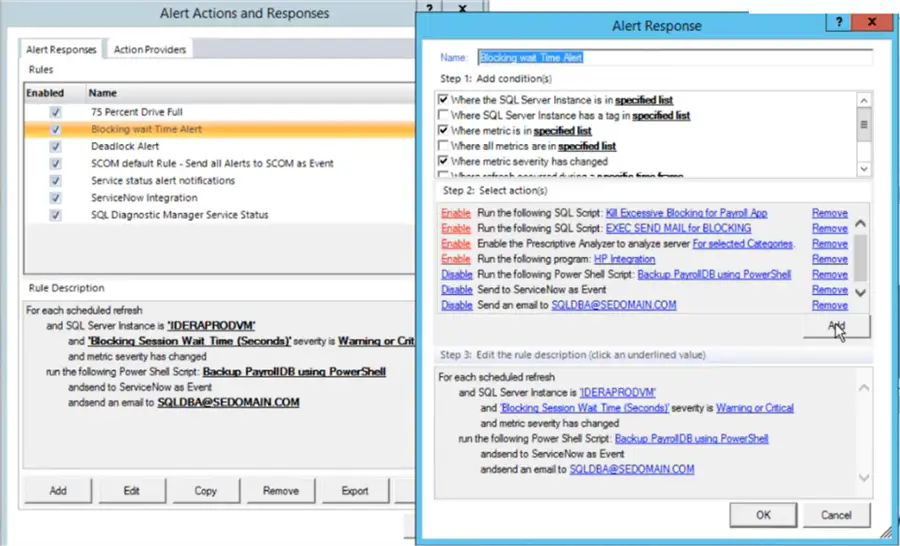
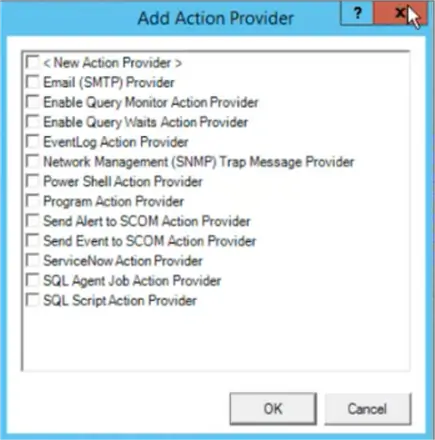
Built-in automated actions can respond to alerts and performance related events by sending e-mail notifications, executing SQL Server Agent jobs, running SQL scripts, triggering PowerShell scripts, and initiating many other remediation workflows, as shown below.
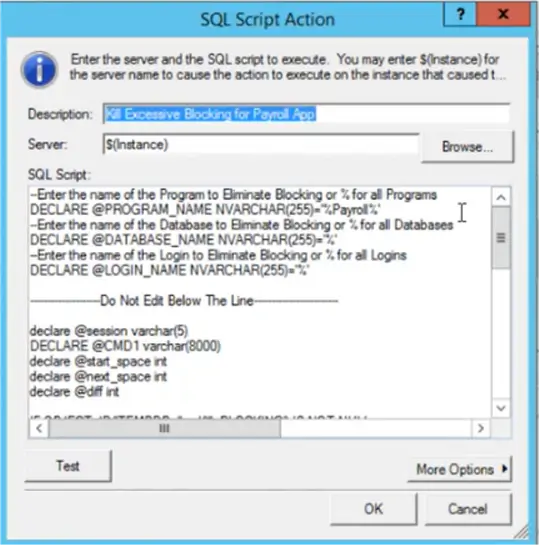
Here is an example of a SQL script that would fire to handle a specific situation. This way there is not a need for human interaction and this can be resolved automatically. This is especially helpful for things that occur on a regular basis. You know how to solve the problem and this is a way to automate the fix whenever it occurs.
Alert Configuration
Baselines and thresholds can be defined to trigger alerts for virtually any monitored condition at either the operating system or SQL Server level. When an alert is not provided out of the box, custom alerts can be created within Idera SQL Diagnostic Manager to address specific monitoring requirements.
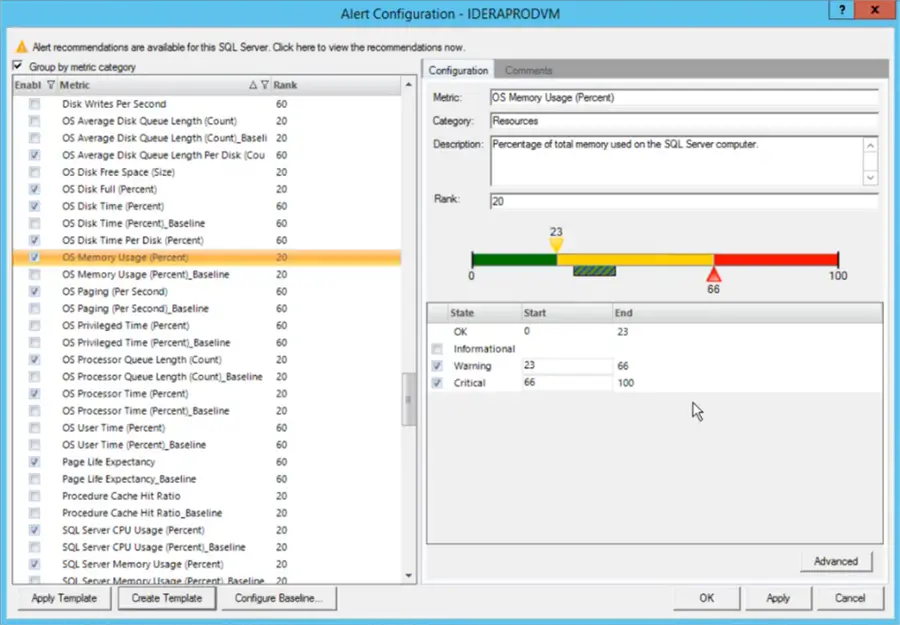
In the example below, a threshold setting is configurable to trigger alerts, actions, and notifications when OS memory utilization exceeds a configured percent of total memory. With fully configurable thresholds, monitoring can be tailored to the operational requirements of any environment or individual instance. Setting this value to 66% may not be a typical value for production, but setting thresholds at different levels can help with testing alerts and to find the value that makes sense for the environment.
Environment Analysis and Recommendations
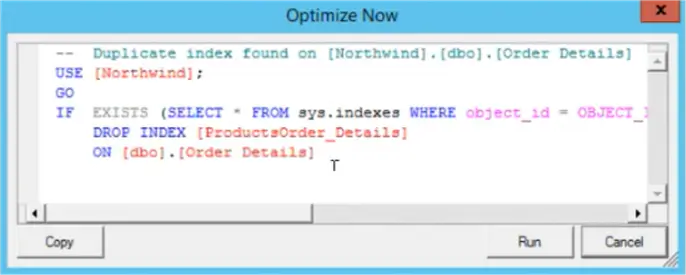
Another powerful feature of SQL Diagnostic Manager is ability to analyze and recommend fixes for any problem areas that are identified. These are issues that could impact performance or just general best practices. You are presented with a list of items and what SQL Diagnostic Manager thinks is the priority of that item for you to address. When you click on an item, SQL Diagnostic Manager provides detail information of why this is a problem and recommendations.
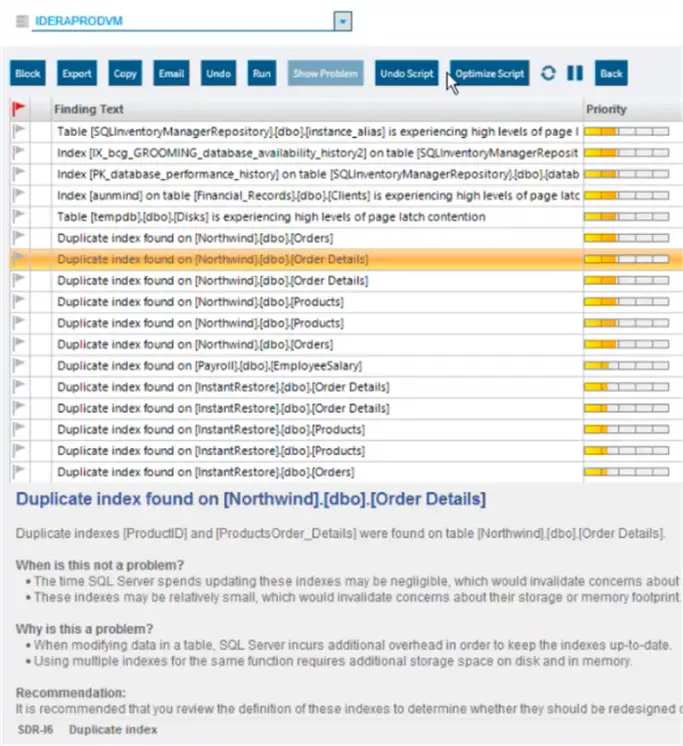
The Optimize Script button will generate SQL code to fix the problem. So, for example, we look at the issue of having a duplicate index, when clicking on the Optimize Script button SQL Diagnostic Manager creates the SQL code to drop the index for this particular issue.
Query Tuning and Recommendations
One of the biggest time consumers for DBAs and Developers is tuning SQL queries. A typical tuning session looks something like this:
- First, you need to find the queries that need attention
- Then you look at resource usage like CPU, reads, and writes
- Then you look at resource wait stats
- Then you look at execution plans
- Then you compare the current execution plan with previous plans
Once you have done the above, you can make informed decisions on how to tune a query. Well guess what, SQL Diagnostic Manager collects all the data you need and allows you to move through each of these items very easily.
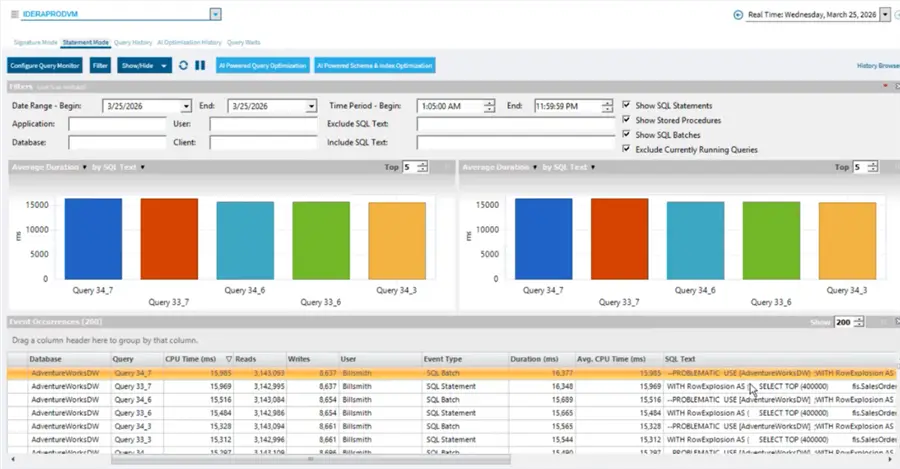
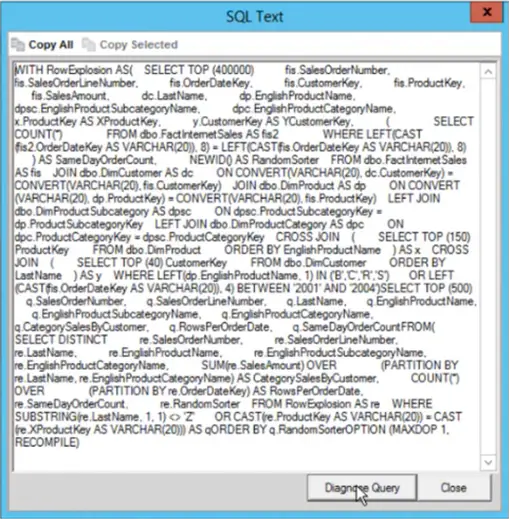
To take it a step further, once you find the query in question you can use SQL Diagnostic Manager to analyze and recommend fixes. Here is an example query. We can click on Diagnose Query to get recommendations.
Below is a list of recommendations to fix the query.
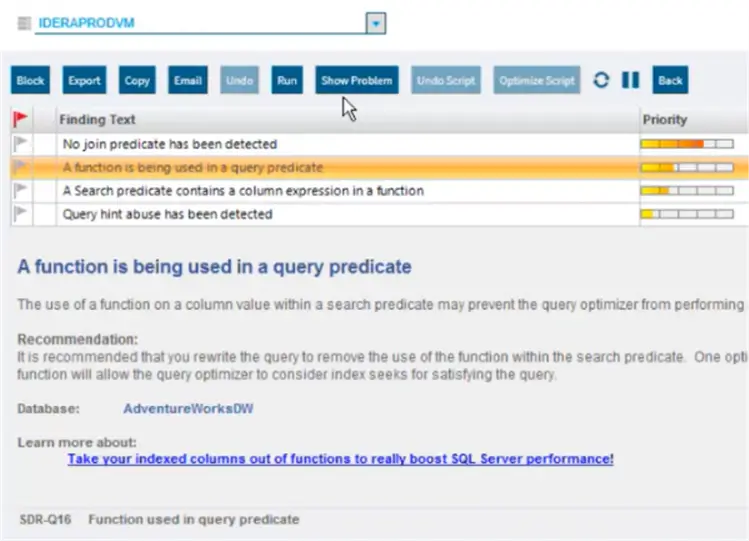
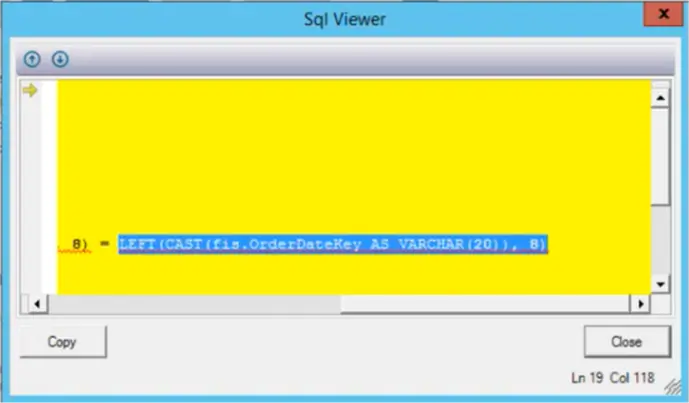
If we select one of the items and select Show Problem, it shows the specific issue in the query statement that needs to be addressed. No need to fumble through long queries to find the problem, SQL Diagnostic Manager points right to the specific section of the query.
New AI Tuning Features
As you already know, AI tools are just about everywhere and this is true for SQL Diagnostic Manager. In version 14 of SQL Diagnostic Manager, AI functionality has been introduced with much more to come.
As we discussed in the section above about how to improve queries, the new AI features take this a step further with even deeper analysis using OpenAI. Once you have identified the statement you want to improve, click on AI Powered Query Optimization.
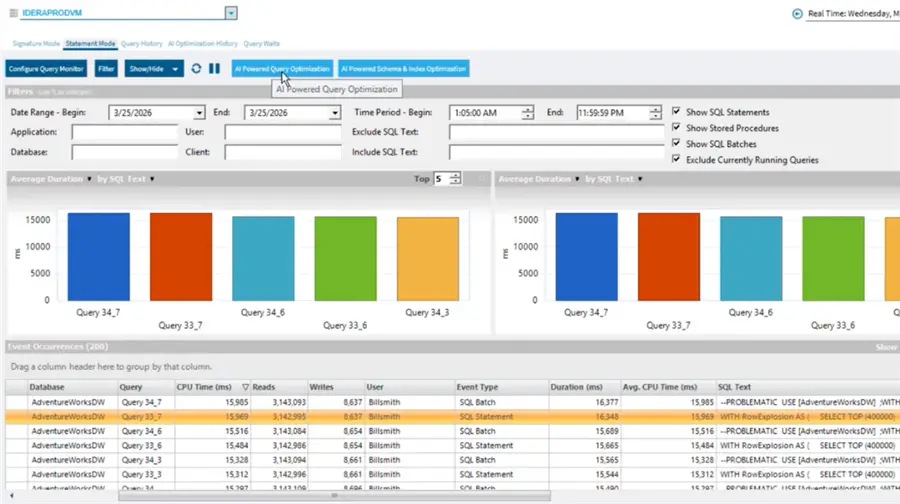
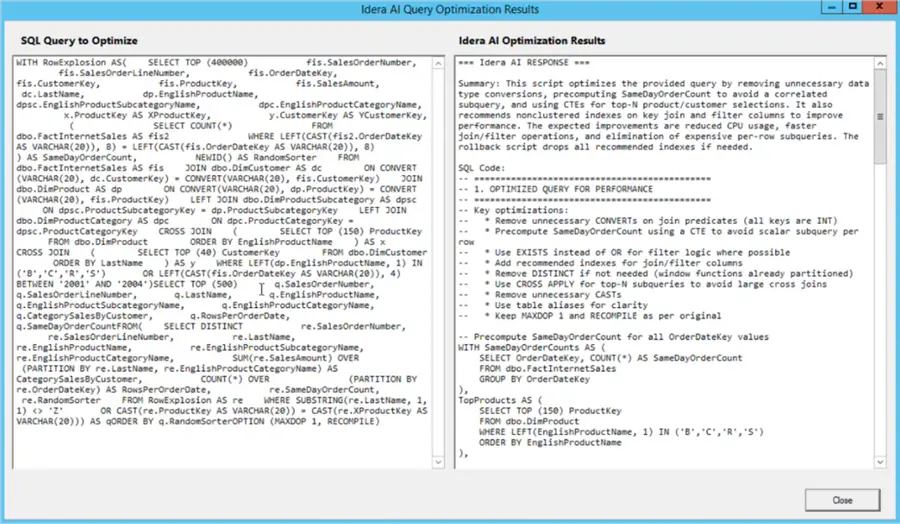
This will then show you the current query and the optimized version using AI functionality. The code is rewritten, as well as recommendations for new indexes are provided to improve the overall performance for the query. Analysis of your query and database are used to provide an optimized version of the query.
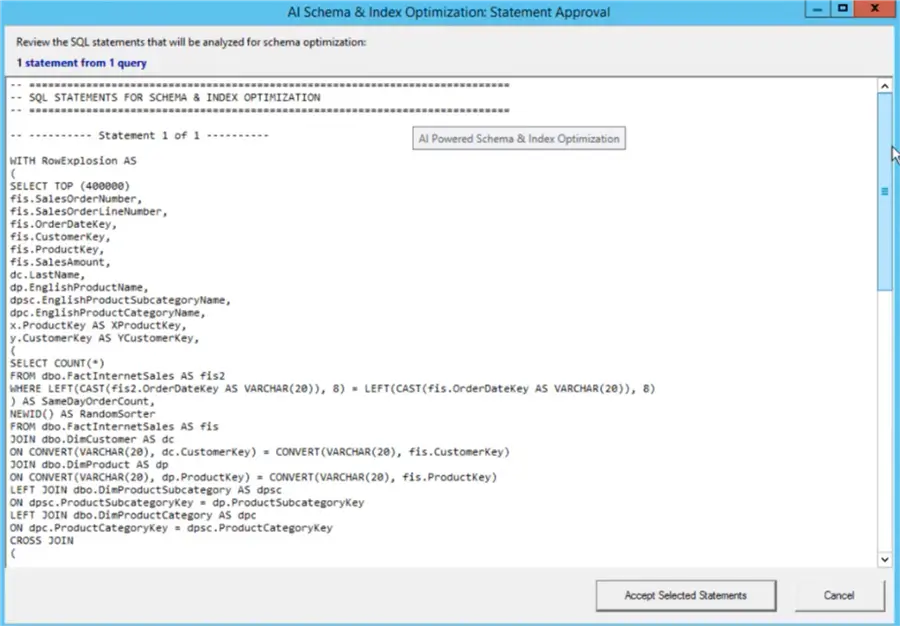
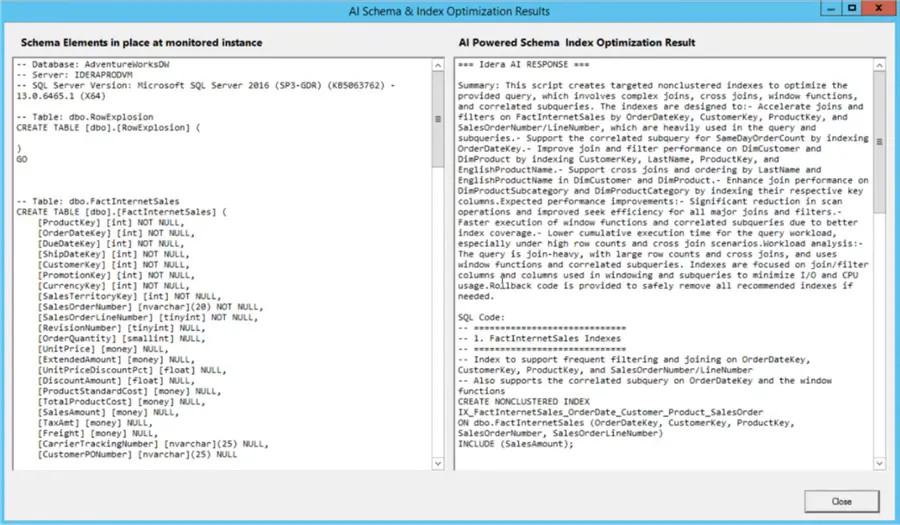
In addition to analyzing one statement at a time, using the AI Powered Schema and Index Optimization option allows you to analyze up to 5 statements at the same time. You can select the statements and click this option to get an optimized queries along with index recommendations to improve the overall performance.
Here is an example of the output that is generated along with notes about what was done, index recommendations, and query improvements.
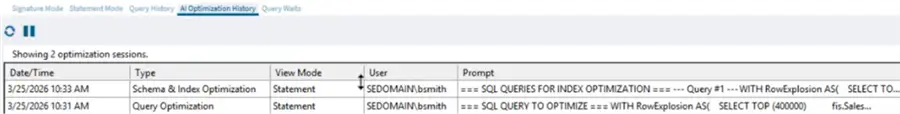
Recommendations are saved in the AI Optimization History section so you can always go back and review these at any time.
Installation is Super Easy
To cap it off, Idera has made the installation and configuration extremely simple. With agentless implementation of monitored SQL Servers, to a centralized repository for data collection, storage and analysis, the installation couldn’t be easier. This allows monitoring of servers to begin almost immediately and offloading troubleshooting from production servers.
Key Takeaways
- SQL Server monitoring can be complex and often lacks timely data capture for troubleshooting.
- SQL Diagnostic Manager provides a unified interface for managing, monitoring, and troubleshooting SQL Server environments.
- The tool features deep drill-down capabilities, allowing quick analysis of performance metrics and blocking issues.
- Automated alerts and actions streamline proactive database management, reducing the need for constant oversight.
- New AI tuning features enhance query optimization and performance analysis, making SQL Diagnostic Manager a powerful management tool.
Next Steps
There are so many other features in SQL Diagnostic Manager that you should check out for yourself. Idera offers a free trial, so you can fully test SQL Diagnostic Manager and get started today.
- Learn more about SQL Diagnostic Manager
- Access your free trial of SQL Diagnostic Manager now.

Greg Robidoux has been working with databases for 35+ years with extensive hands on SQL Server experience from version 6.5 to 2025. He has authored over 250 technical articles and delivered several presentations online and at various conventions. Greg is also the President and founder of Edgewood Solutions, a technology services company delivering services and solutions for Microsoft SQL Server.