Problem
How you develop your Power BI Desktop model has big consequences on the performance of the model. A badly designed model can take long to refresh, query execution times might be high and even the results of measures can be incorrect. In this tip, we’ll look at some best practices to help you get the most out of your models. We will also look the DAX formula language.
Solution
Power BI Desktop is a free tool from Microsoft, allowing you to create sophisticated data models which you can use to create compelling visualizations and interactive reports. Even though it’s a self-service business intelligence solution at heart, it doesn’t mean no thought should be put into the design of the model. A couple of best practices are provided in this tip. They are by no means an exhaustive list, but they can serve as a checklist for when you’re creating your own Power BI model.
The tip Power BI Desktop Source Data Considerations goes into more detail about the steps that come before you even open Power BI Desktop: the source data. For example: do you build a data warehouse? Do you use Analysis Services? It’s advised you also check out that tip to have a more complete picture. It also covers live connections (to SSAS) and DirectQuery.
Best Practice 1 – Power BI Desktop Update
There’s one golden rule: update your Power BI Desktop often. Power BI is updated with a monthly release cadence, which means there are new features and improvements each month! A feature you really needed to make something happen, might be released next month. Keep an eye on the official Power BI blog to check out each new release. If possible, you can also install the Power BI Desktop app in Windows 10, which will update itself automatically.
If you update manually, it’s always a good idea to keep a back-up the install file of the previous version. Sometimes a breaking change happens, or a bug might prevent you from doing something and it’s always good if you can roll back Power BI Desktop to a previous version. If you’re looking for an older version, this blog tries to keep track of all released versions.
Best Practice 2 – Import Data with Power BI Desktop
With the import option, you import the data from one or more sources into the data model. When you edit the queries, you end up in the Power Query editor, where you can apply transformations on a sample set of the data. Let’s take a look at some of the best practices.
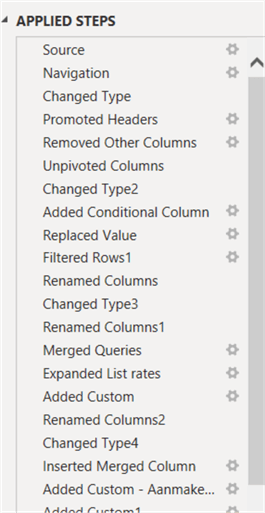
Rename Power BI Transformations
Each time you apply a transformation to a set of data, it’s given a default name, which is typically the name of the transformation + a number of how many times it has been used before. Please rename your transformation to something more understandable, like “Concatenate First and Last Name” or “Pivot over Employee”. It will make your life much easier (or the life of a colleague) when you have to update a transformation later on and you need to find it in a long list of transformations. Please don’t do this:
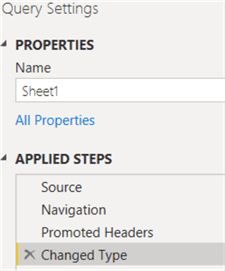
Change the name of the Power BI Query
While you’re at it, also change the name of your query if necessary. Query1 doesn’t specify which data is returned, but “Sales Orders” does, although it seems recent versions of Power BI Desktop does a great job of given good default names to queries. Except for Excel:
Power BI Query Folding
When importing data from a relational source, it’s important to push back as many query logic back to the source. This is called query folding. For example, a relational database like SQL Server is better suited to aggregate, filter or perform calculations on large sets of data than the Power Query engine. But not all possible transformations can be folded back to the source. If you use one of those transformations, for example adding an index column, all transformations after this particular transformation cannot fold anymore. This means it’s important to postpone this transformation to as late in the query as possible. You can check if a transformation folds by right-clicking it and see if “View Native Query” is enabled.
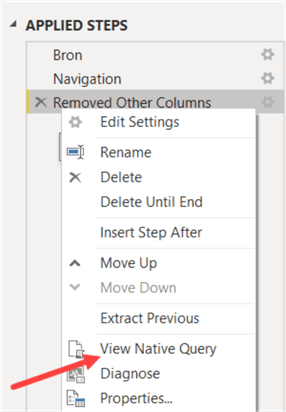
This option will show you the query as it will be sent to the source system. If it is greyed out, the transformation cannot be folded and thus it will have an impact on performance. You can find more information about query folding in the tip Query Folding in Power Query to Improve Performance.
Filter First, Calculations Later in Power BI
If for some reason the query cannot fold, such as when you are reading data from a non-relation source like a text file or Excel worksheet, it’s important to reduce the size of the data set if possible. For example, if you need to filter on a column, you better do it as one of the very first steps in the query. The same goes for removing columns. In short: filter first, calculations later.
Use Power BI Functions for Reuse
Like in any form of programming language: keep reusability in mind. If you see you have many queries with a common complex calculation: try to make a function out of it. Check out the documentation for more information: Understanding Power Query M functions.
Be Aware of the Impact on the Source
Each query will result in a table in the Power BI Model. If you need a table which is a derivative of another table, you can do this in Power Query, even before the data hits the model. Let’s illustrate with an example. If your source is a single large table – for example a flat file – you might want to split out the data and remove duplicates to get your dimension tables. Common calculations can be done first in a base query, which is then referenced by the final queries for the dimension tables. Suppose we have the following source table:

Create Fact Table and Three Dimension Tables
We would like to create one fact table with the amounts and three dimension tables: store, product and customer. Common transformations can be done in the base query, such as promoting the header and removing the footer.

Suppose we now want a separate table for our customer dimension. Instead of reading the Excel sheet in again and doing the same transformations, we can just reference this base query. When referencing a query, you create a new query where the first step is the output of the query you reference. You can do this by right-clicking a query and clicking on Reference.

We get the following result: a new query where the first step is the result of our base query.

Customer Dimension
Now we just need to remove all other columns than Customer and remove any duplicates, and we have the basis for our customer dimension:
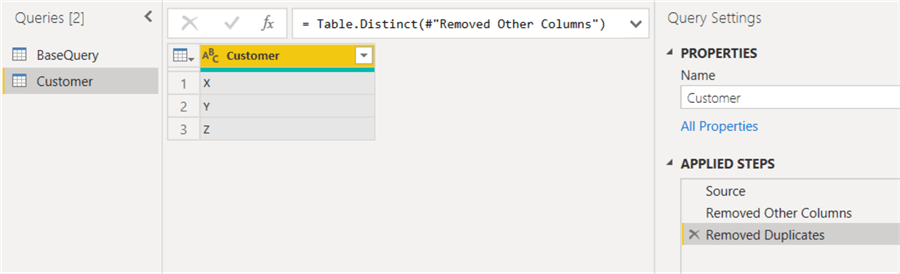
The same process can be repeated to create other dimension tables from our base query. There’s one big disadvantage of using this approach. You might expect that the base query reads the source data and that the other queries reuse this data from memory to create their own result. Unfortunately, this is not the case. Each query will read the Excel worksheet! If you have one base query and 3-dimension queries, the worksheet will be read 4 times. This might not seem like a big issue, but if you read from an API or a web service, its possible web requests are throttled and that the refresh of your dataset might take a very long time or even time-out. The concept is explained well in this blog post by Chris Webb: Why Does Power BI Query My Data Source More Than Once?.
Best Practice 3 – Power BI Data Model
Power BI Star Schema Recommendations
This best practice is simple: model your data using the dimensional modeling technique, also known as star schema modeling. This means transactional data in fact tables, descriptive data in dimensions and surrogate keys to link everything together. Typically this is done in a data warehouse – as explained in the tip Power BI Desktop Source Data Considerations – but if for some reason you import data directly into PBI Desktop, try to model it using star schemas.
The reason for this is twofold:
- Star schemas are easily understood by end users. The concept of facts and dimensions are easier to grasp than normalized tables (or even worse, data vault tables).
- The nature of star schemas align closely with how filtering is implemented in Power BI. Typically, in a report you filter on dimension values. These filters are then propagated to the much larger fact tables. Using star schemas will give you the best overall performance.
If you want an introduction to dimensional modeling, check out this part of the BI tutorial.
Power BI Star Schema vs Flat Table
This best practice seems unnecessary if you follow the advice of the previous one, but sometimes it’s tempting to just use one big table in PBI Desktop especially if that is your source, for example a big flat file. The engine can compress data really well, so storage-wise you probably won’t take a big hit unlike in a relational database such as SQL Server. The biggest risk is however that simple measures might give incorrect results. To fix these, you’d need to write more complex measures. Let’s illustrate with an example. Suppose we have the same sample data as before, but now with the age of the customer added:

Suppose we read all of the data directly into one big table (removing the footer of course):

Now we want to calculate the average of our customers. Let’s create a new measure with the following formula:

When we display this measure in a visualization, we get the following result:

Data Review
Hold on? 33.5 is not the correct answer. We have 3 customers, with ages 35, 24 and 40. This makes the average (35+24+40)/3 = 33. It doesn’t seem like a big difference because the sample set is small, but it can be much worse for larger data sets. The problem here is that we’re actually calculating a weighted average. Because the ages are included with the transactional data, the age of customer X is repeated twice. The more a customer buys, the more his/her age will appear in the data and the more it will skew the calculation of the average. If you want to calculate the correct average, you need to adapt the DAX formula:

This measure is already a lot more complex than our simple average measure. But it returns the correct results:

In a nutshell, the SUMMARIZE function returns the equivalent of a SQL GROUP BY expression on the columns Customer and Customer Age, basically eliminating any duplicates. With that result set, the AVERAGEX function will loop over the distinct customers and calculate the average of the age.
This complex DAX could have been avoided if we followed the best practice of creating star schemas. If we have a customer dimension with an age column, the measure becomes:

It’s back to the simple DAX measure, but this time it gives the correct result:

SSAS Tabular Best Practices
The data engine behind a PBI Desktop model is in essence a SSAS Tabular engine (with some features added or removed). This means most of the SSAS Tabular best practices are also valid for PBI Desktop. Here’s a short overview with a focus on keeping the model small and efficient.
Avoid Columns with High Cardinality
Avoid using columns with a high cardinality; in other words, columns with a high number of unique values. The more unique values a column has, the harder it is for the engine to compress it. Try to avoid free text columns, unless you absolutely need them in your reports.
For timestamps, first assess if you actually need the time portion. Maybe the end users only need the date. This would drastically reduce the uniqueness of the column. If you do need the time portion, split the timestamp into a date column and a time column. This reduces again the uniqueness and the engine will be able to compress the data much better.
For decimal numbers, do you really need 6 digits or more after the decimal point? Maybe 2 or 3 are just fine. Six digits behind the decimal point for a percentage is about one million unique values. Three digits are only 1,001 unique values.
Remove Unneeded Columns
If you don’t need a column, drop it. Don’t blindly pull in the entire source.
Consolidate Intermediate Columns
It’s fine to create multiple calculated columns as intermediate steps for a complex calculation during development. However, once the calculation is finished and tested, consolidate all those intermediate columns into one final column and drop the intermediate ones.
Calculated Column vs. Measure
If you can choose between a calculated column or a measure, go for the measure. Measures are more flexible, don’t take up processing time and don’t take up space in the model.
Surrogate Keys
In the Tabular engine, you can only create relationships on single columns. Rather than concatenating all your business key columns into one single business key (with high cardinality!), use surrogate keys instead. Again, this is why it’s a good idea to consider a data warehouse before you build your PBI Desktop model.
You can find an overview of SSAS Tabular best practices regarding model size in the following two tips:
- Reduce the Size of an Analysis Services Tabular Model – Part 1
- Reduce the Size of an Analysis Services Tabular Model – Part 2
Most of the advice in those two tips is valid for Power BI as well, except for some advanced techniques (such as encoding hints).
Power BI Performance Analyzer
There are tools you can use to optimize your model. One of the built-in tools is the performance analyzer, which gives you an overview of all the time spent on the various queries executed by your reports. An in-depth explanation of this tool can be found in the tip Power BI Performance Analyzer. An example taken from that tip:

Tabular Editor is an open-source tool which is an alternative for SSDT to create Tabular models. It’s much faster and has some advanced features such as scripting. The good news is you can also hook it up to a Power BI model!
For more debugging capabilities of your DAX queries, you can check out DAX Studio, which is also a free tool. You can connect it to a Power BI Desktop model as well and catch for example all the DAX queries generated by your reports. DAX Studio is also used in the DAX Tutorial.
To analyze storage usage in your model, you can use Vertipaq Analyzer. It will give you a nice breakdown of the usage of each column and will definitely help you reduce model size (see also the previous paragraph). This screenshot was taken with Vertipaq Analyzer on a Tabular model (as described in this tip):

Best Practice 4 – Power BI and DAX
When writing measures or calculated columns with DAX, there are some best practices we need to consider.
Calculations in Power BI vs DAX
Often you have different possibilities on where you can do a calculation. Do you do it in the data warehouse? In Power Query? In the model using DAX? The answer is simple: as early as possible. This means you do the calculation in your source, or maybe a view on top of this source. If this isn’t possible, you do it in Power Query. Calculations in the model (calculated columns) are your last resort. They have an impact on processing time and on the size of the model. Measures are an exception, because they are dynamic by nature and they are calculated on the fly.
Write Explicit Measures in DAX
In PBI Desktop, any column with numerical values can be used as a measure in a visualization, or it can be referenced in a measure. When you use such a column, it’s an implicit measure. When you write a DAX formula to create a measure, it’s an explicit measure. The best practice is to use explicit measures everywhere, even for simple measures like sum, min, max and average. The reason behind this is that if you use implicit measures in the formula of other measures and at some point the business logic changes – meaning you need to write a formula for this basic measure – you will need to update every single measure where this base measure was used. Explicit measures promote reusability and make it easier to refactor your code.
In your model, you can recognize implicit measures by the summation symbol (sigma), and explicit measures by the calculator icon.

Ideally, every numerical column which might lead to implicit measures is hidden (with the exception of a column containing years or months for example) and explicit measures are created on top of those columns.
DAX Measures and Columns Naming Convention
When referencing columns in a measure, the naming conventions it to use TableName[ColumnName], while for measures you use only the measure name. This convention makes it easy to distinguish between columns and measures in a DAX formula and avoids any confusion. Let’s take the formula for the following measure:
TestMeasure = OneBigTable[Average Age Correct] + SUM(OneBigTable[Customer Age])Just by looking at the formula, it’s not easy to tell which one of the two references is a column and which one is a measure. In PBI Desktop the color coding gives it away though:

A better way to write the formula is using the proposed naming standard:

Use DAX Variables if Possible
Using variables in DAX leads to better readable and understandable code. Sometimes it can also lead to a performance improvement because some parts of the formula need to be calculated only once. Let’s illustrate with a short example. The following DAX formula calculates the highest average age using the measures we created earlier. If the (incorrect) average is higher than the correct average calculation, the incorrect measure is returned. If it is lower, the correct average is returned.

The problem with this formula that for the Boolean condition, both measures are evaluated. Once the result is known, the chosen measure is again re-evaluated. This is a redundant calculation, but with variables we can avoid this. We can rewrite the formula with variables:
HighestAvgVariables =
VAR incorrect = [Average Age]
VAR correct = [Average Age Correct]
RETURN IF(incorrect > correct, incorrect, correct)
Both the measures are evaluated when they are assigned to their variable. In the RETURN clause, the variables are used, so there’s no re-evaluation. This is a powerful optimization technique, especially for complex measures on top of large tables.
Try to Avoid DAX Iterator Functions
Or in general: everything doing a row-by-row operation. Measures which use a row context are for example the aggregate functions ending on a X, such as AVERAGEX, SUMX, RANKX, MAXX and so on. Another function is the FILTER function. It seems tempting to use FILTER every time you would need to filter data. Suppose we want to calculate the average age for customer X. You could write the following formula, using the average age measure of the customer dimension:

After all, you are calculating the average age while filtering the customer table for customer X. However, because it is an iterator it can cause performance issues. A better way to write to formula is leaving out filter and directly filtering on customer X:

It does have the side-effect of always calculating the age of customer X, even if a different customer is selected:

This can be a bit confusing. This effect is caused because we overwrite the filter context in CALCULATE and replace it with the filter on customer X. A better way to write the formula is using KEEPFILTERS, which gives the same result for customer X, but it keeps the filter context on customer so it doesn’t return a result for the other customers, which is typically what you want in this use case.

Next Steps
- Be sure to check out the tip Power BI Desktop Source Data Considerations, where some best practices regarding the source data are discussed.
- It’s impossible to list every DAX best practice in one single tip. If you want more, check out this video by DAX guru Marco Russo: DAX Best Practices.
- You can find more examples on variables in this article. Also don’t forget to check out the DAX Tutorial.
- You can find more Power BI tips in this overview.

Koen Verbeeck is a seasoned business intelligence consultant with over a decade of experience with the Microsoft Data Platform. He holds several certifications, including Azure Data Engineer. He’s a prolific writer, with over 375 articles on technologies such as Microsoft Fabric, SSIS, ADF, SSAS, SSRS, MDS, Power BI, Snowflake and Azure services. He has spoken at various events such as PASS, SQLBits, dataMinds Connect and many others. He frequently delivers educational webinars on MSSQLTips.com. For his efforts, Koen has been awarded the Microsoft MVP data platform award for many years.
- MSSQLTips Awards:
- Leadership Award (200+ Tips) – 2021
- Author of the Year – 2014/2020/2022
- Author Contender – 2024/2025


