Problem
In part 1 of this tip we set-up a large SQL Server Analysis Services (SSAS) Tabular model for testing and we showed how we can find the size for all of the columns in the model using the Vertipaq Analyzer. In this part, we’ll show different techniques on how to shrink the size of particular columns for SSAS Tabluar models.
Solution
Reducing the Size of the Columns for SSAS Tabular Models
In this part we’re going to dive into some techniques to help you reduce the size of your SSAS Tabular model. There are some general tips as well which don’t need much explanation:
- If you don’t need a column, don’t include it in the model. Reducing the number of columns is the easiest way to making your model smaller. If columns are hidden and not used in calculations or relationships, they are easy candidates for being removed. If you have a complex calculation and you split it out in multiple calculated columns for debugging, make sure to consolidate everything in the end and remove all those intermediary columns.
- If you need a calculation and you can choose between a calculated column or a measure, go with the measure. Measures are more flexible and don’t take up space in the model. In the following screenshot you can see the sum of the answer count and the comment count for each post type, once as a measure and once as a calculated column. As you can see, the result is the same but the measure doesn’t take up any space in memory.

Reducing Datetime Columns
Let’s start with the big datetime columns of the Posts table: the creation date and the last activity date. There are two options:
- In most business intelligence scenarios, the time portion is not relevant, so you can cast the datetime to a date. This will drastically reduce the number of distinct values (for 4 years of data there are about 1,460 days, not counting leap days). Let’s suppose we don’t need the exact time for the last activity; the date alone is sufficient.
- If the time is important, you can split the datetime column into a date column and a time column. For example, if we want to analyze when people typically create posts at StackOverflow it’s useful to still have the time portion available. There’s no time data type in Tabular, so we need to convert the datetime to the time data type in SQL Server and then back to a datetime. As an example, 2017-11-06 10:49:03 will become 1900-01-01 10:49:03. Since the day portion is the same for all values in the column, the cardinality will be reduced to a maximum of 86,400 which is the number of seconds in a day. When converting to a date, all datetime values will get a fixed time portion of 12AM.
Our T-SQL statement becomes:
 SELECT TOP 15000000 -- 15M rows
    [Id]
   ,[AcceptedAnswerId]
   ,[AnswerCount]
   ,[ClosedDate]
   ,[CommentCount]
   ,[CommunityOwnedDate]
   ,[CreationDate]   = CONVERT(DATE,[CreationDate])
   ,[CreationTime]   = CONVERT(DATETIME2(0),CONVERT(TIME,[CreationDate]))
   ,[FavoriteCount]
   ,[LastActivityDate]= CONVERT(DATE,[LastActivityDate])
   ,[LastEditDate]
   ,[LastEditorDisplayName]
   ,[LastEditorUserId]
   ,[OwnerUserId]
   ,[ParentId]
   ,[PostTypeId]
   ,[Score]
   ,[Tags]
   ,[Title]
   ,[ViewCount]
   ,RandomPercentage = RAND(Id) * 100
   ,WeirdBusinessKey = CONCAT(Id,CONVERT(DATE,CreationDate,112),OwnerUserId)
FROM [StackOverflow].[dbo].[Posts];
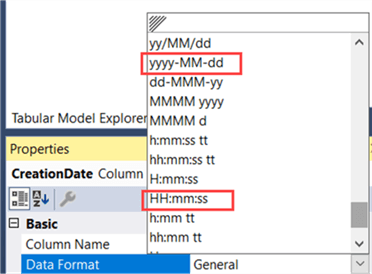
In the Tabular model, we can modify the format properties to display the columns as either date or time.
When we change the source query in the Tabular model, deploy everything to the server, process the model and analyze it again with the Vertipaq Analyzer, we get the following results:

Even though we introduced an extra column, the size has been reduced significantly. The date columns only take up a tiny percentage of the overall model size, while the time column is responsible for a mere 1.15%. The total model size shrunk to a bit less than 4GB, which is a reduction of almost 12%.
Note: the reason why the effect hasn’t been bigger is because the dictionary size of the WeirdBusinessKey column has almost tripled. It’s hard to tell why the compression of this column became so ineffective. Its possible reprocessing might solve this issue or the issue doesn’t occur at all on another machine.
Changing the Precision of Numeric Columns
Numerical values with a large number of digits after the decimal point suffer the same fate as datetime values: high cardinality because every number is most likely unique. In our example, the RandomPercentage column has the float data type, which has a default precision of 15 digits. In most scenarios - unless you are doing actual rocket science - you don’t need that many digits. You can ask the report users if they are for example fine with 2 or 4 digits. Let’s convert the float column to a numeric(5,2) column (3 digits before the decimal point, as it’s a percentage and the maximum value is 100 and two digits after the decimal point).
 SELECT TOP 15000000 -- 15M rows
    [Id]
   ,[AcceptedAnswerId]
   ,[AnswerCount]
   ,[ClosedDate]
   ,[CommentCount]
   ,[CommunityOwnedDate]
   ,[CreationDate]   = CONVERT(DATE,[CreationDate])
   ,[CreationTime]   = CONVERT(DATETIME2(0),CONVERT(TIME,[CreationDate]))
   ,[FavoriteCount]
   ,[LastActivityDate]= CONVERT(DATE,[LastActivityDate])
   ,[LastEditDate]
   ,[LastEditorDisplayName]
   ,[LastEditorUserId]
   ,[OwnerUserId]
   ,[ParentId]
   ,[PostTypeId]
   ,[Score]
   ,[Tags]
   ,[Title]
   ,[ViewCount]
   ,RandomPercentage = CONVERT(NUMERIC(5,2),RAND(Id) * 100)
   ,WeirdBusinessKey = CONCAT(Id,CONVERT(DATE,CreationDate,112),OwnerUserId)
FROM [StackOverflow].[dbo].[Posts];
When we make this change to the source query, deploy and process the model, we get the following results from the Vertipaq Analyzer:

The total model size is now about 3.15GB or an improvement of almost 21%.
Replacing Concatenated String Values
The worst column in our StackOverflow model is the WeirdBusinessKey column. This string column is the result of concatenating other columns together. Typically this column itself isn’t used in the reporting, but rather as some sort of helper column for calculations (distinct counts for example) or for forcing a multi-column relationship. In the last case, you should try to model the data as a star schema (with facts and dimensions). In a star schema, you use surrogate keys as foreign keys between the tables and thus you don’t need a concatenated column for creating a relationship; this logic is handled in the ETL.
However, if you need the concatenated column just to do distinct counts, you can replace it with an integer column. We can do this with the RANK window function. This gives us the following query:
 SELECT TOP 15000000 -- 15M rows
    [Id]
   ,[AcceptedAnswerId]
   ,[AnswerCount]
   ,[ClosedDate]
   ,[CommentCount]
   ,[CommunityOwnedDate]
   ,[CreationDate]   = CONVERT(DATE,[CreationDate])
   ,[CreationTime]   = CONVERT(DATETIME2(0),CONVERT(TIME,[CreationDate]))
   ,[FavoriteCount]
   ,[LastActivityDate]= CONVERT(DATE,[LastActivityDate])
   ,[LastEditDate]
   ,[LastEditorDisplayName]
   ,[LastEditorUserId]
   ,[OwnerUserId]
   ,[ParentId]
   ,[PostTypeId]
   ,[Score]
   ,[Tags]
   ,[Title]
   ,[ViewCount]
   ,RandomPercentage= CONVERT(NUMERIC(5,2),RAND(Id) * 100)
   --,WeirdBusinessKey= CONCAT(Id,CONVERT(DATE,CreationDate,112),OwnerUserId)
   ,WeirdBK_Int   = RANK() OVER (ORDER BY Id,CONVERT(DATE,CreationDate,112),OwnerUserId)
FROM [StackOverflow].[dbo].[Posts];
Keep in mind that such using windowing functions over a very large data set might impact processing performance as the query becomes slower.
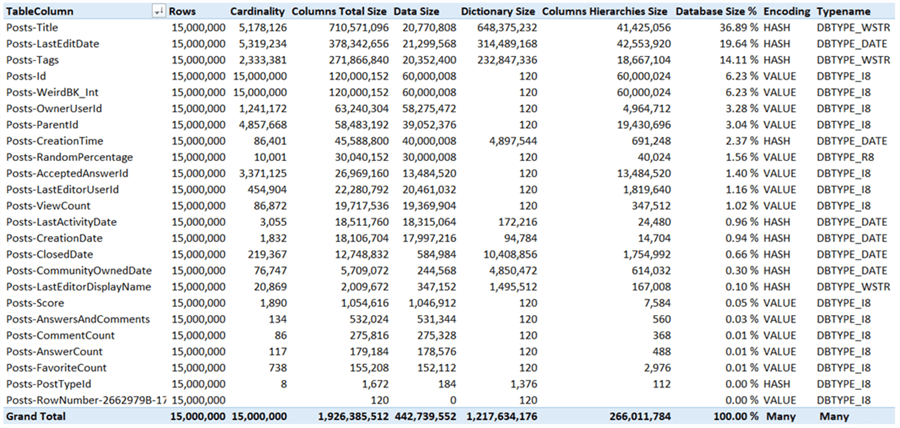
After deploying and processing, the columns have the following sizes:

The total size is now just short of 2GB. This makes an extra saving of 39% over the previous model size.
Not all string columns can be replaced however. The Title column for example is now the biggest column with high cardinality, but there’s no option to reduce this column in size, except by completely removing it.
Using Value Encoding to Shrink Columns
The final option we have is to specify a value encoding hint for some of the integer columns. If value encoding is used, the dictionary is much smaller. You can find more information in the tip Improve Analysis Services Tabular 2017 Processing with Encoding Hints. The following columns have the EncodingHints property set to Value: Score, AnswersAndComments (a calculated column), CommentCount, AnswerCount and FavoriteCount.
This gives the following results:
We saved about 60MB, which is peanuts compared with the total size, but it does show the concept.
Conclusion
In this tip, we showed a couple of methods to reduce the size of a SSAS Tabular model in memory. We started with a total size of 4.5GB and ended up with 1.9GB, a reduction of 57%.
Next Steps
- If you haven’t already, read part 1 of this tip.
- If you want to try it out yourself, you can download the solution here. The compressed archive contains the Tabular solution with all the modifications made in this tip, the source queries to fetch the data from the StackOverflow database and the Excel workbook with the Vertipaq Analyzer results. If you want to start from scratch, you can use the source query ImportQuery_Before.sql and the steps outlined in part 1 to create a new Tabular model. Keep in mind this model can consume quite some memory. Furthermore, the query with the RANK window function can run for quite some time.
- You can find more Analysis Services tips in this overview.

Koen Verbeeck is a seasoned business intelligence consultant with over a decade of experience with the Microsoft Data Platform. He holds several certifications, including Azure Data Engineer. He’s a prolific writer, with over 375 articles on technologies such as Microsoft Fabric, SSIS, ADF, SSAS, SSRS, MDS, Power BI, Snowflake and Azure services. He has spoken at various events such as PASS, SQLBits, dataMinds Connect and many others. He frequently delivers educational webinars on MSSQLTips.com. For his efforts, Koen has been awarded the Microsoft MVP data platform award for many years.
- MSSQLTips Awards:
- Leadership Award (200+ Tips) – 2021
- Author of the Year – 2014/2020/2022
- Author Contender – 2024/2025