Problem
What are the topics I know now that wish I would have known when I started working with SQL Server Analysis Services, aka SSAS?
Solution
SQL Server Analysis Services (SSAS) has roots back almost two decades. OLAP related services were released with SQL Server 7, and then SSAS was officially included with SQL Server 2000 including MDX support. SQL Server 2005 and 2008 brought a large number of enhancements to SSAS. Additionally, the multidimensional and more so the tabular infrastructure has become the basis for Power Query and of course Power BI. I sometimes wonder if Power BI will eventually replace SSAS, but not anytime soon. Of course, lots of organizations still utilize SSAS OLAP cubes, and actually use them as the basis for Power BI Dashboards, generally in direct query mode.
Certainly, though there are several items I wish I knew when I started working with SSAS which I will outline below.
1. Learn MDX
When dealing with any sort of custom measures or custom columns in SSAS, MDX very quickly surfaces as the method to generate any complex values.
MDX allows for the creation of measures such Period to Date, Year to Date, or Parallel Period. It also gives you the ability to write queries directly against an MDX cube; these queries allow you to “flatten” the data set and simulate a SQL type of data set. MDX, though focused solely on OLAP cubes, shows quite a few similarities to DAX. Although not exactly like MDX, you will see many DAX functions act in a way that matches with MDX, including the syntax of the function. Just like it is easier to learn a third language after you learn a second language (think Python and R), learning DAX and to a lesser extent M, has been much easier because I learned and know MDX.
For instance, to create a Period to Date calculation in MDX, we use a format of measure name and then date criteria.
WITH

  SET [MonthList] AS
    YTD([Date].[Calendar].[Month].[July 2013])
SELECT
  {[Measures].[Internet Sales Amount]} ON ROWS
 ,[MonthList] ON COLUMNS
FROM [Adventure Works];
Running this query against the AdventureWorks cube results in the below results.

To create a similar period to data calculation in Power BI and DAX, we use a somewhat similar syntax.
MTD = TOTALMTD(
      SUM('Production WorkOrderRouting'[Actual Cost]),
      Dim_Dates[Date]
   )
This formula results in the below MTD rollup values. You can see that the basic syntax of measure then date context in the arguments of both the MDX and DAX are very similar. Furthermore, you have to think about the date and its related values in the same context of its placement on the date hierarchy to achieve the desired rollup or rolling value in both DAX and MDX.

2. Excel is your Friend
OLAP cubes are generally based on financial data, and despite many other reporting tools and access methods, Excel is still the number one client to access a cube. As we all know, financial types say Excel is their very, very best friend, at least for most analysis and reporting. As such, just about anyone working in accounting, finance, management, sales, or marketing departments are going to ask for data in Excel and specifically pivot tables when connecting to an OLAP cube.
However, dealing with pivot tables connected to SSAS requires several ways to optimize your SSAS cubes for end users. For instance, regular pivot tables allow you to drop a value onto the pivot table multiple times. In many versions of Excel, a SSAS based pivot table does not allow a measure to be used twice. Additionally, using Excel pivot tables creates some very “gnarly” MDX queries against your cube (gnarly is a very technical term). Specifically, the MDX queries in some cases are not as efficient as they could be which in turn caused performance issues. These issues were compounded in situations where users attempted to group various dimensional values within a pivot table. Generally, the more items that you build within the SSAS OLAP cube dimensions (as opposed to adding grouping and calculations in Excel), generally the better the performance for end users.
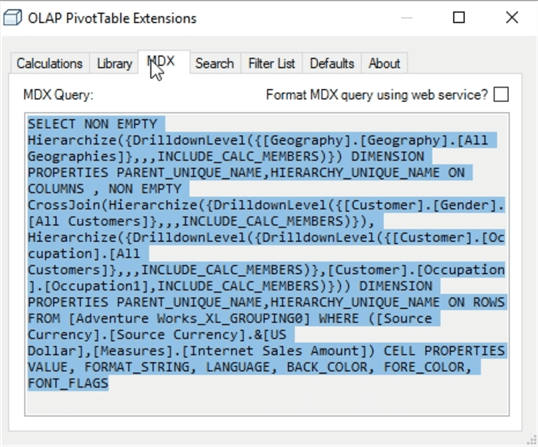
As shown in the above example, using the OLAP Pivot Table Extensions Tool, the MDX query generated for two simple dimensional values, gender and occupation, creates a CrossJoin MDX query. As the complexity of the data requested increases along with the number of groups, “temporary” Grouping cubes are created which can slow performance even on the simple groups. In these cases it is best to create the groups within your dimension.
3. Partitions = Processing Performance
SSAS OLAP cubes, built on the multi-dimensional models, require a data model to be created, and once created, the data must be loaded into the cube. Not only must the data be loaded, but it also must be refreshed as the data changes in the original data source. When the data is refreshed, generally the SSAS Cube becomes “unprocessed” which in turn means the end users do not have the ability to refresh their pivot table. That means a processing schedule and downtime must be established. Of course, most end users ask for the most uptime possible. One of the best methods to achieve maximum uptime is through the use of partitions.
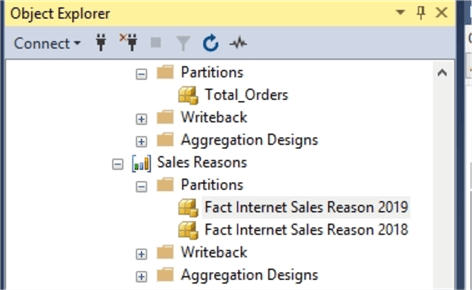
As shown below, we created a partition for the Fact Internet Sales measure group. Now, when processing the cube with new data, only the 2019 cube needs to be processed as new data is loaded.
Partitions allow for data to be broken done into smaller parts, most often by dates. Then the individual partitions, which has data that has changed, can be processed while those partitions that have not changed can be left alone which in turn leads to higher uptime. Of course, smaller partitions, means faster processing times which in turn means smaller downtime windows.
4. Model Efficiency
SSAS cube development is a very mature process; two individuals, Inmon and Kimball, created two different theories on the best options for creating a cube. These theories are not specific to SSAS, but they do provide an exceptional baseline for creating a new OLAP data model. I am preferential to the Kimball model and its focus on dimensional modeling. Dimensional modeling means the model should focus on a star schema with fact tables and dimension tables, and it should use primary keys / surrogate keys to link data from dimension tables to fact tables. It also means using fact tables with the smallest / skinniest width; that means for instance using integers and not character fields or using the smallest character fields possible.
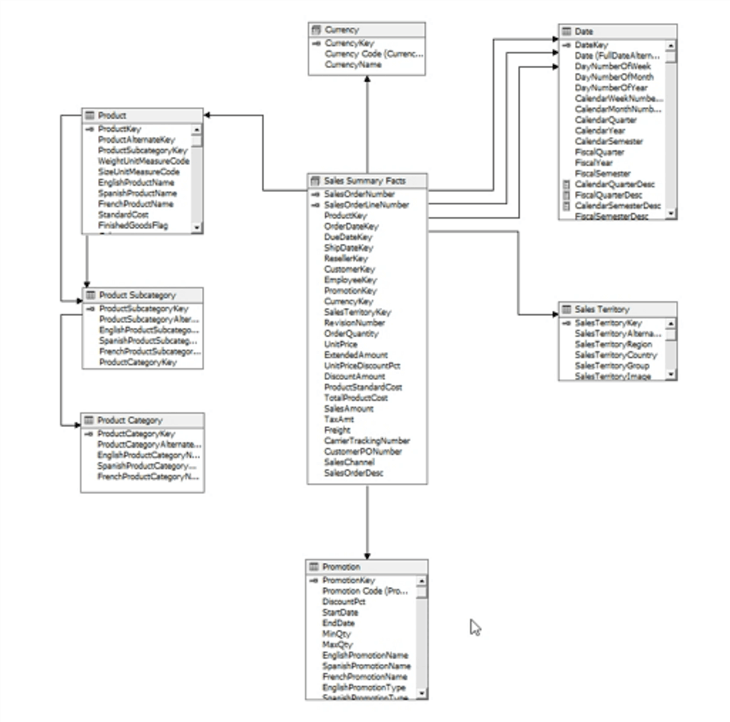
Using the AdventureWorks cube, the below illustration shows an example of star schema with the main Sales Summary Fact table surrounded by dimensional tables centering on currency, dates, product (and product category), sales territory, and promotions.
5. Mind your Dates
Dates continue to be a vital part of just about most any data set. As such, it is extremely important to plan for and manage the dates within the data model. The dataset may have a fiscal calendar and normal calendar year calendar. Alternately, a 4-4-5 calendar may be needed. All these setups are possible in SSAS cube, and it would be beneficial to setup during the modeling stage.
To control the exact dates, it is often helpful to create your own Date Dimension which can be customized with the exact needs within your organization. As displayed below, this example calendar dimension from AdventureWorks utilizes regular and fiscal calendars along with translations for day of the week. Additional items that can be added are company holidays, weekend / weekday flags, even special event flags such as a hurricane or maybe a flu outbreak.

Additionally, it is beneficial to create all the various variations of date dimensions that are needed. Do you need day of week or week number? Or maybe, does your organization have a specific set of busy days. As a best practice, setting up these items within your date dimension proves to be performant and clearer for your end users to understand.
6. Data Dictionary Self Service
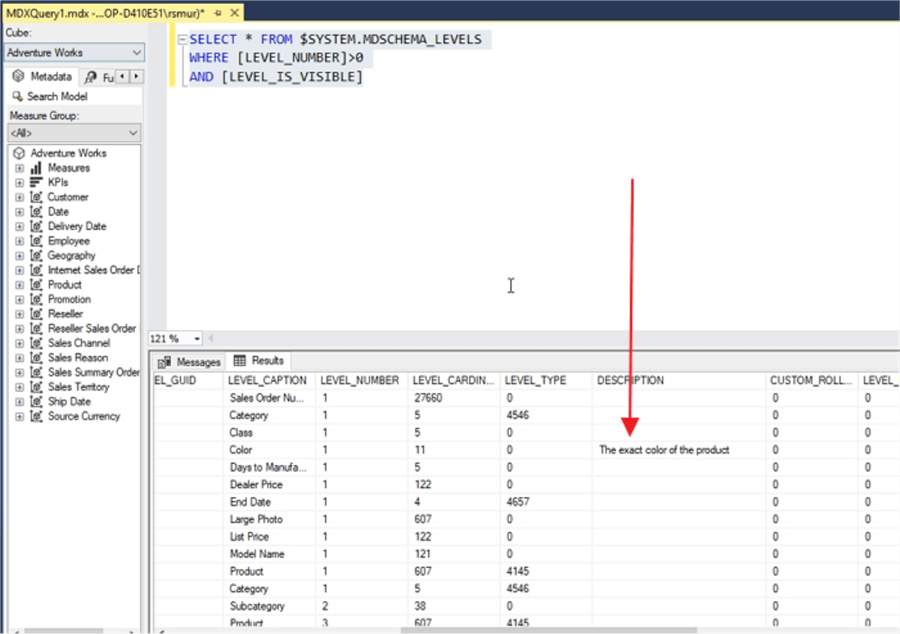
End users often want to explore data and love how easy it is to do such exploration via the use of a pivot table. However, often these same end users will have questions about what makes up a particular field, measure, or dimension. Within SSAS, each dimension attribute and measure provides the ability to add a description. In the below illustration, a description is added to the Color attribute within the Product dimension.

Although this description is not exposed directly within a pivot table, a data dictionary can easily be created using these descriptions and the SSAS DMVs as displayed below.
By keeping the descriptions within SSAS, you are able to keep the maintenance within SSAS. Furthermore, as you make changes to dimensions and measures, the descriptions can be changed and updated at the same time.
Conclusion
In this tip we covered some of the various SSAS tips that I wish I knew when I started working with SSAS. SSAS provides an exceptional way to aggregate various data points especially for very large data sets. It offers the ability to link up a pivot table to the SSAS OLAP cube and produce a flexible end user experience within Excel.
Next Steps
- All MSSQLTips.com SSAS Development Tips
- SSAS Data Dictionary
- SSAS Partition Tips

I have a passion for crafting Business Intelligence Solutions for my user groups. My experience includes almost 15 years of SQL Server involvement with the last 12 years focused specifically on Business Intelligence, SharePoint, OLAP, SSRS, and Decision Support solutions. Currently, I am a Business Intelligence Architect in the healthcare industry, and I also teach database and analytics classes for Kennesaw State University, Southern New Hampshire University, and Reinhardt University. My education includes an MBA and an undergraduate in Accounting (yes I am a reformed accountant!), both from Kennesaw State University. I enjoy every day by trying to grow my faith and spend precious time with my family. I have been happily married to my wife of over 20 years, and we have two teenagers one who we home school with the help of a University Model School, Cornerstone Prep in Acworth, GA (cornerstoneprep.org). Our other child is a Construction Management major at KSU’s Southern Poly / Marietta campus. We are a soccer and Cross Country (XC) family who play, coach, and referee soccer or run for fun most every day. For several years, our family has volunteered (and played with the dogs and cats) at Etowah Valley Humane Society in Cartersville, GA.
- MSSQLTips Awards: Champion (100+tips) – 2016 | Author of the Year – 2015 | Author Contender – 2014, 2016-2021