Problem
As per Wikipedia, a data warehouse can be defined as comprehensive technology that provides key people within an enterprise access to any level of the required information within the enterprise. It is an enterprise-wide framework that permits the management of all enterprise information. As per the definition, a data warehouse provides information for key people in the organization who are not technology savvy. Also, it should be a framework where you can build your own reports with less technical work. When this is combined together, this means the data warehouse should provide a framework for people in the organization to analyze all information in the organization.
A Key Performance Indicator aka KPI is a value which will determine how well an organization is achieving its objectives. Organizations use KPIs at multiple levels to estimate their success at reaching objectives. Therefore, KPIs are a handy option in the data warehouse which can be used by people who make strategic decisions, because a KPI can be used across various dimensions and hierarchies.
Solution
A KPI has four important properties which are value, goal, status and trend. Let’s explain this by means of Profit Margin with the below calculation.
- Value: is the actual value of the KPI. This will be a numeric value. For example, this can be the Profit Margin. This might not be included in the fact table hence we may have to calculate or derive this column.
- Goal: every organization has a goal for this value. For example, the organization may look at the goal of achieving a five percent Profit Margin. Also, sometimes they may have different values for different business areas. For example, depending on the product category or sales territory, the sales margin goal will differ.
- Status: depending on the KPI value and the KPI goal, the KPI status can be defined. For an example, we can say that if the KPI value is greater than the goal it is great if it is not greater than the goal, but still greater than zero it is good and if less than zero or running at a loss it is bad. This Great, Good or Bad can be displayed to the user by means of a graphical representation such as an arrow, traffic lights or a gauge.
- Trend: trend is an optional parameter when defining a KPI, but still an important feature in a KPI. For example, you may have a great profit margin, but comparing with last year, it could be less. On the other hand, you might have a bad profit margin, but compared to last year it is improving.
Logic for the above is implemented via Multi-Dimensional queries or MDX queries.
Setting up SQL Server Analysis Services Cube
Let’s quickly implement a SQL Server Analysis Services (SSAS) cube for demonstration purposes. Please note that detail descriptions for building a SSAS cube will not be covered here it is not the scope of this article. Please reference this tutorial.
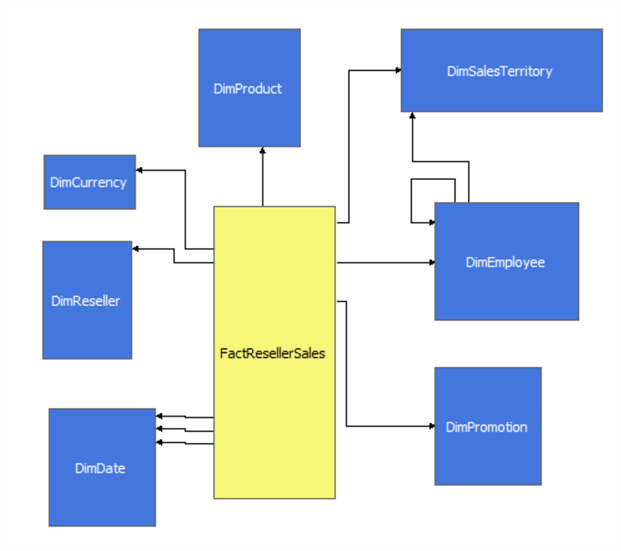
In this example, we are using the AdventureWorksDW database and the SSAS cube was built using FactResellerSales. We have a star schema with DimCurrency, DimProduct, DimSalesTerrotory, DimEmployee, DimPromotion, DimDate and DimReseller as the dimensions.
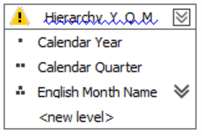
All the standard attributes were added including hierarchies for the date dimension as shown below.
The next step is to add a calculated value called Profit Margin to the cube from the calculation menu option in the cube as shown below.

In this configuration, the expression is written and visible is set to True. If you are creating calculated columns only for a KPI, you can set this to False. By doing so, end users will not see this measure, but will be able to use it for KPIs.
Also, make sure that you are selecting all the base measures which are involved in the expression in the Non-empty behavior dropdown.
KPI Definition
Now everything is set to create KPIs.

The KPI is named Profit Margin.KPI value is set as Profit Margin measure which we defined before. KPI goal is set as 0.02 or 20%. As said before, the goal can be a more complex configuration than this. The KPI goal will be modified later in order to demonstrate the complex nature of the goal other than just a number.
Status is the important parameter which will be displayed to the end user. Following is the MDX code used to define the KPI status.
CASE
  WHEN KpiValue("Profit Margin") > KpiGoal("Profit Margin")
    THEN 1
  WHEN KpiValue("Profit Margin") < KpiGoal("Profit Margin")   AND
       KpiValue("Profit Margin") > 0
     THEN 0
  ELSE -1
END
KPI status has three statuses which are -1, 0, 1. So a KPI status should define the condition which will match -1, 0 and 1 so that each indicator will be matched with the relative status. In the above code, two KPIs have been used. KPIVALUE and KPIGOAL will return the value and goal of the KPI passed as a parameter. In the above example, it will return KPI value and KPI goal of Profit Margin. Though this KPI has a very simple value and goal, in the case of complex values and goals, there is no need to repeat them with the use of these KPI functions. Also, there is a provision to pass the different KPI names as a parameter, values, and goal of another KPI to combine the values.
In this KPI status if the value is greater than the margin it should be 1. If it is less than the goal, but still greater than 0, the status is 0, else it should be 0.
The trend is defined by the following MDX query. As said before, the trend is used to compare the KPI with previous years typically. The following MDX will compare the Calendar Year of the Order Date dimension.
CASE
  WHEN IsEmpty(ParallelPeriod([Order Date].[Calendar Year].[Calendar Year],
      1, [Order Date].[Calendar Year]))
    THEN 0
  WHEN [Measures].[Profit Margin] >
    (ParallelPeriod([Order Date].[Calendar Year].[Calendar Year],
      1, [Order Date].[Calendar Year]), [Measures].[Profit Margin])
    THEN 1
  WHEN [Measures].[Profit Margin] =
    (ParallelPeriod([Order Date].[Calendar Year].[Calendar Year],
      1, [Order Date].[Calendar Year]), [Measures].[Profit Margin])
    THEN 0
  ELSE -1
END
Additional Optional Properties
There are few additional optional properties as shown below.
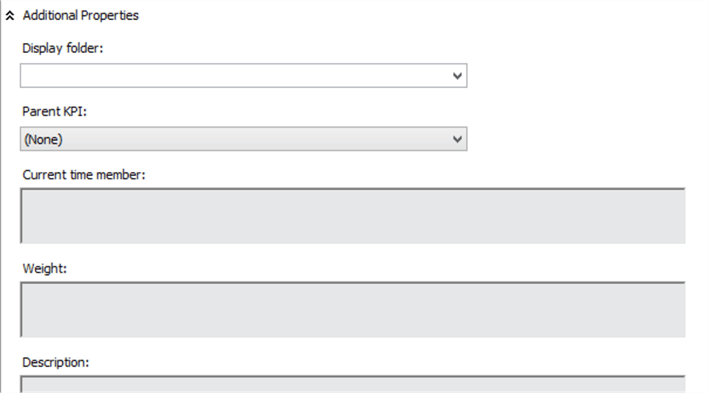
- Display Folder: when browsing the cube, the KPI can be found in this folder.
- Parent KPI: KPIs can be defined as a child of another KPI so the parent KPI can use the value of its child KPI.
- Current time member: this is a MDX expression which returns a member that identifies the temporal context of the KPI.
- Weight: this is another MDX expression which assigns a weight to a child KPI to indicate its relative importance in the parent KPI.
- Description: a brief description of the KPI so that everyone knows the purpose of the KPI.
Testing with Excel
Typically, non-technical users will use Excel to connect to the SSAS cubes and to verify the created KPI. When connected to the cube via Excel, the end-user will see all the KPIs and properties in the PivotTable Fields as shown below.
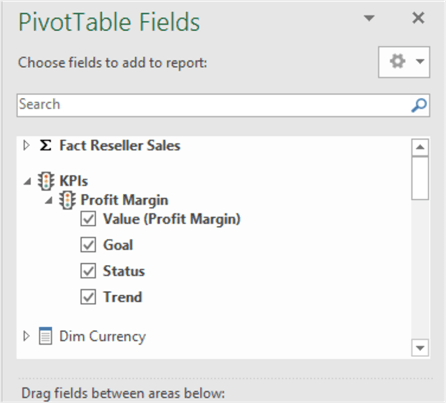
Let’s select all the properties of the created KPI with the Order Date hierarchy as we created the trend using the Order Date.
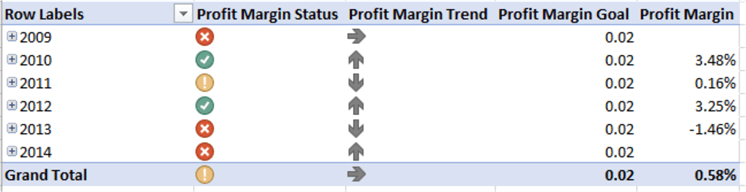
The KPI Status Goal and Value are self-explanatory as it shows what we have configured. The important entity to discuss is the Trend. Every year Profit Margin is compared to the previous year. 2010 profit margin is 2.34% and 2011 profit margin is 0.16% which is a downward trend which is shown in the Profit Margin Trend. 2012 profit Margin is 3.25% and compared to 2011 it is an upward trend which is shown in the Profit Margin trend.
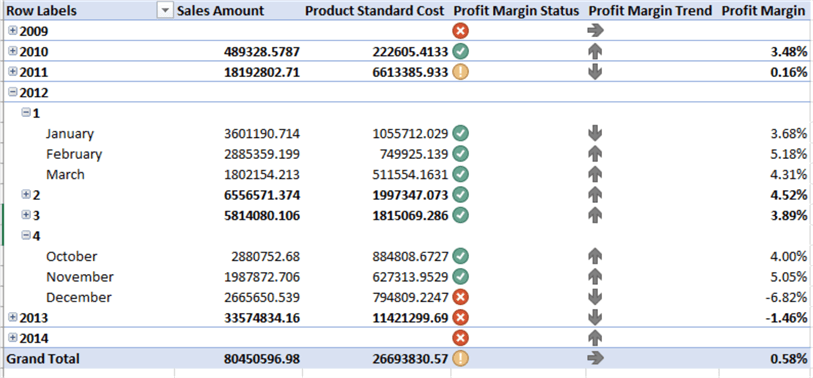
Drill down analysis is another important set of functionally in cube data analysis. The following Excel sheet shows that KPIs can be combined with other measures in the cube.
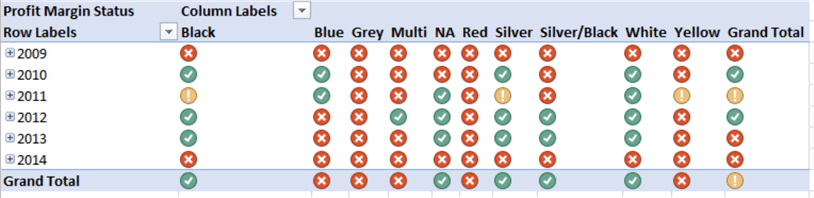
Also, this KPI can be used in tabular as shown in the below figure. In this analysis, Product Color is used in the header.
Similarly, this KPIs can be used as a dashboard as shown in the below figure.

More Complicated Goal
In the previous example, we have used a simple calculation for the KPI goal. However, the goal can be somewhat more complicated as shown below.
CASE [Dim Sales Territory].[Sales Territory Group]
    WHEN Europe THEN 0.01
    WHEN [North America] THEN 0.0075
    ELSE 0.02
END
This goal calculation says if the sales territory is Europe the goal should be 1%, for North America it should be 0.75% and for all other territories it should be 2%.
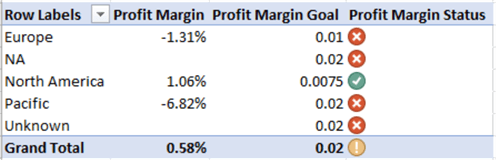
From the above image, you can see that the goal of the profit margin for North America is set to 0.75% hence the profit margin status has changed to great.
KPI Templates
In the industry, there are standard KPIs such as Customer Profitability, Labor Turnover, Absenteeism, etc. Since these are industry standards, SSAS KPI provides various templates so that end users can easily select them for use.
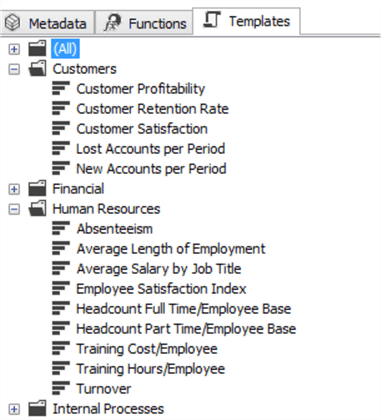
Following is the template for Absenteeism.

As shown in the above figure, it’s just a matter of changing the KPI value and the KPI goal and the KPI is ready for use.
Summary
KPIs can be used for faster analysis in SSAS multi-dimensional cubes. SSAS provides a much easier way to configure KPIs and use them. By using the existing templates, users can implement standard KPIs for their industry.
Next Steps
- For further details please visit the following links:

Dinesh Asanka holds a Bachelor of Science in Electrical Engineering, an MBA in Information Technology, a Master of Science in Artificial Intelligence, and an MPhil in Data Warehousing from the University of Moratuwa. With more than 30 years of industry experience, he has successfully bridged the gap between theoretical knowledge and practical application in the fields of data management and analytics. Currently serving as a Senior Lecturer at the University of Kelaniya, he teaches subjects including Data Science, Big Data Analytics, and Database Administration. His research interests focus on Educational Analytics, Health Analytics, Data Science, and Artificial Intelligence-driven solutions for decision-making and learning enhancement. In addition to his academic and research contributions, Dinesh is also an active columnist and presenter who regularly contributes to professional forums, conferences, workshops, and public discussions related to technology, analytics, and digital transformation.
- MSSQLTips Awards: Rookie of the Year Contender – 2018