Problem
We are using SQL Server Reporting Services (SSRS) 2016. I’d like to create a key performance indicator (KPI) to track the status of my orders. I’d also like to show this KPI on any mobile device. How can we achieve this?
Solution
Before the SQL Server 2016 release, Microsoft acquired Datazen, a company specialized in building front-end dashboards on top of the Microsoft BI stack. Their solution was capable of building mobile dashboards and KPIs that can be displayed on any device (a desktop, a laptop, a tablet, a smartphone and so on). With the release of SQL Server 2016, Microsoft integrated the Datazen technology into Reporting Services. This means you can create mobile dashboards and KPIs using the platform you already have been using for years. Mobile reports are created using the Mobile Report Publisher. You can read more about it in the tip SQL Server 2016 Reporting Services Mobile Report. KPIs on the other hand are created in the brand new Reporting Services portal. This new portal replaces the old Report Manager.
The information provided in this tip is valid for Reporting Services 2016 or later, and for Power BI Report Server as well.
Test Set-up
Before we start, we first need to create a shared dataset. This dataset will provide the necessary data for the KPI. You can either create a dataset in SQL Server Data Tools (SSDT aka Visual Studio) or you can create one using Report Builder. In the portal, clicking on New > Dataset will launch Report Builder. If you haven’t installed Report Builder yet, you will be prompted to do so.
However, before we can even create a dataset, we need a shared data source. In the example here, I’m using the new sample database WideWorldImportersDW. You can read more about installing this database in the tip Installing the new SQL Server sample databases Wide World Importers.

You have several options for specifying the credentials. The first option will usually work, but the second option – where you specify a username and password – might give you more flexibility later on, for example if you want to configure caching on the dataset. When the data source has been created, we can create our shared dataset. The first step is to select our shared data source:

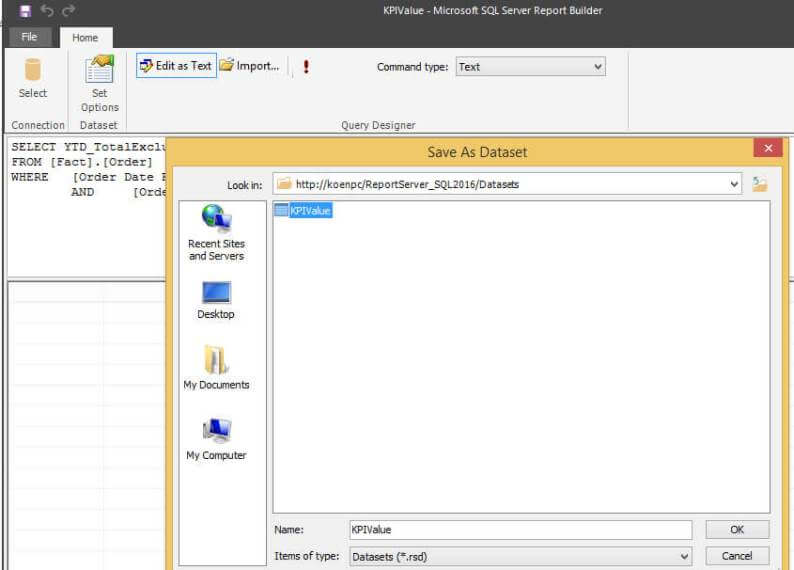
Next we need to write the query for the dataset. The easiest option would be to write the query using Management Studio and to copy paste it into the editor. Make sure you are using the Text Editor by clicking on Edit as Text. Finally we need to save the dataset and give it a name. Then you can close the editor.
The following query was used:
DECLARE @KPIGoal INT = 75000000;
SELECT
  YTD_TotalExcludingTax = SUM([Total Excluding Tax])
 ,KPIGoal    = @KPIGoal
 ,KPIStatus    = CASE WHEN SUM([Total Excluding Tax]) / @KPIGoal < 0.70 THEN -1
         WHEN SUM([Total Excluding Tax]) / @KPIGoal > 0.90 THEN 1
         ELSE 0
         END
FROM [Fact].[Order]
WHERE [Order Date Key] ¡Ý '20160101'
 AND [Order Date Key] ¡Ü '20161231';
With the dataset ready, we can create our KPI.
Creating a KPI
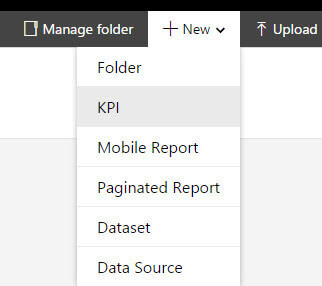
In the Portal, click on New and then on KPI. This will lead you to the KPI editor.

A nice feature about the Datazen technology is that it automatically creates sample data, so that you can immediately view the results of the different configuration options. A KPI has the following properties:
- the value: this is the current value of the KPI. For example, the YTD sales or the number of returned items so far.
- the goal: this is the value which you want to achieve. Note that a KPI can either go above or below a certain goal. For example, for the number of order you want your value to be near the goal or to exceed it. For the number of accidents on the work floor, you certainly want it to be below the goal.
- the status: it shows how well the value is doing with respect to the goal. There are only 3 distinct possible values: -1 (bad), 0 (neutral) and 1 (good). Bad corresponds with the color red, neutral with orange and good with green.
- the trend: this is a number of values showing how the KPI has been doing over a certain time period. This allows for a more thorough investigation for the KPI. For example, if the sales goal is 1 million dollars and the current value is $950,000, you might assume you’ll certainly reach the goal. However, if the trend shows there are no sales made in the past quarter, you might have some serious troubles.
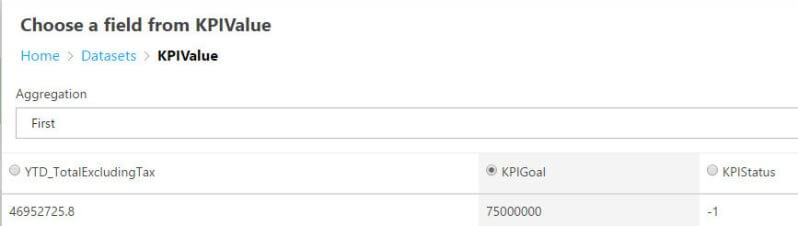
For each property, you can choose between three options: specifying the value manually, using a dataset or to set nothing at all. The value, status and trend typically need to be provided by the dataset. The goal can easily be entered manually, or it can be provided by a dataset as well. In our example, the dataset provides one single line with the value, the goal and the status.
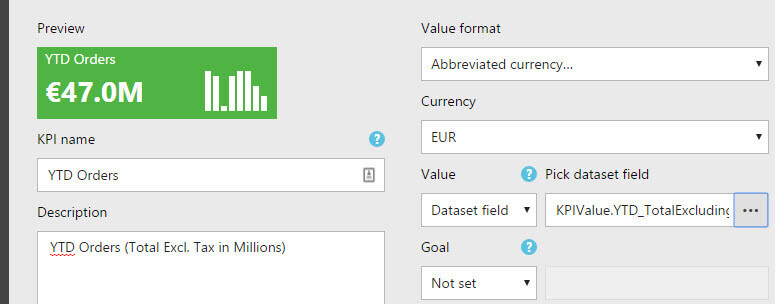
Let’s configure the KPI value using our dataset. When you choose the KPIValue dataset, it will retrieve the data. However, you can have only one single value, so you need to choose an aggregation method that returns one single value. In our example, we have only one single line in the result set, so it doesn’t matter. However, you could also use a result set with multiple rows and then choose average, min, max or another aggregation method to retrieve one single value. In the editor, you also need to choose which column you want to use.

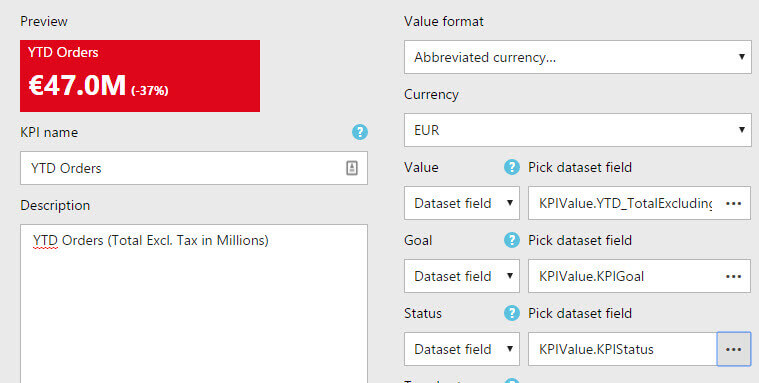
For the KPI value, there are some formatting options available. You can for example format it as a percentage, a currency or an abbreviated format. In the example, I choose for abbreviated currency. This means that numbers are rounded down to thousands or millions. Here the value 46952725.8 is rounded down to 47.0M. If you choose a currency format, you also have to specify the currency code.
Next item on the menu is configuring the goal. By setting the dropdown to “Set manually”, you can enter a hard coded value.
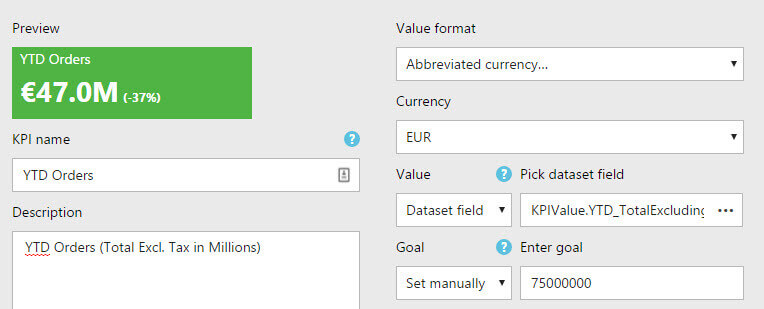
On the other hand, you can also set the dropdown to “Dataset field” and choose the goal for the KPI from the shared dataset:
As with the KPI value, the editor expects one single value so an aggregation function needs to be chosen. The same process can be repeat to configure the KPI status.

The KPI is now configured. Since the status is -1, the color of the KPI becomes red.
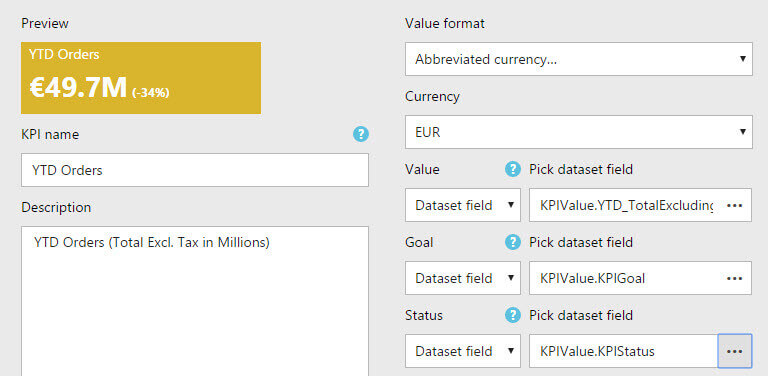
As mentioned earlier, the editor expects only the values -1,0 and 1. If you use another value, it will be rounded down. For example, I changed the dataset to return -0.8 instead of -1. We can see in the following screenshot that the value is rounded down (or up) to 0, since the color becomes orange.
After clicking Create, the KPI is added to the portal. Each object type gets its own section in the portal and we can find our KPI in the KPIS section.

Clicking on the KPI will open a pop-up, where you can view more details such as the description and the author of the KPI.

Note that you can also view your KPIs on your mobile device using the Power BI app:

If you don’t have the Power BI app, you can also view your KPI on any device by just browsing to the Reporting Services portal using your favorite browser. Typically the URL is of the format http://myserver/Reports for a default instance and http://myserver/Reports_myinstance for a named instance of SQL Server.
Conclusion
It’s straight forward to create a key performance indicator (KPI) in Reporting Services 2016 or later. You only need a shared dataset that provides the values for the KPI value, goal and status. In another tip, we’ll discuss how you can add trends and more advanced configuration options.
Next Steps
- Try it out yourself! Go to the SSRS portal and create a new KPI. Sample values are automatically provided.
- The tip SQL Server 2016 Reporting Services Mobile Report goes into more detail about how to create mobile reports using the Datazen technology.
- For more SQL Server 2016 tips, you can use this overview.

Koen Verbeeck is a seasoned business intelligence consultant with over a decade of experience with the Microsoft Data Platform. He holds several certifications, including Azure Data Engineer. He’s a prolific writer, with over 375 articles on technologies such as Microsoft Fabric, SSIS, ADF, SSAS, SSRS, MDS, Power BI, Snowflake and Azure services. He has spoken at various events such as PASS, SQLBits, dataMinds Connect and many others. He frequently delivers educational webinars on MSSQLTips.com. For his efforts, Koen has been awarded the Microsoft MVP data platform award for many years.
- MSSQLTips Awards:
- Leadership Award (200+ Tips) – 2021
- Author of the Year – 2014/2020/2022
- Author Contender – 2024/2025