Problem
SQL Server Reporting Services 2016 (SSRS) introduces the concept of mobile reports and KPI, followed by Microsoft’s acquisition of Datazen. The tip Create a basic KPI in SQL Server Reporting Services 2016 explained how you can create such a KPI in the brand new Reporting Services portal. In this tip, we’ll take it a step further and explain additional configuration options for a KPI.
Solution
Test Set-up
We will use the same test set-up as in the tip Create a basic KPI in SQL Server Reporting Services 2016, so it’s advised to read it first. The tip explains how to create a shared data source, a shared data set and a basic KPI using the result set of the dataset. For the sake of completeness, this is the query used in the dataset:
DECLARE @KPIGoal INT = 75000000;
SELECT
YTD_TotalExcludingTax = SUM([Total Excluding Tax])
,KPIGoal = @KPIGoal
,KPIStatus = CASE WHEN SUM([Total Excluding Tax]) / @KPIGoal < 0.70 THEN -1
WHEN SUM([Total Excluding Tax]) / @KPIGoal > 0.90 THEN 1
ELSE 0
END
FROM [Fact].[Order]
WHERE [Order Date Key] >= '20160101'
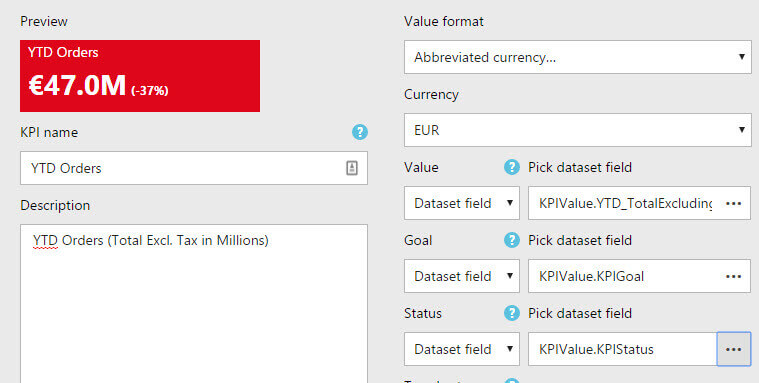
AND [Order Date Key] <= '20161231';With the dataset created, you can create a KPI by following the instructions in the tip. Ultimately, your KPI should look like this:
Using Favorites
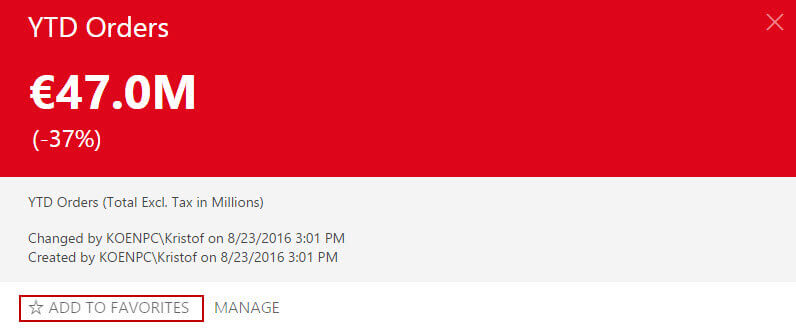
In the Portal, you can mark one or more KPIs (or reports) as your favorites. You can simply do this by clicking on a KPI, which will result in a pop-up. In the pop-up, you simply select Add to Favorites.
When you return to the portal, you can recognize your favorite KPIs by a star in the upper right corner.

Now, at the top of the portal you can click on the Favorites header. This will take you to a separate page where all your favorite KPIs and dashboards are displayed together. This page should also be your starting page when you browse to the report portal for the first time. Favorites should also be supported by the native Power BI app.

Adding a Trend to a KPI
The KPI visualization in Reporting Services 2016 also supports the display of a trend. In order to achieve this, we are going to need another dataset. This dataset will return all of the data points needed to draw the trend line.

The following query retrieves the monthly sales amount from the orders table:
SELECT
  Trend_TotalExcludingTax = SUM([Total Excluding Tax])
  ,OrderMonth    = MONTH([Order Date Key])
FROM [Fact].[Order]
WHERE [Order Date Key] >= '20160101'
 AND [Order Date Key] <= '20161231'
GROUP BY MONTH([Order Date Key])
ORDER BY 2;
In the KPI editor, you need to set the Trend Set to Dataset trend.

In contrast with the other dataset, you don’t need to choose an aggregation function because now it’s completely normal to have a multi-row result set. Keep in mind that the KPI is just a visualization container. It’s up to the author of the dataset queries to make sure everything makes sense and that the trend corresponds correctly with the KPI values shown.

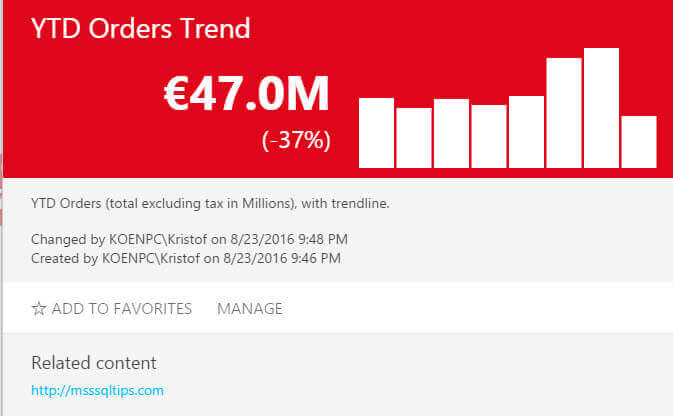
With the trend configured, the KPI now looks like this:

With the trend included, we can easily deduce that orders have been rising since the start of the year, with a great peak in the last two months. It’s also clear that the current month is not finished yet (hence the low bar). There are also other visualization methods for the trend: a line graph, a stair-stepped graph or an area chart. All the other options are shown in the figure below:

The finished KPI looks like this in the portal:

Configuring Related Content
A final option of a KPI is the ability to set a drill-through link. This link can either be a mobile report published on the portal or a custom URL.

When you choose Mobile Report, you can choose the destination in a dialog.

When you now click on the KPI in the portal, a thumbnail of the mobile report will be shown under related content. Clicking on this thumbnail will simply navigate you to this report.

You can also specify a custom URL. This can be anything: a website, a SharePoint site, an URL to an SSRS report (which would allow you to pass along hardcoded parameters).

When you now click on the KPI, the URL will be shown under related content.
Unfortunately it’s only possible to add one mobile report or one custom URL.
Conclusion
This tip has shown how you can easily add a trend to a KPI. It also explained how to favorite a KPI and how to add related content to a KPI.
Next Steps
- Try it out yourself! Go to the SSRS portal and create a new KPI with a trend. Sample values are automatically provided.
- Please refer to the tip Create a basic KPI in SQL Server Reporting Services 2016 for information on creating KPIs in SSRS 2016.
- For more SQL Server 2016 tips, you can use this overview.

Koen Verbeeck is a seasoned business intelligence consultant with over a decade of experience with the Microsoft Data Platform. He holds several certifications, including Azure Data Engineer. He’s a prolific writer, with over 375 articles on technologies such as Microsoft Fabric, SSIS, ADF, SSAS, SSRS, MDS, Power BI, Snowflake and Azure services. He has spoken at various events such as PASS, SQLBits, dataMinds Connect and many others. He frequently delivers educational webinars on MSSQLTips.com. For his efforts, Koen has been awarded the Microsoft MVP data platform award for many years.
- MSSQLTips Awards:
- Leadership Award (200+ Tips) – 2021
- Author of the Year – 2014/2020/2022
- Author Contender – 2024/2025