Problem
Key Performance Indicators (KPIs) are the most common and included data elements on mobile reports. KPIs are frequently tracked at every level of an organization. Gauges are the most logical visualization for representing KPIs. Also gauges are very compact visualizations making them ideal for mobile reporting. In this tip we would learn how to use KPIs as a data source and report the same using a bulletgraph gauge on a mobile report.
Solution
Mobile reports can access published shared datasets, consume the same in visualizations and render in mobile reports.
Mobile Report Publisher can be used to author mobile reports that can be hosted in SQL Server Reporting Services (SSRS) 2016. For this tip, we assume that a KPI is available and hosted on the SSRS report portal as a shared dataset. You can learn more about creating KPIs and hosting them on a report portal from this tip.
Follow the below steps to add a KPI and consume it on a bulletgraph gauge.
1) I have a sample KPI already published on the SSRS report portal. This KPI is the Net Income from the AdventureWorks sample cube. A KPI has goal, value, status and trend as fields available in the dataset.

2) Open Mobile Report Publisher and you should have a blank report open that is ready to author. Click on the Add Data button and navigate to the path on your report server where the KPI has been published.

3) Once you have added the KPI successfully to your report, you should be able to see the data similar to the below image. Take a note that the value of the KPI is 12.6 million and the Goal is almost 5.6 million. That means the KPI has reached its target that is much higher than the goal.

4) Drag and drop the bulletgraph gauge on the report and click on the data tab. Configure the data properties of the bulletgraph as shown below. The main value should be the actual value field of the KPI and comparison value should be the goal field of the KPI.
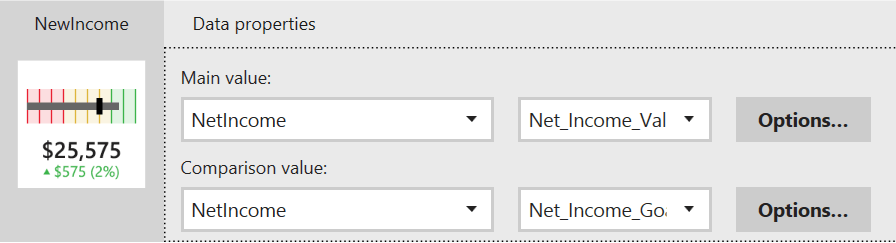
5) Go back to the report layout and you should be able to see the bulletgraph value as shown below. The black vertical bar shows the goal and the horizontal grey bar shows the actual value of the KPI. The graph clearly shows that the value of the KPI is much ahead the goal.

6) If you swap the goal and value fields in the main and comparison metric properties, you will find the bulletgraph as shown below. In this case the goal has become 12.6M and actual value has become 5.6M. If you carefully compare the below and above graphic, you should be able to see that the scale is different in both of them. The above graphic has a scale of 12.6M and the below has a scale of 18.9 million. The scale is dynamically adjusted based on the actual value and goal of the KPI.

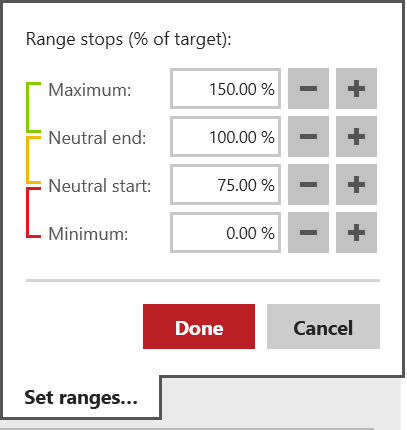
7) The thresholds are different as well in both the graphics. These thresholds can be configured using the range properties as shown below. These thresholds define the colors displayed on the bulletgraph.
In this way we can use KPIs, represent the same using gauges and display the same on a mobile report.
Next Steps
- Consider reading more about the bulletgraph from here.
- Consider using other gauges to represent different types of KPIs on mobile reports.
- Check out this tutorial on SQL Server Reporting Services Mobile Report Tutorial.

Siddharth has more than 14 years of experience in the IT Industry, with more than a decade of experience in Business Intelligence and Analytics, for clients banking, logistics, government, Media Entertainment, products, life sciences and other domains. He has been a lead architect for a portfolio of 40+ apps, containing apps in web, mobile, BI, Analytics, data warehousing, reporting, collaboration, CMS, NoSQL and other technologies. He has several certifications and is a published author for online and print-media publications, as well as the MSDN Library.
In his present role, he remains responsible for architecture design, technology stack selection, infrastructure design, 3rd party products evaluation and procurement, and performance engineering. These applications use technologies like Elasticsearch / Lucene, MongoDB, SharePoint 2013 and 2010, jQuery-based framework like Highcharts and GoJS, SQL Server and the Microsoft Business Intelligence stack (SSIS, SSAS, SSRS, MDX, PowerPivot, PowerView), jQueryMobile, Bootstrap, iOS xCode framework, and many others.
- MSSQLTips Awards: Champion (100+ tips) – 2018 | Author of the Year – 2017 | Author Contender – 2016, 2018-2019