Problem
What is the best way to review and evaluate the performance of my Power BI files?
Solution
As with many new tools, much of the hype over Power BI has been on what it can do, or better yet, what it can show. The number of features just keeps growing which is a wonderful thing; it is so refreshing to see the new features that are released with each roughly monthly update. In one of the latest updates, a “backend” feature was added that should assist with the overall reliability. The Performance Analyzer feature provides a way for the report designer to determine the clock times of the processes that occur when data is refreshed and loaded into a Power BI visual. The timing list includes items such as the amount of time it takes to load the data and then subsequently how long it takes the visual to be refreshed with the data, among other items. We will cover these items as we move through the tip.
The best way to see the benefits of the Performance Analyzer is through an example. However, before we get into the example, you need to be sure to download the latest version of Power BI Desktop. Additionally, we will be using the WideWorldImportersDW database as a basis for our data sources; this database can be downloaded from GitHub. If you need a refresher on bringing data into Power BI please see this tip.
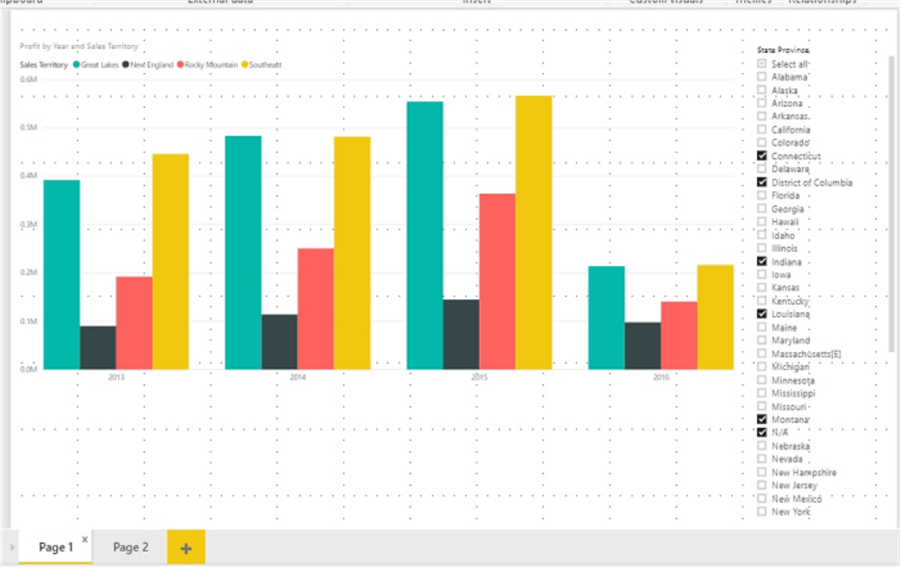
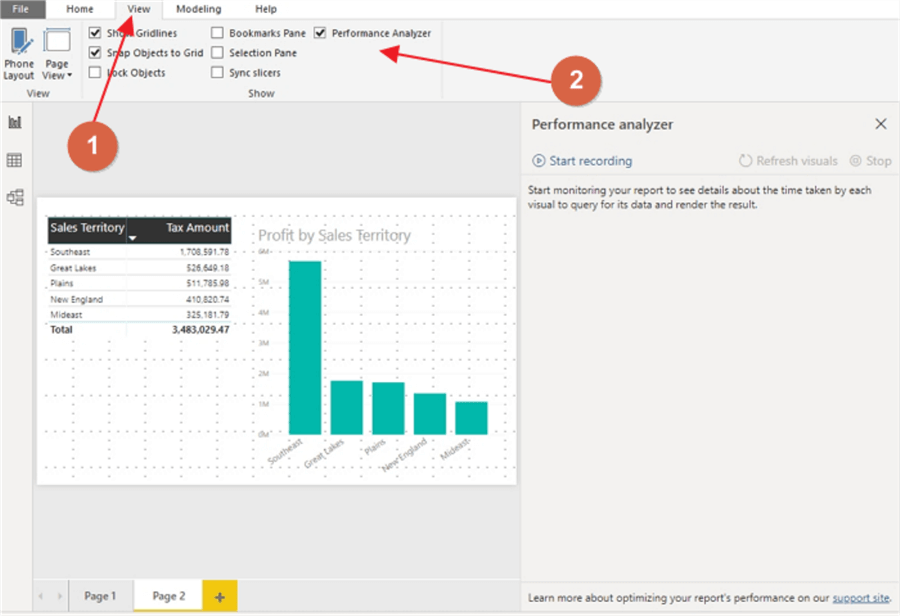
To help get us started, a Power BI PBIX report file is created, and two tabs are added to the report. The first tab contains a bar chart and slicer while the second tab includes a matrix and another bar chart, as illustrated in the next two screen prints.

As shown below, to enable the Performance Analyzer, first switch to the View tab and then click on the check box next to Performance Analyzer to enable this feature.
At this point, the Performance Analyzer tab will open. To actually begin to collect data on performance, a recording of the various report data processing must be completed. Thus, a plan of visual refreshing and interaction should likely be established, in order to record the appropriate processes that need to be monitored.
Once the Start Recording button is clicked, Power BI will track three items which include the Visual Display, the DAX Query, and a catch all Other category. The Visual display item records, after the data is returned, the amount of time it takes to render the visual on the screen. This timing could include the time required to render a map for instance as well as the time it takes to get and generate map details such as roads or other geography from external sources. The DAX query line item considers the time required to send the query to the data sources and then ultimately return to the Power BI visual. The Other category is really a catch all for any time that is expended while waiting for other processes to complete within other visuals, waiting for Power BI system processing, or any time that the DAX query is queued waiting for its turn to run in the processing queue. As shown in the below example the Other category can be a significant portion of the wait time.

Additionally, you will notice the Performance Analyzer monitors each visual interaction that takes place. Thus, the Performance Analyzer will track various actions that occur. For instance, in the first screen print below, we see the Changed the model action; this action is produced when we refresh the model data. You will also see actions like:
- Changed a Slicer
- Cross-highlighted
- Refreshed visual
- Drilled down/up
- Changed page
- Edited a Visual

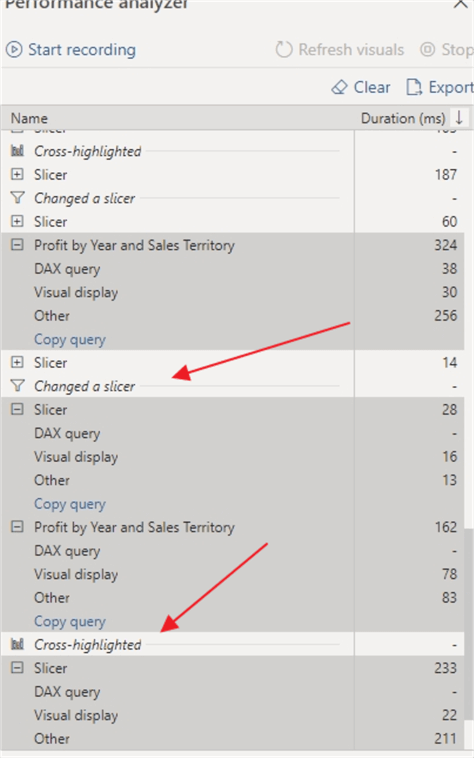
As shown above, we can also see that each process may or may not institute a DAX query. Often a slicer change does not institute a DAX query. Similarly, a Cross-highlighted action also does not normally execute a DAX query nor do the Drilled down action. To the contrary, almost always, refreshing a visual will institute a DAX query. However, just about any action will result in some wait times in the Visual display and Other categories.
Each of the data point timings which have been discussed above provide us with potential action plans to see if performance can be improved. For example, if you see that during a Changed the model action that the DAX query timing is taking a long time, it would be recommended that model and any related additions to the model, such as calculated columns or measures, should be examined to attempt to improve performance. Alternately, if a visual is taking a long time to refresh, it could be that the visual contains too much data. This situation can often occur with a table or matrix visual which is returning, say, several million rows of data (remember no one can review that many rows!). Another situation could be that the Other category is revealing a significant wait time. This condition could mean that maybe there are too many visuals on a report or maybe one visual is monopolizing the processing.
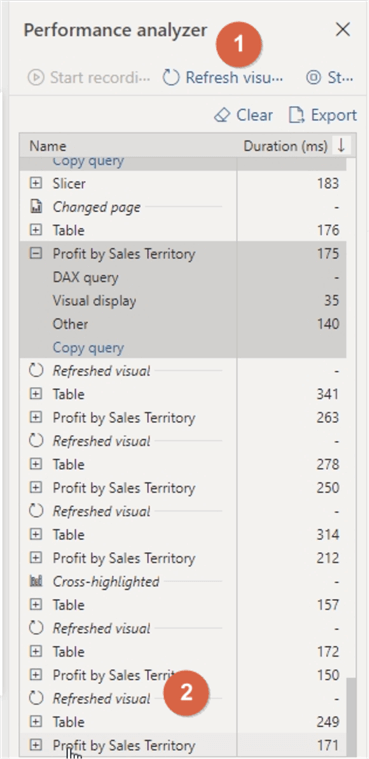
Another handy feature that can be used within the Performance Analyzer is the Refresh visuals option. This button will initiate a manual refresh of all the visuals. That function can be handy in cases where many visuals exist, and you want to quickly examine the timing of all the visuals in one pass.
Finally, when recording is no longer desired, clicking the Stop option will curtail the recording of the performance data, as illustrated below. The Clear option, also shown below, will truncate all the timing data. Note the data is not saved when saving the report.
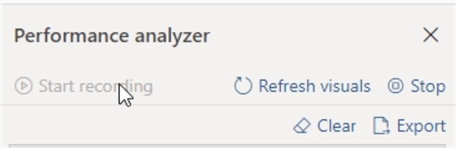
In the event that data are needed for future analysis or to report on in another tool (even within Power BI), the Export option provides the opportunity to save the data in a JSON format.
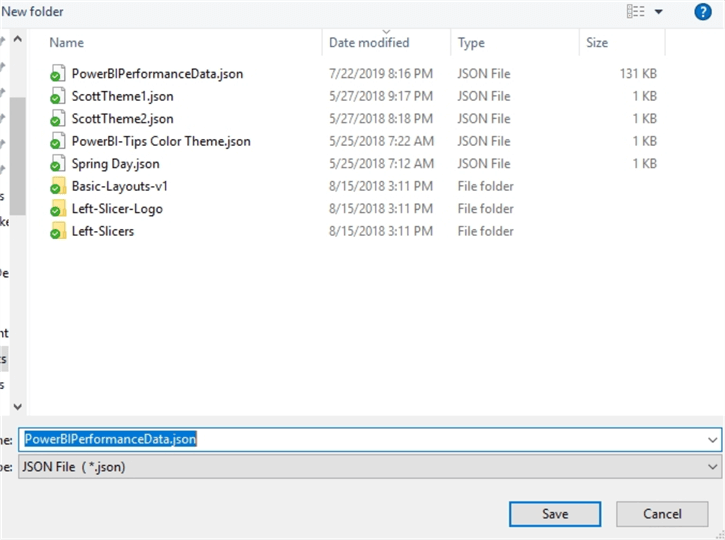
We can use the JSON file as the basis for another data source within Power BI if we so desire. Such a data model is shown below (see this tip for importing JSON files into Power BI).

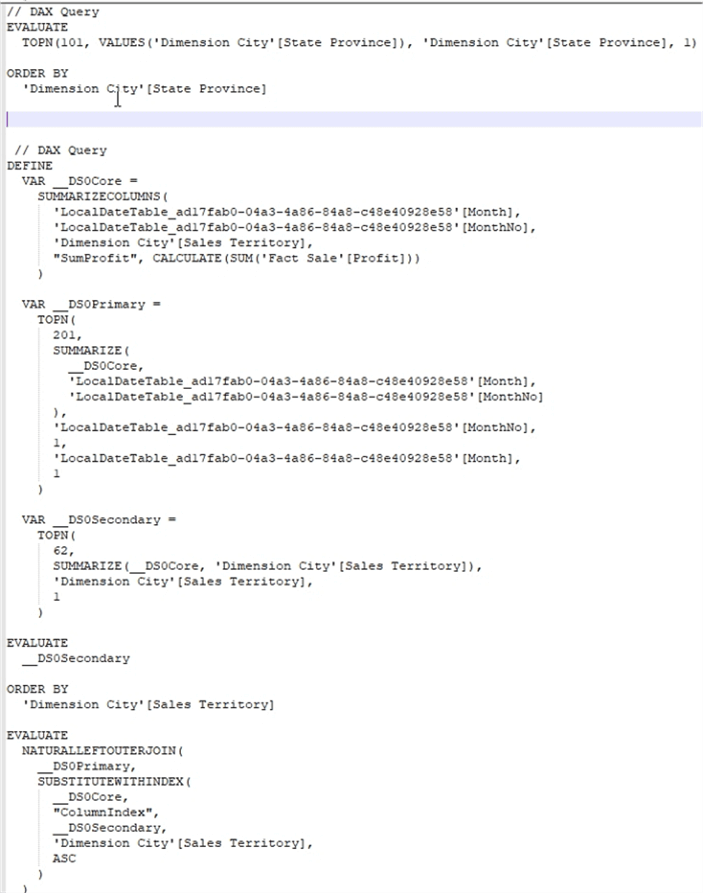
One last item that can be helpful not only from a performance standpoint, but to assist with learning DAX is the Copy query option. As demonstrated below, the Copy query option is displayed under each timing action.

The Copy query feature copies the related DAX query to the clipboard. Below are some examples of what is produced for each of the related actions. Reviewing these queries can be helpful to see some of the DAX language used to produce various results, and as such can be a learning experience.
The new Performance Analyzer is an easy and accessible way to track the performance of a Power BI report during the development process in Power BI Desktop.
Next Steps
- Check out more Power BI Tips

I have a passion for crafting Business Intelligence Solutions for my user groups. My experience includes almost 15 years of SQL Server involvement with the last 12 years focused specifically on Business Intelligence, SharePoint, OLAP, SSRS, and Decision Support solutions. Currently, I am a Business Intelligence Architect in the healthcare industry, and I also teach database and analytics classes for Kennesaw State University, Southern New Hampshire University, and Reinhardt University. My education includes an MBA and an undergraduate in Accounting (yes I am a reformed accountant!), both from Kennesaw State University. I enjoy every day by trying to grow my faith and spend precious time with my family. I have been happily married to my wife of over 20 years, and we have two teenagers one who we home school with the help of a University Model School, Cornerstone Prep in Acworth, GA (cornerstoneprep.org). Our other child is a Construction Management major at KSU’s Southern Poly / Marietta campus. We are a soccer and Cross Country (XC) family who play, coach, and referee soccer or run for fun most every day. For several years, our family has volunteered (and played with the dogs and cats) at Etowah Valley Humane Society in Cartersville, GA.
- MSSQLTips Awards: Champion (100+tips) – 2016 | Author of the Year – 2015 | Author Contender – 2014, 2016-2021


