Problem
When working with large data models, slow underlying data sources or complex reports in Power BI we sometimes get stuck with battling performance issues. This can take a bulk of the development time which should have been used for report development instead. I have described some best practice and practical implementations which you could consider while troubleshooting performance issues or optimizing Power BI report performance.
Typical issues that might result because of loading large data models may include:
- Requiring a different license capacity to store the model. Power BI Pro can only allow for a model size of 1GB, although Premium allows for up to 13GB in size.
- Larger data model sizes would usually increase contention for capacity resources like the memory. This does not allow for the concurrent loading of more models for a longer time periods which results in higher eviction rates.
- Larger models achieve slower data refreshes, resulting in higher latency reporting, lower dataset refresh throughput, and increased pressure on source system and capacity resources.
This tip has been separated into a series of three posts for ease of understanding.
Solution
There are several options to consider when optimizing or troubleshooting performance issues, but I will concentrate effort on the following options in this series.
- Implementing Vertical Filtering
- Preference for Custom columns created in Power Query
- Disable “Auto date/time” in data load options settings
- Use a subset of data for development or Horizontal Filtering
- Try using more variables in DAX measures calculations
- Disable Power Query query load for non-required tables
In this series, I have only narrowed down what can be done within the Power BI environment, more options may be done outside of the Power BI environment to speed up query performance in Power BI including creating indexes, altering the dataset by manipulating at the source before connecting to Power BI, etc.
Part 1 of the series will focus on what issues can be resolved by the first two items mentioned above.
Implementing Vertical Filtering in Power BI
The two main purposes for table columns includes Reporting and Model structure. So, it is good practice to only design models with only the columns required. No matter how efficient the Vertipaq storage engine might be in helping to compress and optimize data, it is still very important to implement ways to reduce the model size. Thus, to implement this, I have an example below on how the size model can be reduced by implementing vertical filtering i.e. removing unnecessary columns.
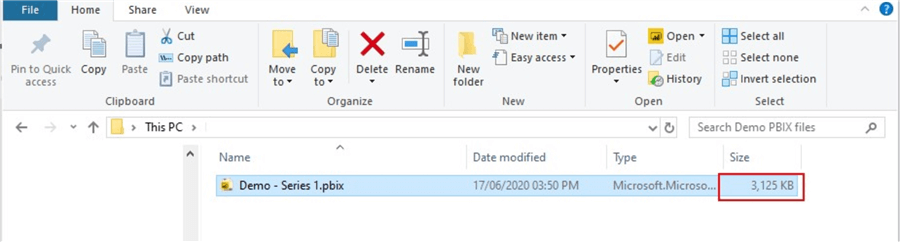
In the image below, I have imported the SalesOrderHeader table from the AdventureWorks 2014 database into a Power BI data model.

The imported table has 26 columns including 4 datetime columns. So, when I save this model to a file location, I can view the size of the model as seen below showing the size is 3,125KB currently.
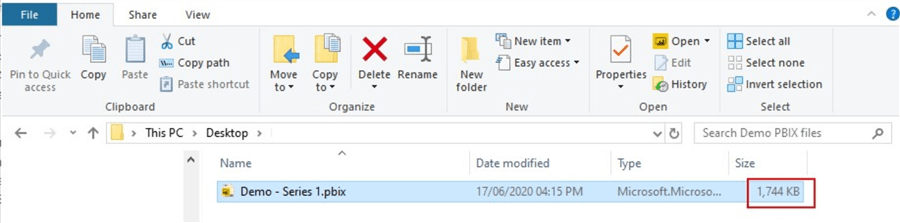
But imagine if this were a very large model, the size would have been far higher, and the way to apply vertical filtering would be to remove columns which do not support the reporting and model structure. In the diagram below, I have removed about seven columns.

Now, if we look back again at the location where the PBIX file is saved, we can see that it has reduced the model size from 3,125KB to 1,744KB, which is about half the initial size. Again, when working with very large data models which increase exponentially, this can be a significant difference.
Preference for Custom columns created in Power Query
As much as possible, a good practice is to create more calculated columns as Power Query computed columns defined in M language. It is known that it is less efficient to add table columns as DAX calculated columns than using the Power Query option, however, there are known exceptions to this as can be demonstrated where certain calculated columns can be done only in DAX. As demonstrated below, it is important to note that the Vertipaq Storage engine stores the model DAX calculated columns the same way as it does Power Query M language computed columns, but the issues that arise in poor efficiency and extended data refresh time in the DAX calculated columns is due to the way the data structures are stored as well as less efficient compression.
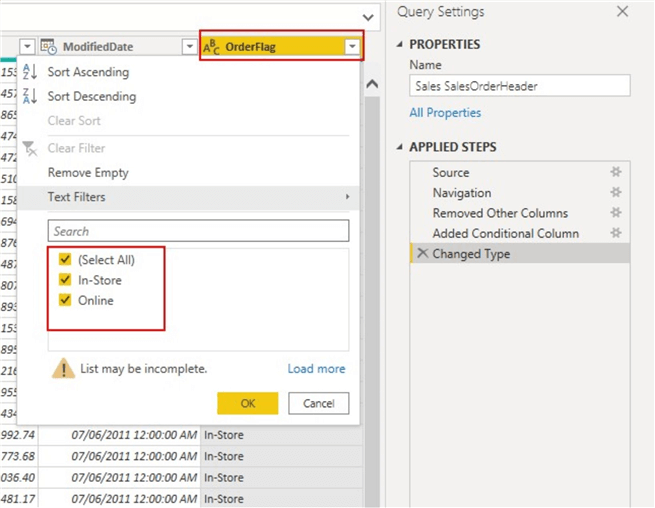
In the below image, I create a column to change the values of the column “OnlineOrderFlag” which is a Boolean (True/False) column. If the value is “TRUE” we want “Online”, and if the value is “FALSE” we want “In-Store”. This can be done in two ways, a Power Query M computed column or a DAX calculated column.
First, let’s see how we can do this in Power Query M computed column.

The new computed column “OrderFlag” can be seen below.
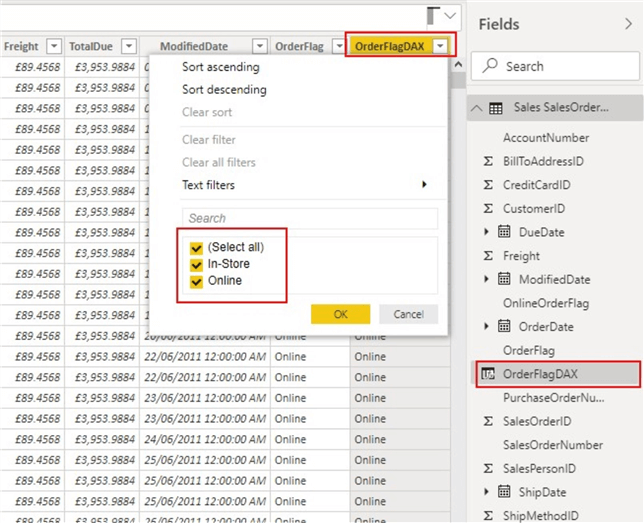
Secondly, we can do the same in a DAX calculated column in Power BI Desktop as seen in the following diagrams.
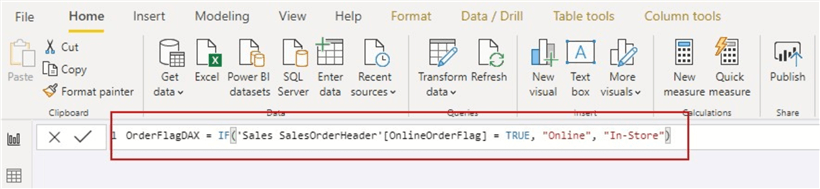
The new calculated column “OrderFlagDAX” can be seen below.
Next, I have created two Slicer visuals for the columns created in Power Query and DAX respectively so we can compare and see their performance when refreshed. Note that this is a small model size, just imagine the effect on larger data models. To compare these, I have leveraged the Performance Analyzer in Power BI desktop as shown below.
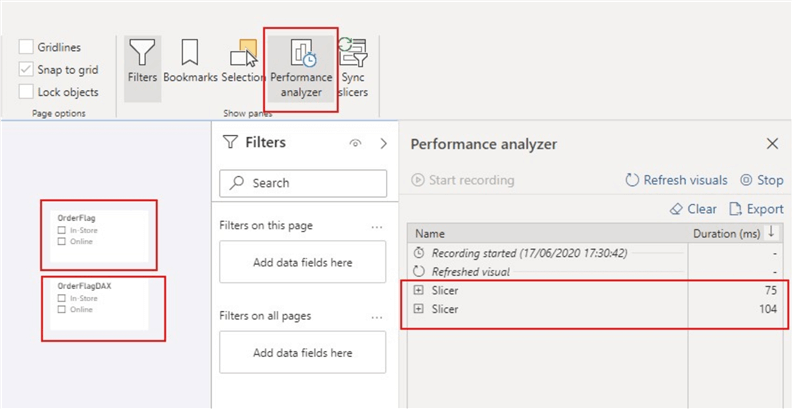
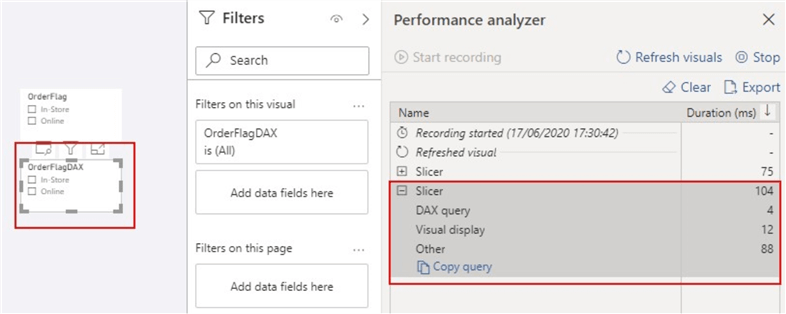
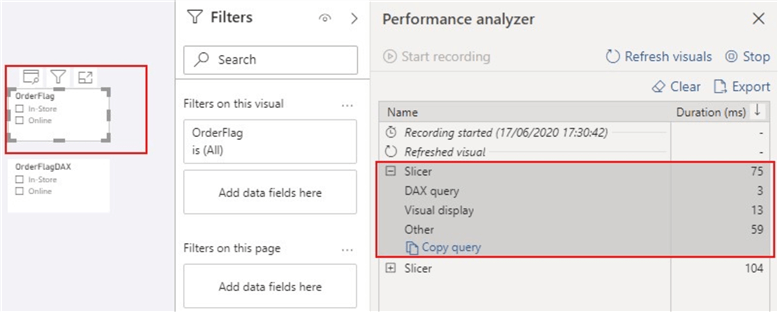
As can be seen in the below image, the “OrderFlag” took about 75 milliseconds to refresh, while the “OrderFlagDAX” took about 104 milliseconds to refresh. The following diagrams would show that this is not due to the execution of the DAX queries but due to the time required by the slicer visual for preparing queries, waiting for other visuals to complete, or performing other background processing. This is where the efficiency comes into play.
In Part 2 we will look at how disabling “auto date/time” and implementing Horizontal Filtering can help to improve performance and reduce inefficiencies in Power BI development.
Next Steps
- Learn more about situations where DAX queries might be more efficient than Power Query computed columns here.
- You can get more information on data reduction techniques here.
- Learn more about different storage modes in Power BI here.
- Try this tip out in your own data as business requires.

Kenneth A. Omorodion is a Microsoft Certified Solutions Associate (MCSA) with 12+ years of enterprise application experience in Power BI, DAX, Microsoft Fabric, Business Intelligence, data warehousing, SSRS, T-SQL, and Azure. Beyond his technical skills, Kenneth has expertise working with stakeholders’ and business leaders to help them better understand key insights. He has a great track record of successfully delivering full life cycle Business Intelligence and data solutions to organizations with measurable business impact.
- MSSQLTips Awards
- Achiever Award (75+ Tips) – 2025
- Author of the Year-2021
- Author Contender-2022/2023/2024


