Problem
When working with Power BI and SQL Server there are different methods to build a report and support the data requirement needs. In this article, we look at using DirectQuery versus Import Mode and when to use one option over the other for your Power BI reports.
Solution
These are guidelines to follow, ensuring your Power BI and SQL Server connection is optimal in most cases. This is determined by factors like the integration mode, internet connection, and how access control and permissions are managed. But first, let’s discuss what DirectQuery and Import modes are and their use cases.
DirectQuery vs. Import Mode
You can get data from your SQL Server using two different modes: DirectQuery and Import.
DirectQuery
DirectQuery is one of many Power BI’s data connectivity modes used between Power BI’s models and an original data host (e.g., SQL Server). In this mode, Power BI does not inherit the source’s data; it only queries the data when needed. This means that Power BI sends queries to the SQL Server every time you interact with the report on Power BI. This mode is ideal when working with a large dataset or if you want to stream real-time data to reports.
Import
The Import mode adapts the SQL Server data into its internal memory engine called VertiPaq. In this mode, the model data is compressed and optimized for fast analytical performance. The data refreshes on this mode are run on a schedule of at least two-hour iterations and cannot process real-time data. This makes it ideal for static reports or those that do not change much.
Mode Differences
The table below showcasing the main differences between the two:
| Feature | Import Mode | DirectQuery Mode |
|---|---|---|
| Data storage | Stored in Power BI (.pbix) file | Stored in SQL Server |
| Real-time data | Not available (Needs constant refresh) | Can run real-time data |
| Query Speed | Fast speed. Due to in-memory engine. | Slower than imported. Makes constant queries to data source. |
| Dataset size limit | 1 GB (Pro), 100 GB (premium) | Unlimited |
| Refresh strategies | Needs manual or scheduled refreshes | Real-time data refresh |
| Offline use | Dataset can be used offline | Dataset cannot be used offline |
Use Cases
You should select a mode depending on your use case. Below are some typical use cases:
| Use Case | Recommended Mode |
|---|---|
| Small dataset with complex DAX requirements | Import |
| Real-time analysis from SQL | DirectQuery |
| Reduce Power BI file size and memory | DirectQuery |
| No internet or remote DB access | Import |
| Sales report with large fact table (over 1million rows) | Composite. DirectQuery handling the fact table and Import mode handing dimension tables. |
| Shared dimension across Import and DirectQuery tables | Dual |
| Live dashboards for operations | DirectQuery |
| Monthly financial reports | Import |
| Executive KPIs | Import |
Test Environment
Now, let’s demonstrate how to configure DirectQuery and Import modes to connect Power BI with SQL Server, as well as sharing, security, and storage of reports. Below are the prerequisites for this demonstration:
- Windows 10
- SQL Server
- SQL Server Management Studio (SSMS) 21
- Power BI Desktop
Let’s get started!
This tip will answer the following questions:
- What is DirectQuery, and where is it configured?
- What is Import Mode, and where is it configured?
- In a single environment, can one report use DirectQuery and another use Import Mode?
- Can DirectQuery and Import Mode be used in the same report? For example, configure it so dimensions use one mode and facts use another mode?
- How large do the reports get with Import Mode?
- With Import Mode, how is the data secured?
Configuration and Performance of Modes
The first step in this demonstration is to create and populate a SQL Server database. If you do not have an existing database with data, create the database and tables, and then populate them to serve as sample data for this exercise using the following T-SQL code on SSMS:
CREATE TABLE Salesperson (
    SalespersonID INT IDENTITY(1,1) PRIMARY KEY,
    FullName NVARCHAR(100),
    City NVARCHAR(100)
);

CREATE TABLE SalesTransactions (
    TransactionID INT IDENTITY(1,1) PRIMARY KEY,
    TransactionDate DATE,
    SalespersonID INT FOREIGN KEY REFERENCES Salesperson(SalespersonID),
    ProductName NVARCHAR(100),
    Quantity INT,
    TotalAmount DECIMAL(10,2)
);

INSERT INTO Salesperson (FullName, City)
VALUES
('Thabo Mokoena', 'Pretoria'),
('Lerato Dlamini', 'Pretoria'),
('Sipho Ndlovu', 'Cape Town'),
('Amanda Jacobs', 'Cape Town'),
('Kagiso Molefe', 'Rustenburg'),
('Nthabiseng Radebe', 'Rustenburg');

DECLARE @i INT = 0;
DECLARE @max INT = 50000;

WHILE @i < @max
BEGIN
    DECLARE @qty INT = ABS(CHECKSUM(NEWID())) % 10 + 1;
    DECLARE @product NVARCHAR(100) = CONCAT('Product_', ABS(CHECKSUM(NEWID())) % 20 + 1);
    DECLARE @price DECIMAL(10,2) = ROUND(RAND() * 100 + 10, 2);

    INSERT INTO SalesTransactions (
        TransactionDate,
        SalespersonID,
        ProductName,
        Quantity,
        TotalAmount
    )
    VALUES (
        DATEADD(DAY, -ABS(CHECKSUM(NEWID())) % 90, GETDATE()),
        ABS(CHECKSUM(NEWID())) % 6 + 1,
        @product,
        @qty,
        ROUND(@qty * @price, 2)
    );

    SET @i += 1;
END;
This will create three tables in your database and populate them with random data.
Configuring DirectQuery
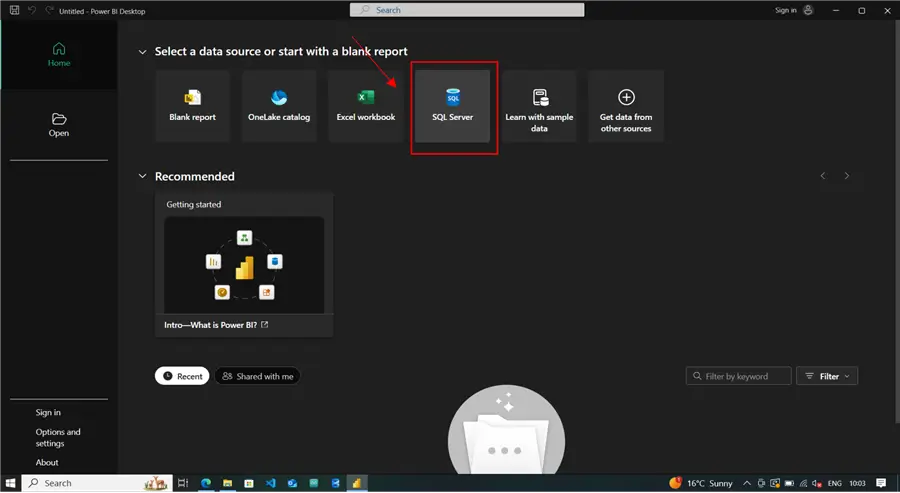
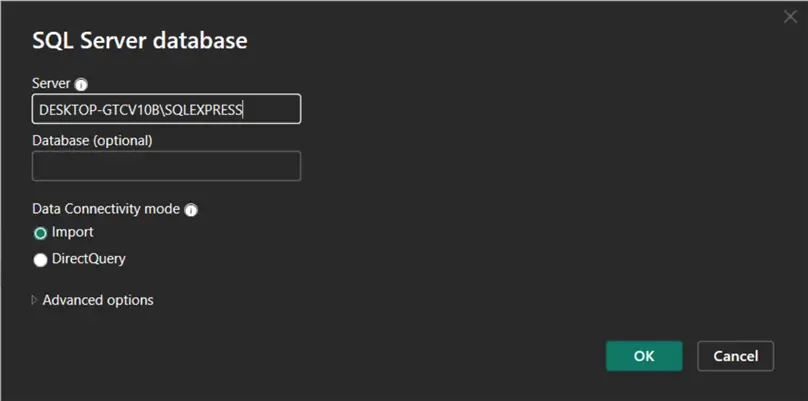
Open Power BI Desktop and on the home page, click SQL Server:
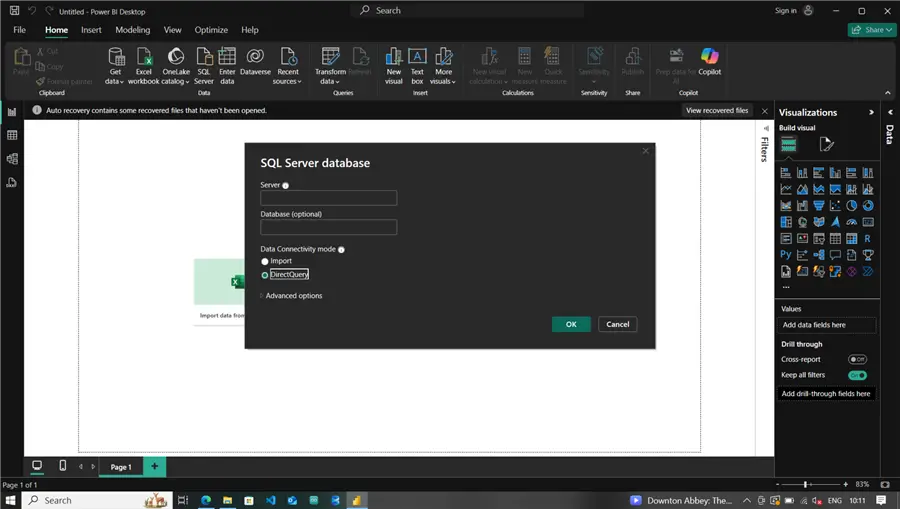
This will lead to a connectivity modal. Here, add the server’s name and select DirectQuery as the Data Connectivity mode. Click OK.
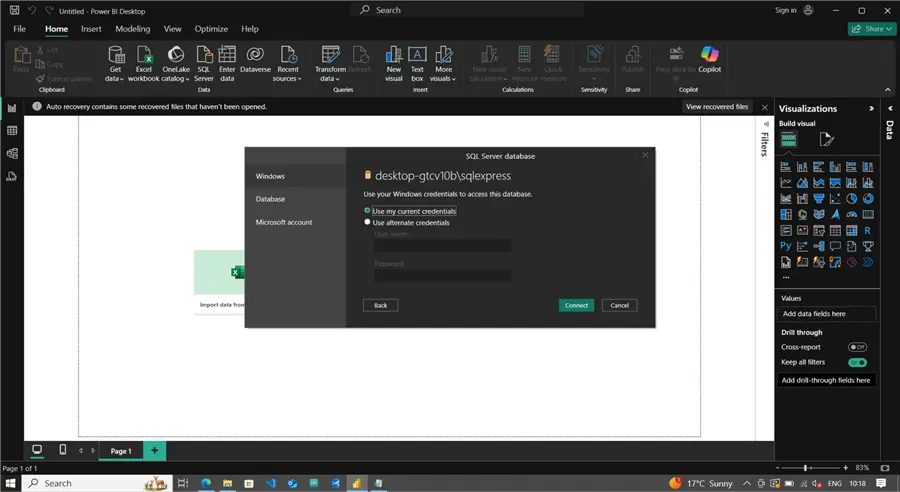
For authentication, use your local windows authentication for databases hosted locally:
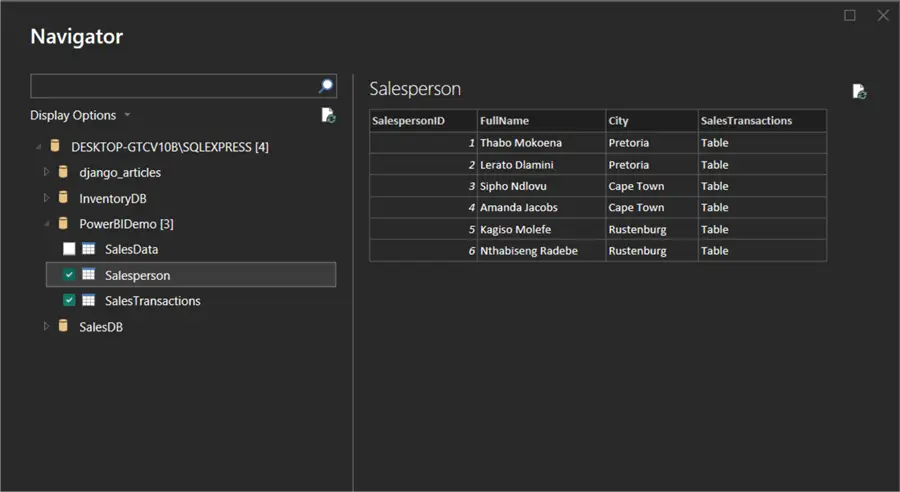
After a successful connection, you will see all the databases associated with the SQL Server in the Navigator. You can choose as many database tables as needed:
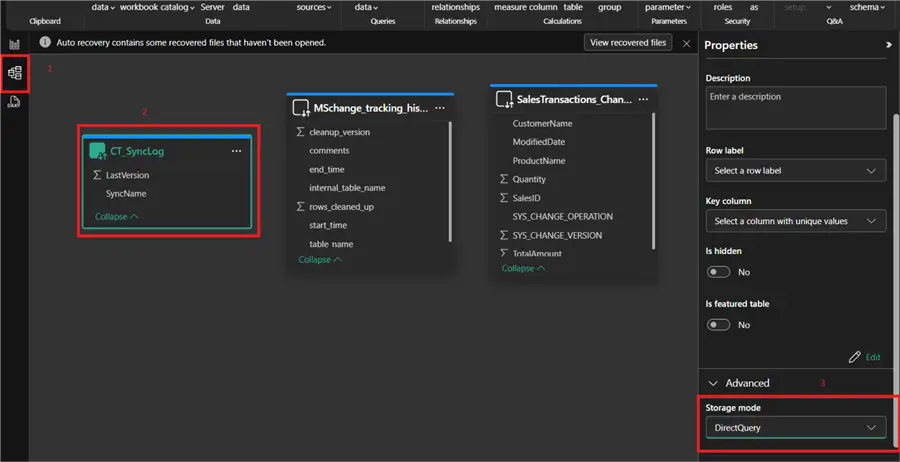
This DirectQuery connectivity can be changed by navigating to the Model View found on the left pane, choosing Table properties, and opening the Storage mode drop-down. You will see the Import and Dual options:
Configuring Import Mode
To start with the Import mode report, open Power BI and choose SQL as your data source:

Then choose Import as the data connectivity mode:
After a successful connection, the available databases appear in the Navigator. Select the database and table just created. Doing so will show a preview of the data on the table:
Clicking Transform takes you to the Power Query Editor:
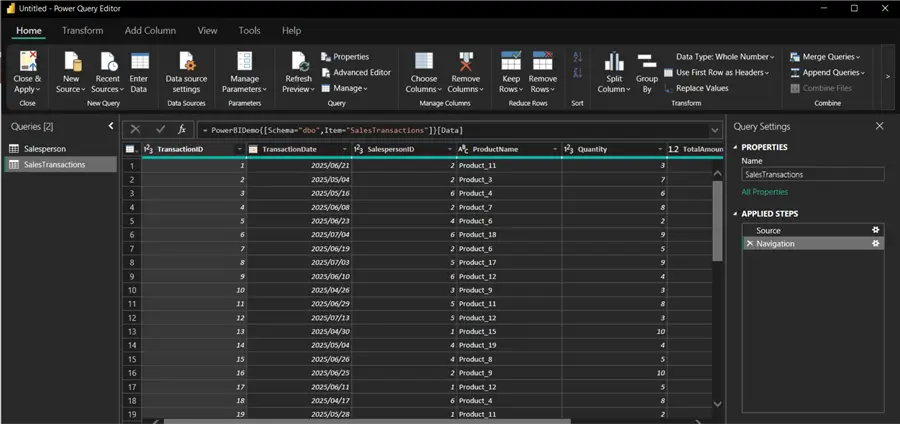
The Power Query Editor in Power BI is essential when opening new datasets with “Transform Data” because it allows you to prepare, clean, and shape your data before loading it into Power BI. Here is where you can change your data’s format or add filters. To go back to your Power BI report, click on Close & Apply.
DirectQuery Performance Check
To get started analyzing the performance of the Import mode. Add a Table and a Slicer visual on the Visualizations pane on the right of the report and use the data used previously on the Import mode section.
To check the performance of the DirectQuery models, click the Optimize tab on the top ribbon, select Performance Analyzer, and click Start Recording. Once active, and after making changes to the report, you will see the time it takes for the reports to respond and the time for a refresh:
Import Mode Performance Check
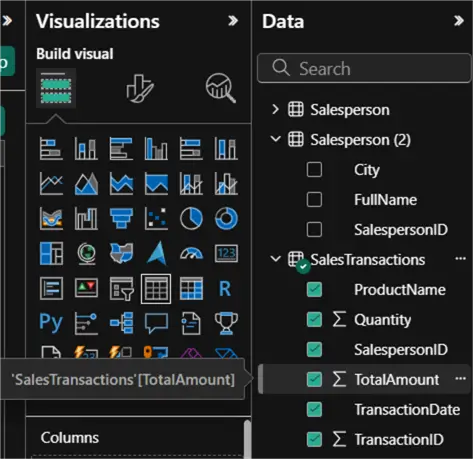
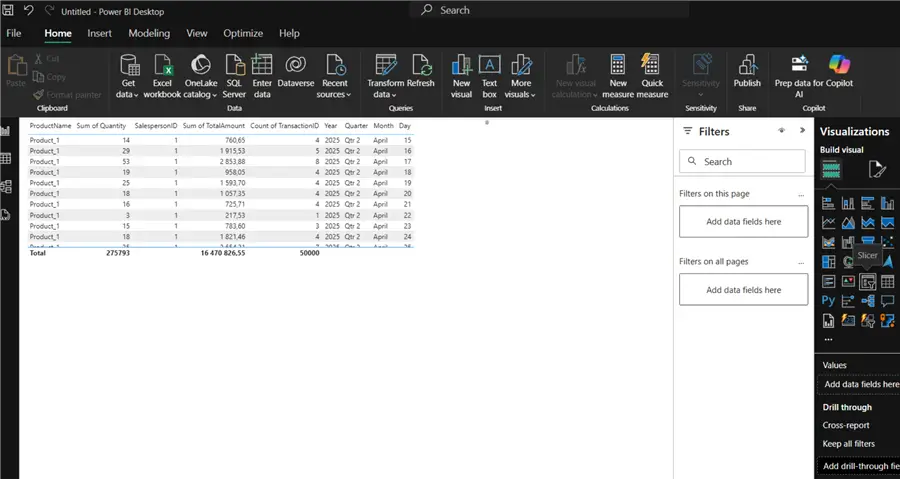
To begin analyzing the performance of the Import mode, add a Table visual on the Visualizations pane on the right of the report, then add the following data from the SalesTranactions table:
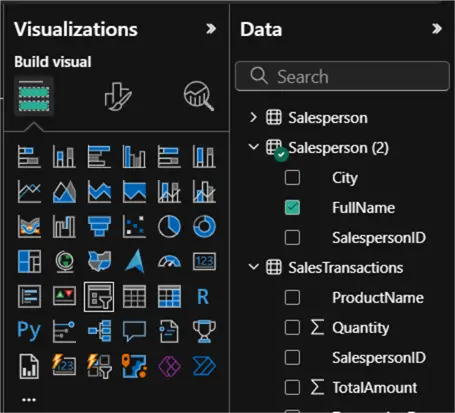
Next, select the Slicer visual and add data (FullName) from Salesperson table:
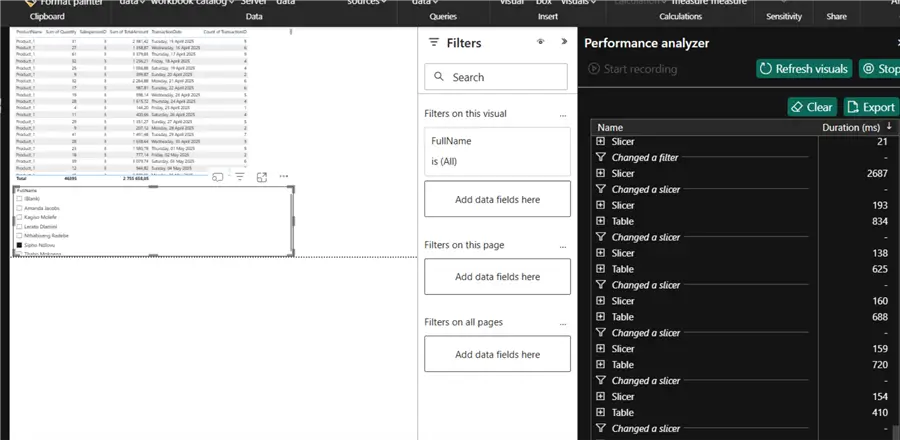
To check the performance of the imported models, click the Optimize tab on the top ribbon, select Performance Analyzer, and click Start Recording. Once active, and you make changes to your report, you will see the time it takes for the reports to respond and the time for a refresh:
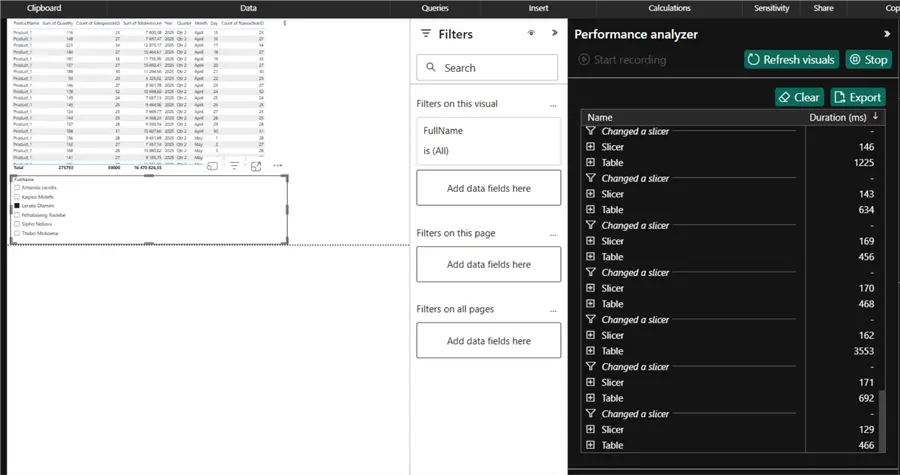
The performance analyzer checks the time it takes for the visuals to refresh when you filter or interact with them. In this instance, you will be using the Slicer to filter data on the Table and recording the refresh time. On average, the Slicer takes around 150 ms to refresh and the Table takes about 540 ms to refresh.
Comparing Performance
On average, the Slicer in DirectQuery mode takes 160 ms to refresh, while the Table takes about 660 ms to refresh.
Compared to 150 ms and 540 ms, respectively, using Import mode, the Import mode outperforms the DirectQuery when it comes to refresh time. These results are from databases with 50000 rows of data. As the data increases, the difference will only get bigger.
The Import mode performs better because it stores the data model in-memory and runs queries to its Power BI query engine compared to DirectQuery which runs queries against the SQL Server every time.
Sharing Reports
Reports are shareable and the effectiveness of the sharing depends on how the reports are shared with others. Everyone has their individual user storage. Here are the options:
- Power BI Services: This is when you publish a report to the Cloud Power BI service. It will store your .pbix file (full report) in a cloud workspace. Everyone who has access to the workspace can use the same model. There is no need to store any data locally or duplicate it.
- Power BI Desktop Sharing: This is when you send other users the .pbix file, and they open it manually on their Power BI. This forces every user to duplicate the report locally.
- Dedicated In-house Server: Another option is to store the original .pbix file on the in-house server. Then users on the network can access the report view in a browser.
Here are some key differences when sharing reports with Import mode vs. DirectQuery:
| Aspect | Import mode | DirectQuery mode |
|---|---|---|
| Data location | Stored in .pbix file. | Stored in SQL Server. |
| How users view report | Viewing data from a static snapshot (last refreshed). | Runs live queries against SQL Server with every interaction. |
| Performance | Fast, because it uses in-memory VertiPaq. | Slower, because it runs external queries and heavily depends on the SQL Server performance. |
| Storage cost | Consumes Power BI storage quota. | Uses minimal Power BI storage (doesn’t store data). |
| Refresh needs | Scheduled refreshes needed. | No refresh needed. |
| Access requirements | No extra access is needed for users in the workspace or with the original .pbix file. | A gateway or managed identity. |
Storage Limits
Storage limits are set according to the plan selected:
- Power BI Pro per User: Each Power BI Pro user gets 10 GB of total storage in the Power BI service (cloud workspace) and 1 GB dataset memory limit in Import mode. This 10 GB includes all datasets, reports, dashboards, and other artifacts the user owns.
- Power BI Premium per User: Each Power BI Pro user gets 100 TB of total storage and 100 GB dataset limit.
- Power BI Premium per Capacity: Enterprise-level capacity that is shared among many users.
Report Security
Security in Power BI revolves around row-level security (RLS), data source permissions, and workspace access.
- Row-level Security: Define roles in Power BI Desktop, which helps grant or deny access for users at the row level. This feature only works on users with Viewer permissions to a report, not admins, members, or contributors.
- Data Source Permissions: For data pulled via Import mode, the SQL credentials are needed once for a secure connection, while the DirectQuery constant queries require locally stored SQL credentials, cloud services (OAuth/AD Azure) or On-Premises Data Gateway for On-Premises SQL Server.
- Workplace Access: This is the collaborative container for everyone involved in the project and has predefined permissions for different roles:
- Admin (full control).
- Member (can edit).
- Contributor (can create content).
- Viewer (can only view reports).
Composite Models vs. Dual Mode in Power BI
The best way to get the best of both worlds (DirectQuery and Import) is to use them both in reports. There are two ways to mix data connectivity:
- Composite Models: Enable the combination of the DirectQuery and Import data connectivity in the same report. With this option, the user chooses which data is connected via DirectQuery or Import mode.
- Dual Mode Table: These are tables that can act as both DirectQuery and Import mode. Power BI will select a mode automatically depending on the query.
These dynamic options help in instances where there are tables that constantly change and require a real-time refresh, as well as static tables on the same report or dataset.
Conclusion
How you connect your dataset source in Power BI impacts the performance and quality of your reports. This becomes more prevalent as data grows, leading to reports becoming unusable and eventually stagnant.
Power BI supports multiple dataset sources, like Excel, Dataflows, SQL Server, and even CSV. This article focused on the use of a SQL Server as a dataset source, which can run in two different modes. Understanding your use case is important when choosing the best mode to use.
The most frequently used mode in corporations is the Import Mode because it is fast, supports all DAX functions, and can work offline, ultimately making it more reliable.
Next Steps
- Learn how to Load SQL Server Data using Python and an API with Power BI Reporting.
- Here are some Power BI Mistakes to Avoid – Part 2.
- If you are new to Power BI, you can go through this Microsoft Power BI Training.
- Dive deeper following this Power BI Quick Reference Guide.

Levi Masonde is a developer passionate about analyzing large datasets and creating useful information from these data. He is proficient in Python, ReactJS, and Power Platform applications. He is responsible for creating applications and managing databases as well as a lifetime student of programming and enjoys learning new technologies and how to utilize and share what he learns.
- MSSQLTips Awards:
Trendsetter (25+ tips) – 2025 | Author of the Year Contender – 2023 | Rookie of the Year Contender – 2022


Hi Levi, great article.
Just to add one more restriction that could drive companies towards Import mode is restriction of 10 active connections per data source. This could effectively become a showstopper where multiple users access different reports via direct query and could block out other users due to connection limits.