Problem
As data engineering and report development backlogs grow within IT teams, business teams are taking matters into their own hands. This is done by upskilling and building their own data and analytics solutions to generate business value quickly. Oftentimes, this results in the divergence of centralized IT teams into decentralized business teams. This is giving rise to the Analytics Engineer tasked with bridging the needs of both IT and the business.
With the advancement of agentic and Copilot-based AI capabilities in unified data and analytics platforms like Microsoft Fabric and Databricks, functional business analytics teams have extended their roles. These roles include report development, data modeling, advanced analytics, and light ELT work, traditionally owned by BI Development and Data Engineering within IT. This modern shift has given rise to the Analytics Engineer, a more versatile Data and Analytics team member whose job description extends beyond traditional BI development boundaries. The rise of AI and out-of-the-box developer self-service technologies, like Copilot and GenAI, has empowered the new modern Data and AI Analytics Engineers to deliver business value quickly by understanding how to use the tools available to them. Analytics Engineers are seeking to better understand how they can leverage Copilot to support their roles.
Solution
Microsoft’s recent announcement, Copilot and AI capabilities becoming available for all Fabric SKUs, is a shift from its previous barrier to entry at the F64 premium capacity. This empowers all Analytics Engineers, regardless of their enterprise’s size, to benefit from these Copilot capabilities to quickly deliver data and analytics value to their businesses. They can deliver value with Copilot and AI capabilities in unified data and analytics platform, including Databricks and Fabric.
This tip will begin by describing the skills and responsibilities required of the Analytics Engineer. Then demonstrate how to get started with several Copilot and AI features that support Analytics Engineering.
Skills and Responsibilities of an Analytics Engineer
This introductory section is intended to fundamentally define the skills and responsibilities of the Analytics Engineer. An Analytics Engineer acts as a bridge between IT and business, ensuring efficient data modeling, transformation, and the generation of insights. This hybrid role complements Data Analysts and Data Engineers by focusing on structured, scalable analytics solutions. Key skills include expertise in Power BI, DAX, SQL, PySpark, and dbt, along with strong knowledge of semantic modeling, cloud platforms, and real-time data processing.
Responsibilities typically include:
- Developing and managing semantic models, warehouses, and lakehouses.
- Creating Power BI dashboards.
- Collaborating with stakeholders across IT and business.
- Securing analytics assets.
- Assisting in data ingestion and transformation.
- Optimizing data pipelines.
- Supporting scalable architectures.
Different applications, platforms, and technologies define the skills of an Analytics Engineer uniquely, but most agree on their basic skills and responsibilities. Microsoft Fabric, for example, has several role-based certifications. These certs include the Power BI Data Analyst, Fabric Analytics Engineer, and Fabric Data Engineer. The Analytics Engineer sits in-between the Data Analyst and Data Engineer. Since these three roles have similar skills and responsibilities, an Analytics Engineer could also support Data Analysis and light Data Engineering work. This paints them into a hybrid role with highly desirable skills to fit into either Business or IT orgs.
This modern Analytics Engineer possesses the skills of the Data Analyst, BI Developer, Data warehouse Developer, and Data Engineer in addition to governing and administering the unified analytics platform. A brief comparison of the roles and responsibilities, along with how they blend into the Analytics Engineer, can be seen in the following figure.
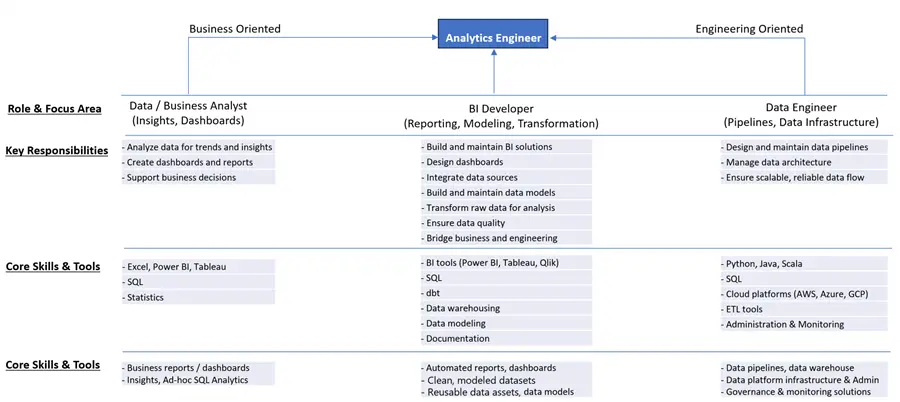
Analytics Engineers are the evolution of BI Developers. They simplify workflows by combining the responsibilities of multiple niche roles, such as SQL/Python Developers, EDW Developers, Business/Data Analysts, Data Modelers, and ELT Developers, into one adaptable position. They enhance collaboration by bridging technical and analytical teams while ensuring data is analysis-ready and consistently structured. Most notably, this role improves efficiency, scalability, and accessibility, aligning directly with modern business needs.
Getting Started with Copilot for Analytics Engineering
Now, with a strong foundational understanding of the skills and responsibilities of the Analytics Engineer, let us explore Copilot capabilities that an Analytics Engineer can use to build an end-to-end workflow, including building pipelines, transforming data, reviewing code, creating dashboards, and gaining insights on enterprise data. Please note that this section will specifically focus on the Copilot capabilities within the Azure and the Microsoft Fabric platform. Ensure that your Fabric administrator verifies that Copilot is ‘Enabled’ in your Fabric Tenant.
Step 1: Create Resilient Data Pipelines
Copilot in Microsoft Fabric can enhance ETL and data engineering workflows by enabling natural language-driven pipeline creation, transformation, and troubleshooting. It allows users to describe their desired data pipeline, then Copilot generates the necessary activities automatically.
Its key capabilities include:
- Pipeline Generation The user can define pipelines using text prompts or images, and Copilot will build the required data integration steps.
- Error Troubleshooting: Copilot provides clear error explanations and actionable recommendations for fixing pipeline issues.
- Pipeline Summarization: It can generate summaries of complex pipelines, detailing relationships between activities.
- Data Transformation: In Dataflow Gen2, Copilot assists with query generation, transformation steps, and explanations of applied logic.
To get started, you must create a Dataflow Gen2 or Data Pipeline and then interact with Copilot through the chat pane to automate tasks. Learn how to use Copilot for Data Factory: What is Copilot in Fabric in the Data Factory workload?.
Step 2: Write Efficient and Complex Code
Copilot can generate SQL, Python, DAX, PySpark, and more to assist in writing optimized queries and transformations. Here are some Copilot features that are available for code generation:
Python & PySpark in Fabric Data Science & Data Engineering Notebooks
- Chat-magics: A Python library that integrates with Fabric notebooks, enabling instant query and code generation with commands like
%%chatfor insights and%%codefor data transformations or visualizations. It also provides privacy controls and debugging tools. Learn how to get started: Overview of chat-magics in Microsoft Fabric notebooks (preview). - Chat Panel: An interactive AI assistant for Lakehouse tables, Power BI datasets, and Spark/Pandas dataframes. Users can ask natural language queries, request data transformations, and get recommendations for visualizations, error explanations, and fixes. Learn more: Use the Copilot for Data Science and Data Engineering chat panel (preview).
T-SQL in Fabric Data Warehouse
- Code Completion: Intelligent T-SQL code completion in the Data Warehouse workload offers context-aware suggestions, autocomplete for queries, and comment-based query generation to enhance productivity and reduce errors. Learn how to get started with code completion: How to Use Copilot code completion in Fabric in Data Warehouse (Preview).
- Explain and Fix Query: Quick Actions in the Data Warehouse workload enables users to explain and fix SQL queries efficiently. The Explain action provides inline comments and a summary to clarify query logic, while the Fix action automatically corrects syntax errors based on execution results. These features accelerate productivity by helping users understand and troubleshoot queries faster. Learn more about this feature: How to use Copilot quick actions in Fabric in Data Warehouse (Preview).
DAX in Power BI
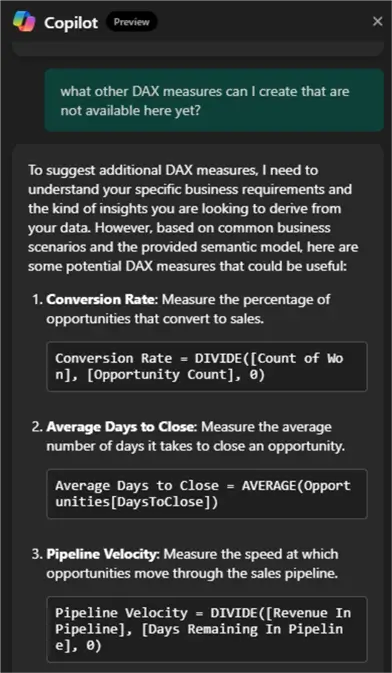
- DAX Query Generation: Copilot can help write and modify DAX queries in Power BI semantic models using natural language prompts. Users can request calculations, aggregations, or data filtering, as shown in the following figure, and Copilot will generate optimized DAX code.
- Explain DAX Queries and Functions: Copilot can analyze existing DAX queries and provide detailed explanations, helping to understand logic and improve models. It can also suggest the best DAX functions for specific use cases.
- Conversational Query Updates: Users can refine DAX queries by making conversational requests, allowing Copilot to adjust measures, columns, and calculations dynamically.
Learn how to get started with all these Copilot Power BI DAX features: Write DAX queries with Copilot.
Step 3: Chat with Data & Gain Insights
After ingesting and transforming your data, you can create a Fabric data agent to support conversational AI experiences with data stored in lakehouses, warehouses, Power BI semantic models, and KQL databases, allowing you and your stakeholders to ask questions in natural language and receive insights about your data. Please see Microsoft’s step-by-step instructional on how to Create a Fabric data agent.
You can create a data agent by selecting data sources, configuring permissions, and enabling Copilot for natural language queries. The agent will translate your questions into structured queries to retrieve and present responses in an interactive format. For example, you could leverage Copilot to support the following:
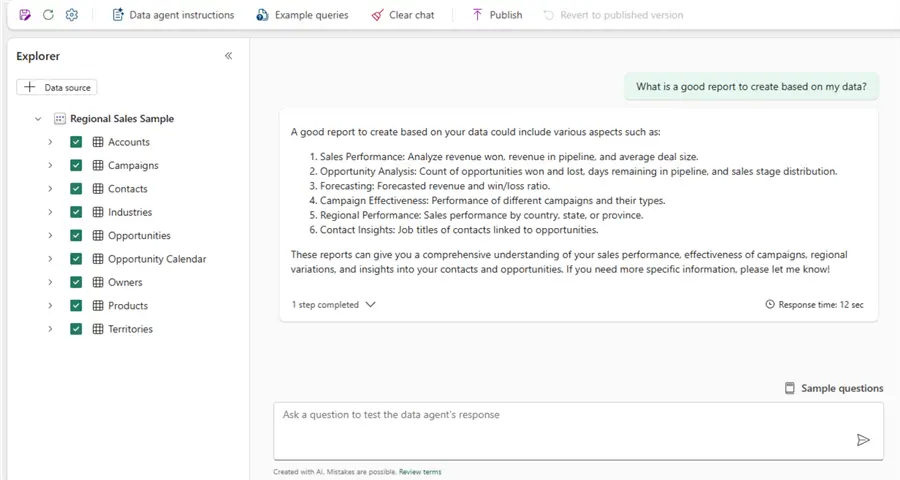
Identify Insightful Reports to Create
With Copilot having access to enterprise data, you can use it to help identify insightful reports to create.
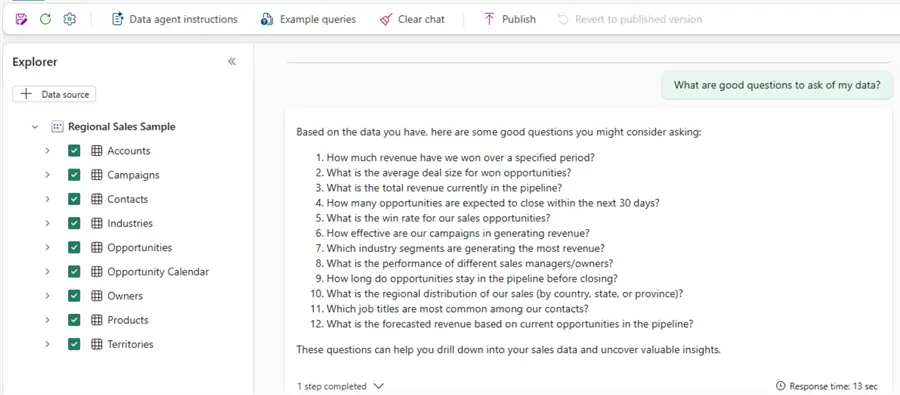
Understand Data Better
Copilots can also assist with identifying good questions to ask of your data.
Step 4: Create and Summarize Reports
Copilot enhances report and dashboard creation by enabling natural language-driven insights, automated report generation, and interactive data exploration. Here are some key capabilities.
Automated Report Creation
Copilot assists in building reports by recommending fields, measures, and layouts based on user intent, improving efficiency and transparency in report generation. Additionally, users can refine reports by making conversational requests, allowing Copilot to adjust visuals, filters, and calculations dynamically. Learn more: Create reports in the Power BI service with Copilot.
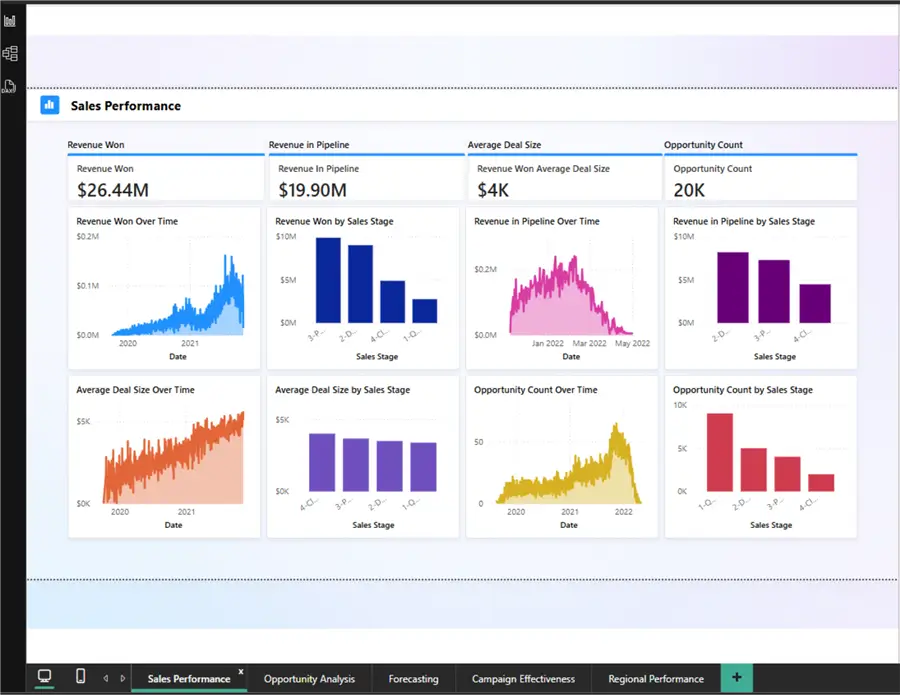
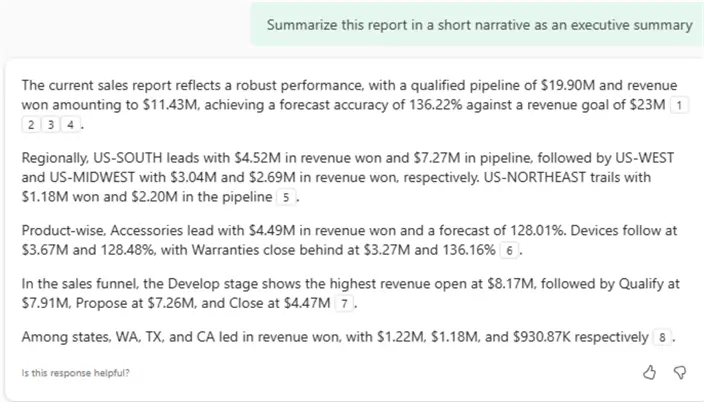
Report Summarization
Copilot can generate summaries of Power BI reports in the PBI service using smart narrative visuals, as shown in the figure below, helping users quickly understand key insights. Learn more: Summarize a report with Copilotot.
Ask Questions About Your Data Model
Users can interact with Copilot to ask questions about report visuals, retrieve specific data points, and explore semantic models dynamically. Learn more: Ask Copilot for data from your model.
Subscribe to Report Summaries
Copilot in Power BI allows users to include AI-generated summaries of report pages or full reports in email subscriptions, providing key insights automatically. Learn more: Create report subscriptions with Copilot summaries in the Power BI service (Preview).
Next Steps
- Read this interesting tip about Power BI Artificial Intelligence Possibilities – MSSQLTips.com
- Fabric data agent creation (preview) – Learn how to create a Fabric data agent | Microsoft Learn
- Read more about what dbtLabs considers to be Analytics Engineering: What is analytics engineering? Transform data for better insights | dbt Labs
- Consider getting certified: Microsoft Certified: Fabric Analytics Engineer Associate – Certifications | Microsoft Learn
- Learn how to Connect to AI Insights in Power BI Desktop – Power BI | Microsoft Learn
- Learn about Copilot for Real-Time Intelligence (nl2kql) – Microsoft Fabric | Microsoft Learn
- Explore Lovable, an AI-powered platform that enables users to create applications and websites by chatting with AI, allowing non-technical users to build software without coding.
