By: Siddharth Mehta | Comments (4) | Related: > Reporting Services Performance
Problem
SSRS provides a very user friendly way to author and deploy reports. These reports can be accessed from different platforms where the reports are deployed - reports manager, SharePoint, stand-alone / distributed applications or programmatically using SSRS SOAP endpoints. Unfortunately, SSRS / BIDS does not provide any high-end debugging tools such as SQL Profiler for analyzing the performance of SSRS reports. In this tip we will look at different ways of debugging and analyzing SSRS reports performance using execution logs and freeware tools.
Solution
Two of the main areas which can provide insight into the performance of a report are SSRS reports execution logs and a Web proxy. The execution logs is pretty obvious, but you maybe wondering why a web / http proxy. SSRS Reports are mostly deployed on a platform like SharePoint or are accessed by applications over the network. Often it may be that the hosting platform or the network bandwidth is the cause of the performance bottleneck. Analyzing the entire life of the report execution along with the type of content exchanged between the client and server can provide details of each activity that happens during the report execution.
Execution Logs
SSRS provides a set of standard views to query the report execution logs. You will find three execution log views in the ReportServer database. If you are using SSRS 2008 R2, you should use view "ExecutionLog3", because the rest of the views are for backward compatibility.
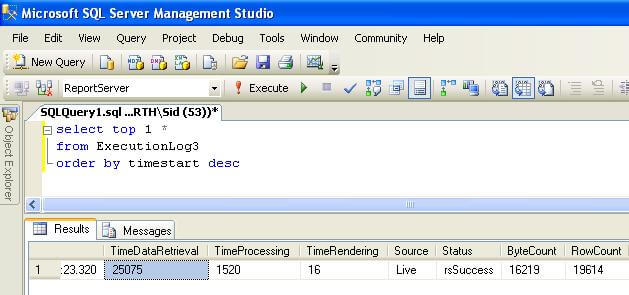
Let's go through an example to better understand this mechanism. I have created a report and intentionally configured the stored procedure query to wait for 25 seconds.
Now log on the "ReportServer" database and query the ExecutionLog3 view and you should be able to find the statistics of the report just executed. The below screenshot shows the statistics of the report I executed on my machine. If you look carefully at the "TimeDataRetrieval" field, you will see the time taken for retrieving data is approx 25 seconds which is just what I had configured in my stored procedure. TimeDataRetrieval + TimeProcessing + TimeRendering should be almost equal to the actual time taken for the report request. You can learn more about each of these fields here.
As far as debugging and analyzing a single report, this mechanism is okay. But if you want to analyze a huge volume of reports on your report server, manually analyzing the logs for each report is time consuming and inefficient. Some framework that automates this process is required. Fortunately, you do not need to develop it from scratch, because on Codeplex there are two such frameworks that are available:
- Server Management Report Samples
- SCRUBS : SQL Reporting Services Audit, Log, Management and Optimization Analysis
Web / HTTP Proxy
Every application that gets accessed over the network using HTTP or HTTPS as the communication protocol, needs a web proxy sooner or later for request and response analysis over the network. One such great FREE web proxy tool is Fiddler.
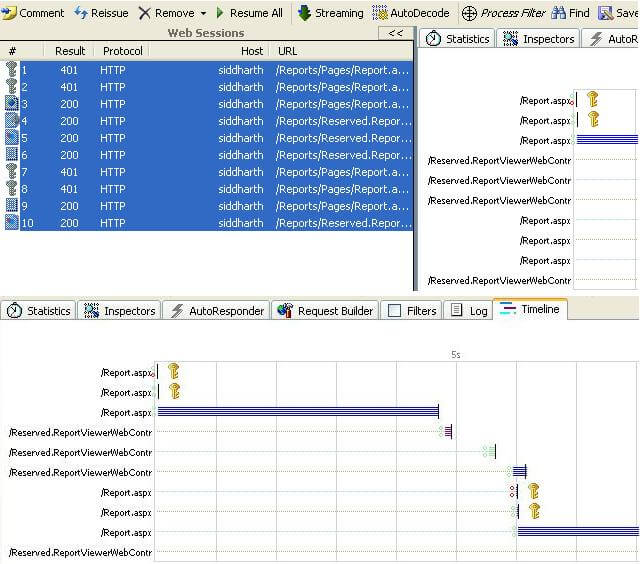
Download and install Fiddler. Now execute your report from reports manager and check out how Fiddler profiles the exchange between the client and server. It has a view that is of very high value for the report analysis - the "Timeline" tab. This tab shows which content took what time to download and render. Many times you will find that report execution took little time, still the report is taking a long time to render. You can analyze the traffic using Fiddler and you might end up with the observation that a huge ".gif" file which is a part of the report takes a long time to download and render, which causes the report rendering to be slow.
Below is a screenshot of the timeline analyzed by Fiddler for the report I executed. You can make out that the timeline shown here is similar to what is shown in the ExecutionLogs. The difference here is that it shows which content and request took what amount of time. There is a lot more analysis that you can do with Fiddler, and I leave it up to the reader to explore this tool as per their needs.
Next Steps
- Install the suggested frameworks to analyze your SSRS reports execution logs.
- Install Fiddler and check out poorly performing reports to narrow down the point where report execution takes longer than expected.


About the author
 Siddharth Mehta is an Associate Manager with Accenture in the Avanade Division focusing on Business Intelligence.
This author pledges the content of this article is based on professional experience and not AI generated.
View all my tips
