By: Daniel Calbimonte | Comments (8) | Related: > Analysis Services Tutorials
Problem
Sometimes we need to access a SSAS cube using Excel. In this tip we will show how to:
- Access SSAS with Excel
- Add Dimensions to a cube in Excel
- Work with SSAS KPIs in Excel
- Add SSAS Named Sets in Excel
- See the MDX Query that Excel creates
- Create new calculations using Excel
- Find Multidimensional Members
Solution
Requirements
In order to start we are going to use the AdventureworksDW 2012 Database and the AdventureWorks 2012 Project that can be downloaded here: http://msftdbprodsamples.codeplex.com/releases/view/55330
We will also use the OLAPExtension for Excel for this demo: http://olappivottableextend.codeplex.com/
I used Excel 2010 and SQL Server 2012 for this demo, but most of the features displayed apply to Excel 2007 and SQL Server 2005/2008/2008 R2 as well.
Access SSAS using Excel
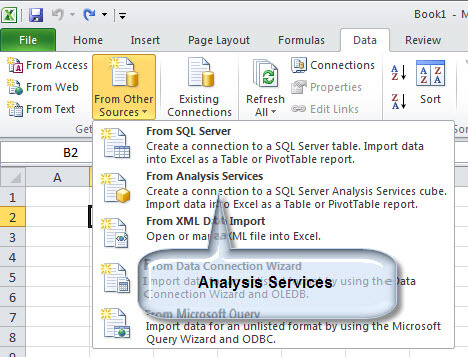
In order to connect from Excel to SSAS in Excel go to File > Data and select From Other Sources. After that, select the From Analysis Services option. What we are doing is connecting to a Multidimensional SSAS Database using Excel.
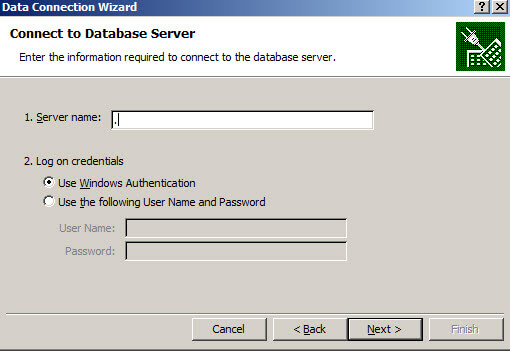
Enter the name of the server and the authentication where the Analysis Server is installed.
Select the database, in this case we are using Adventure Works.
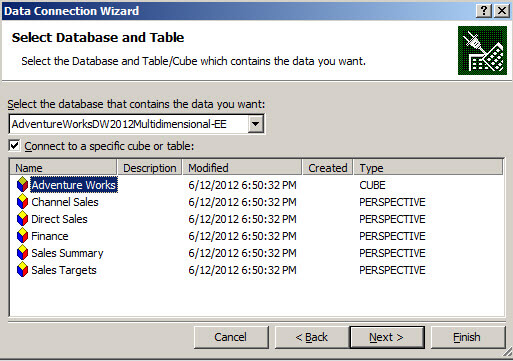
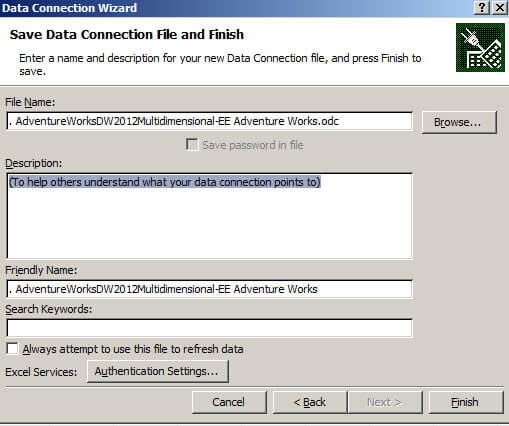
Finally, press Finish.
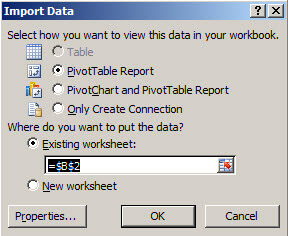
Select the Import Data option and import to an existing worksheet:
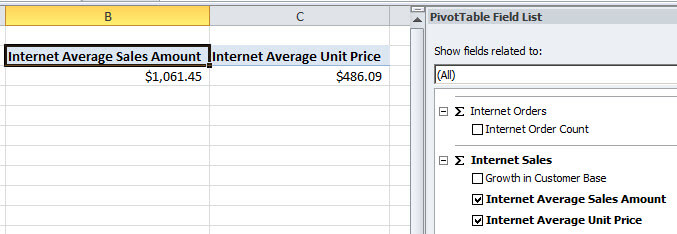
This sample shows the sales statistics of the fictional company AdventureWorks. Let's click the Internet Average Sales Amount and the Internet Average Unit Price of the company in Excel.
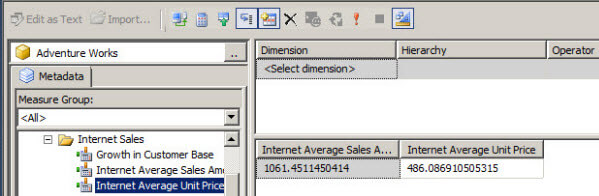
If you are familiar with the Business Intelligence Development Studio (BIDS) or the SQL Server Data Tools (SSDT), the results are the same when you drag and drop the Measures to the Cube Browser:
Analyze SSAS using Excel directly from SQL Server Data Tools (SSDT)
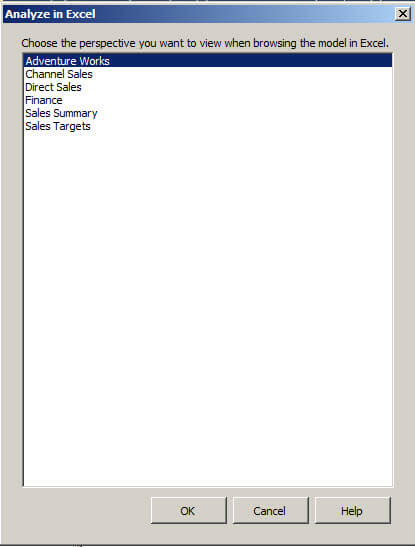
In SQL Server Data Tools (SSDT), you also have an icon to open your SSAS project directly in Excel without the need to execute steps 1 - 5. Click on the Excel button as shown below
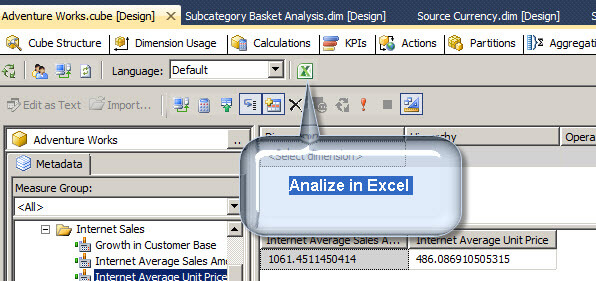
and select the Adventure Works cube.
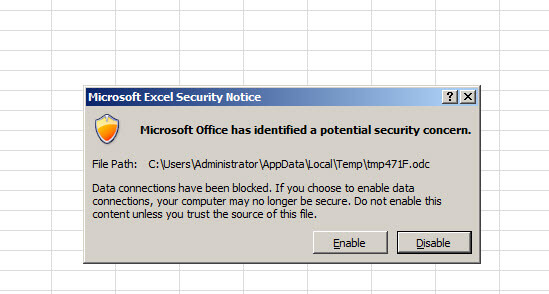
You will get a Microsoft Excel Security Notice, so press Enable to allow access.
Add Dimensions to a Cube in Excel
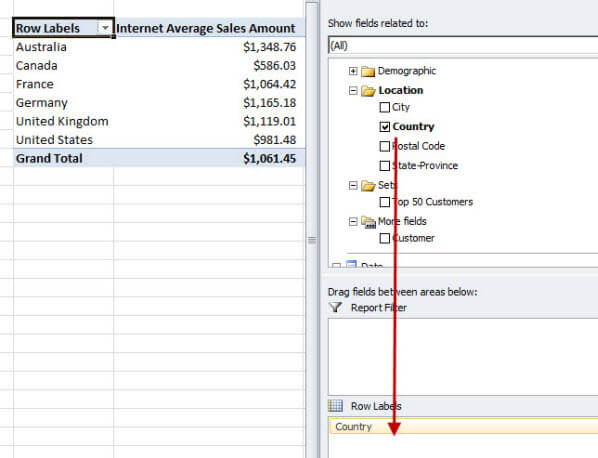
In Excel, if you want to see the Internet Average Sales per country, go to Customer > Location and drag the country to the Row Label.
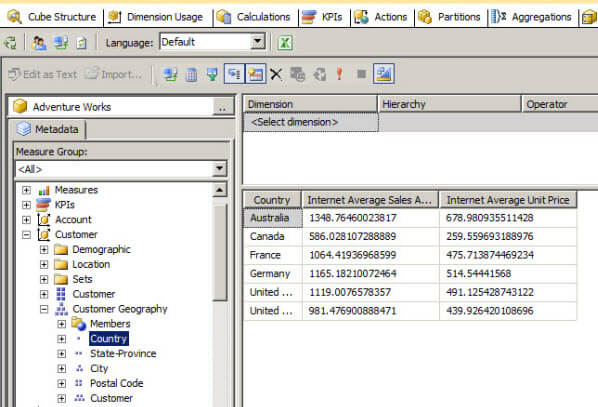
In SSDT, to do the same, go to Customer > Customer Geography and drag and drop the country dimension in the Browse tab.
Work with SSAS KPIs in Excel
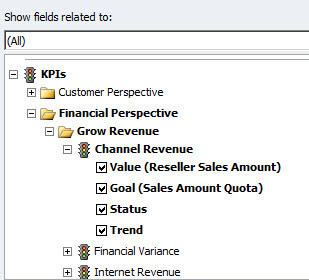
In Excel there is a KPI to display the Goals of the company and the current Values in the company. There is also a Status and a Trend icon. Check the options shown below to see these.
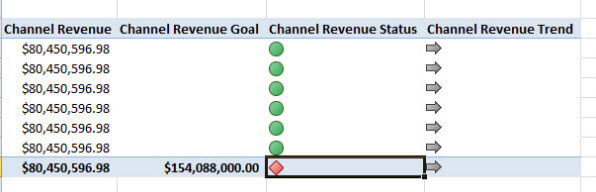
You will see in Excel, that the revenue is $80,450,596 and the Goal was $154,088,000, so the Channel Revenue Status is red because the goal was not met. Also, we can se that the Trend is positive by the direction of the arrow.
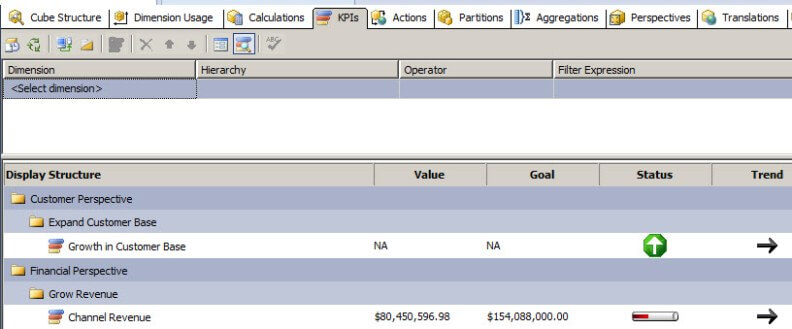
In SSDT, in the KPIs Tab, you can see the same options.
Add SSAS Named Sets in Excel
In In the PivotTable Tools go to Fields, Items, & Sets. With named sets you can create filters by row, column or create your own MDX to create filters.
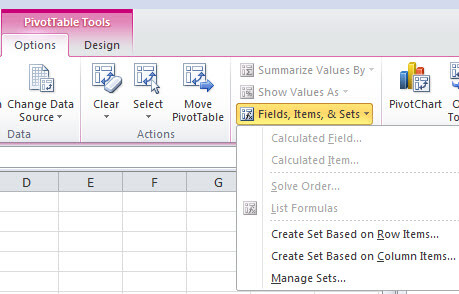
If you create, for example, a Set Based on Row Item you can add or remove rows and columns using MDX internally.
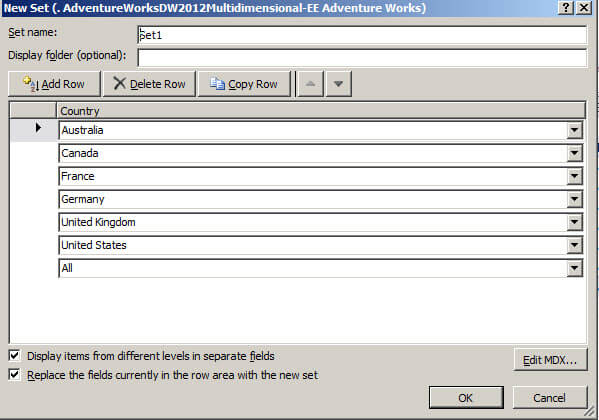
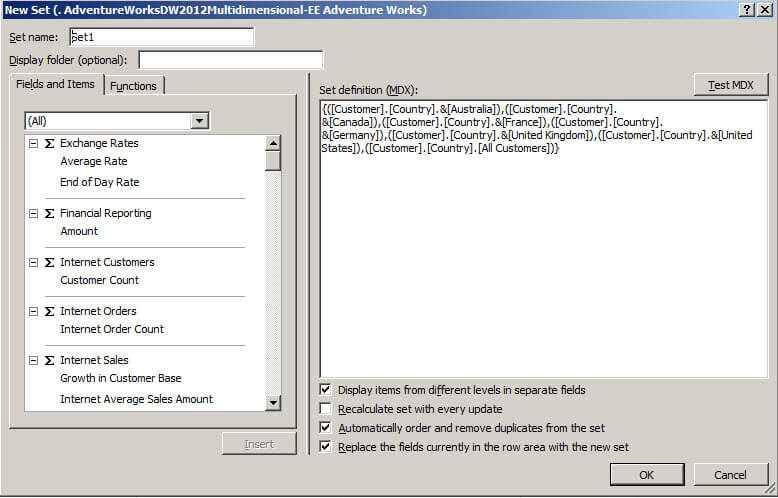
You can also press the Edit MDX button to edit or customize your set of data.
See the MDX Query that Excel Creates
Let's be honest, nobody really likes to write MDX. Is there a way to see the MDX query that Excel created?
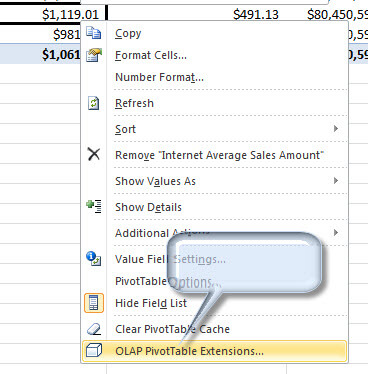
The answer is yes. You need to add the Excel Extension mentioned in the requirements at the beginning of the article (or here). This Extension gives you a new option in Excel to see the MDX. The option is OLAP PivotTable Extensions as shown below.
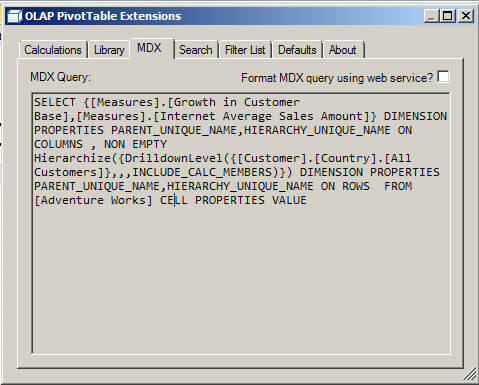
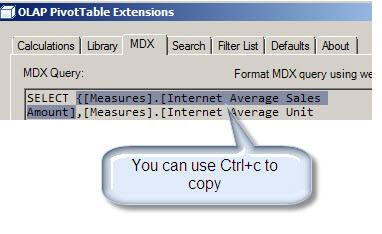
You can see the MDX Query and verify the query generated.
How to Create Calculations Using Excel
Let say that we have the Internet Average Sales in dollars, but we want to calculate the Average Sales in Euros with the current value. Is there a way to create a SSAS calculation in Excel?
Yes, you can copy measures from the MDX tab with Ctrl+C
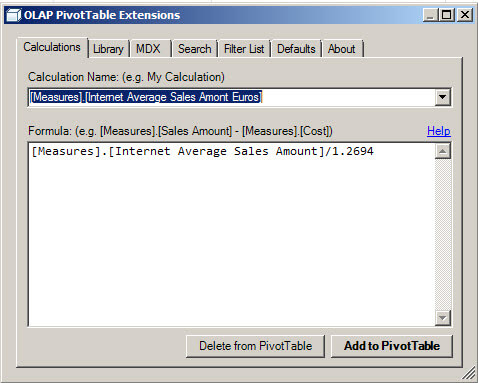
And create a Calculation with the OLAP PivotTable Extension. You just need to add the name and the calculation. In this example I am transforming dollars to Euros from the value 1.2694 Dollars = 1 Euro. Finally add this to the Pivot Table and you will have the calculation in Excel.
Find Multidimensional Members
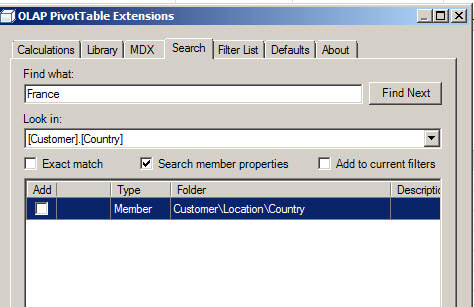
Finally, you can find members and folders of the multidimensional database. For example, if we go to the search Tab and find France, it finds the folder where it is stored.
Next Steps
It this demo we learned how to connect to SSAS with Excel and create filters, named sets, and work with KPIs. You can find even more information and OLAP extensions in the links below:
- SSAS extensions
- OLAP Excel Pivot Table
- Excel 2007 Document: Designing SQL Server 2005 Analysis Services Cubes for Excel 2007 PivotTables
- Overview of Online Analytical Processing (OLAP)


About the author
 Daniel Calbimonte is a Microsoft SQL Server MVP, Microsoft Certified Trainer and 6-time Microsoft Certified IT Professional. Daniel started his career in 2001 and has worked with SQL Server 6.0 to 2022. Daniel is a DBA as well as specializes in Business Intelligence (SSIS, SSAS, SSRS) technologies.
This author pledges the content of this article is based on professional experience and not AI generated.
View all my tips
