By: Scott Murray | Comments (1) | Related: > Analysis Services Development
Problem
I recently used the SSAS TopCount feature to get the top 10 list of products within my products cube. How can I create a dynamic single rollup for the rest of the values, i.e. an All Other values, so that my total sales number is the true total and not just the top 10?
Solution
This question came out of question that was posed to me recently. The powerful topcount and bottomcount and toppercent and bottompercent features were covered in my recent tip, http://www.mssqltips.com/sqlservertip/3034/sql-server-analysis-services-ssas-2012-top-and-bottom-functions/. Certainly if you are wanting just the top 10 or bottom 10 items in particular dimension, those functions work very well. However, you often will be asked to provide not only the top 10 values, but also all the other values rolled up as a single line. In essence, the data users still want to still the grand total, but only want to see the significant values and then roll the remaining insignificant value as one row. Furthermore, maybe you want to see the average of the top 10 values. For this tip we can cover how to implement these results by utilizing various MDX functions including the topcount / toppercent functions.
Top N plus All Other in SSAS
In order to implement a TopCount N plus "All Other" methodology, we need to create several parts of the query including a named member set and a named measure. The select portion of the query then pulls in each of these items in the set and unions them together with a single calculated measure value. In order to fully describe the entire process, we will again use AdventureWorks 2012 SSAS database; the database and SSAS database are available on Codeplex at: http://msftdbprodsamples.codeplex.com/releases/view/55330. Once you download and install the databases, open up Management Studio and connect to the Analysis Service database. Next create a new MDX query. For this example, the cities attribute of the geography dimension will be used.
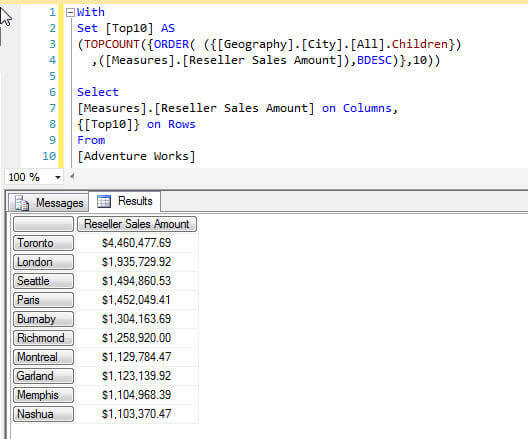
The first step in creating our query is to design our top 10 set as describe below. In the below example, we first name the set Top10; next we specify the TopCount function and then the Order function. The Order function uses the BDESC argument to sort the set in descending order by the Reseller Sales Amount; further the BDESC option tells the ordering to "break" any embedded hierarchies and rank all the values as if they were each an individual value irrespective of any hierarchies. Finally, the 10 near the end of the statement designs the set as only the top 10 values by Reseller Sales Amount.
With
Set [Top10] AS
(TOPCOUNT({ORDER( ({[Geography].[City].[All].Children}),
([Measures].[Reseller Sales Amount]),BDESC)},10))
Using this set in a simple query is shown in the subsequent screen shot:
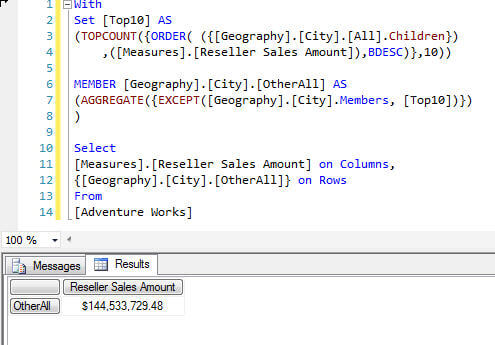
Our next step is to add a second calculated value as a calculated measure. The measure will need to calculate the total amount for all of the values except the top 10 values in the previously created set. Note this expression creates a single calculated measure and not a set. In the below example, we create the Top 10 set and then use it as an input for the calculated measure. The calculated measure uses several components to get the end result. First, the except function is utilized. The except function takes 2 arguments: the set you would like to use and then what to exclude from the set. The second component is the aggregate function which allows us to create, in essence, a calculated measure to add up the All Other values.
With
Set [Top10] AS
(TOPCOUNT({ORDER( ({[Geography].[City].[All].Children})
 ,([Measures].[Reseller Sales Amount]),BDESC)},10))

MEMBER [Geography].[City].[OtherAll] AS
(AGGREGATE({EXCEPT([Geography].[City].Members, [Top10])})
)

Select
[Measures].[Reseller Sales Amount] on Columns,
{[Geography].[City].[OtherAll]} on Rows
From
[Adventure Works]
The aggregate function actually provides us with the flexibility to not only sum the values in our set, but we could also use the aggregate function to compute any of the following aggregate operations:
- Sum
- Count
- MIN
- MAX
- Distinct Count
Using the above query results in the following results. In this example the aggregate sums up all the values for the reseller sales amount except the top 10 city values by reseller sales amount.
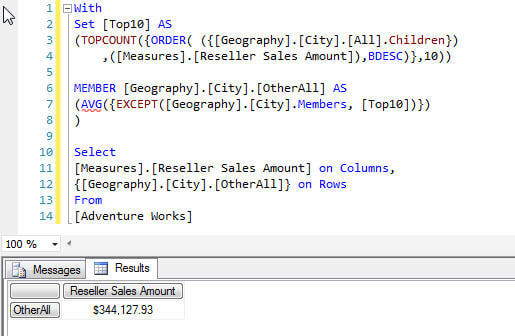
Alternately, the aggregate could be switched to the Average function, AVG, as outlined in the code snippet below.
With
Set [Top10] AS
(TOPCOUNT({ORDER( ({[Geography].[City].[All].Children})
 ,([Measures].[Reseller Sales Amount]),BDESC)},10))

MEMBER [Geography].[City].[OtherAll] AS
(AVG({EXCEPT([Geography].[City].Members, [Top10])})
)

Select
[Measures].[Reseller Sales Amount] on Columns,
{[Geography].[City].[OtherAll]} on Rows
From
[Adventure Works]
This query gives us the following average all cities not in the Top 10.
In order to complete the final part of our problem resolution, we need to union together the top 10 cities' reseller sales amounts with the All Other values rollup. The Union syntax is a bit different than SQL as outlined at: http://msdn.microsoft.com/en-us/library/ms146030.aspx. The union syntax can actually take 3 forms:
- UNION(Set 1, Set 2, ...Option "ALL")
- Set 1 + Set 2
- {Set 1, Set 2}
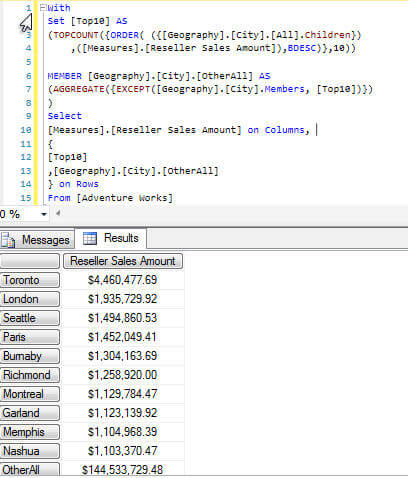
Notice how only the first syntax uses the Union key word; sharing a similarity with its SQL union function, the ALL option can be included to retain duplicate values as noted in the first syntax above. To complete our example, the following code shows the final version of our query utilizing the third union syntax.
With
Set [Top10] AS
(TOPCOUNT({ORDER( ({[Geography].[City].[All].Children})
 ,([Measures].[Reseller Sales Amount]),BDESC)},10))

MEMBER [Geography].[City].[OtherAll] AS
(Aggregate({EXCEPT([Geography].[City].Members, [Top10])})
)
Select
[Measures].[Reseller Sales Amount] on Columns,
{
[Top10]
,[Geography].[City].[OtherAll]
} on Rows
From [Adventure Works]
Now, as outlined above and with the query results displayed below, we have a query which shows our top 10 cities, plus a rollup of "All Other" cities
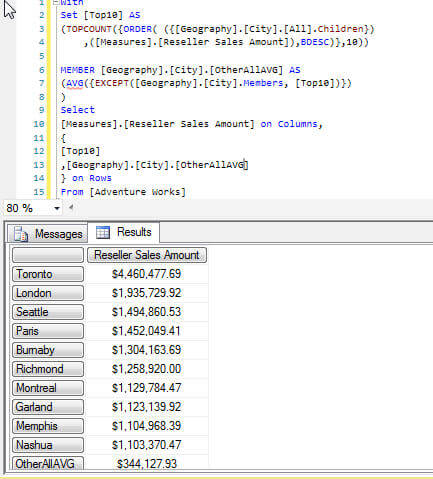
Alternatively, we could use the average function to average the "All Others" cities list.
With
Set [Top10] AS
(TOPCOUNT({ORDER( ({[Geography].[City].[All].Children})
 ,([Measures].[Reseller Sales Amount]),BDESC)},10))

MEMBER [Geography].[City].[OtherAllAVG] AS
(AVG({EXCEPT([Geography].[City].Members, [Top10])})
)
Select
[Measures].[Reseller Sales Amount] on Columns,
{
[Top10]
,[Geography].[City].[OtherAllAVG]
} on Rows
From [Adventure Works]
This query results in the top 10 list plus the average of the rest (or "All Other") of the city values. For some users, the average may be more meaningful than the All Other summation.
Conclusion
To build on the top and bottom count functionality, a common request is to build an All Other member to rollup the remaining values that are not in the top count. The process of building both the top n values plus the All Other rollup value requires several steps including creating the top n set, building a member that uses the except function to get a set of all values except the top n values and then aggregate the non top n values. Commonly, the aggregate function is used to sum up the remaining values outside of the top n set, but we could also display an average function to get the average of the remaining value. Finally, to complete the process, the top n list must be joined together with the All Other calculated member via the Union function.
Next Steps
- Except Function - http://technet.microsoft.com/en-us/library/ms144900.aspx
- Average Function - http://technet.microsoft.com/en-us/library/ms146067.aspx
- SQL Server Analysis Services (SSAS) 2012 Top and Bottom Functions


About the author
 Scott Murray has a passion for crafting BI Solutions with SharePoint, SSAS, OLAP and SSRS.
This author pledges the content of this article is based on professional experience and not AI generated.
View all my tips
