By: Fikrat Azizov | Comments (7) | Related: 1 | 2 | 3 | > Monitoring
Problem
When database based applications do not perform well, people often ask: how well are the servers doing, do we have resource bottlenecks, etc.? Many companies use different tools to collect performance data from servers. Depending on a DBA’s preferences, a typical data collection would include several dozen server and application performance metrics, collected every few seconds. Considering that some companies would need to collect performance metrics from tens or hundreds of servers and store this data for extended periods, it’s easy to predict data volumes reaching hundreds of millions of rows. The challenge for a DBA is: how to analyze these huge volumes of data quickly in order to identify server resource bottlenecks and see which counters are affecting application performance.
Solution
In this series of tips, we’ll demonstrate ways to build a centralized, integrated and flexible data collection and analysis system. We’ll use PowerShell scripts to collect performance metrics from multiple servers into a central repository database using customizable metric lists. To analyze this data we’ll build SSIS packages, which will classify performance data with predetermined performance metric thresholds and load the data into a data warehouse. Then we’ll create an OLAP cube with MDX enhancements and conditional formatting. Finally, we’ll use PowerPivot with Excel to get flexible reports based on an OLAP cube, which will allow us quickly identify problematic performance data and show trends for selected metrics.
Let's start off by demonstrating the performance reporting options to show you what the end product will look like, then let's check out the data warehouse data model and then dig into the deployment details.
SQL Server Performance Reporting Example
As you can see from the below sample report, it’s easy to spot problematic performance areas for a month, day or hour, based on the color of the cells. A threshold and critical threshold values could be assigned to each metric and the font color of the metric values would be different, depending of which threshold has been reached. In many cases it’s important to also know the duration of the bad performance, as short spikes of certain metrics could be ignored. This report highlights the background of value cells with different colors, depending on how long (in terms of percentage of time period) the threshold or critical threshold has been exceeded, as shown in the example below.
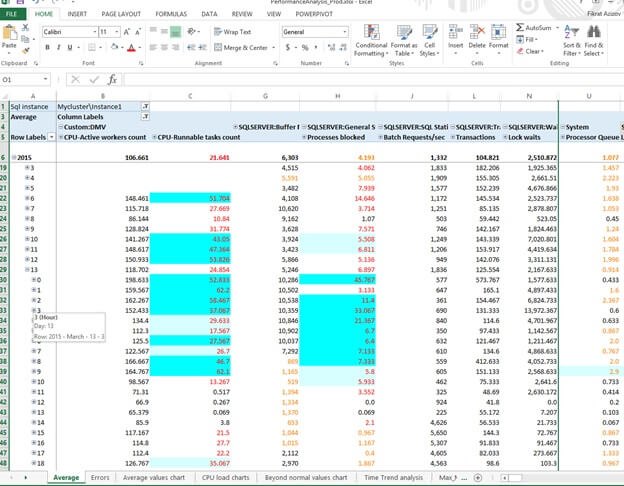
A user can easily filter the report data based on the SQL Server instance name, server name, performance metric name, metric’s instance name, etc. A user can also change the aggregation function (average, max or min).
The proposed solution allows you to collect not only standard performance metrics, but also custom calculated metrics, which could be acquired by querying SQL Server. This, in turn opens up an opportunity to include metrics measuring application throughput. This could be the number of rows inserted into table or the number of processed sales orders since the last collection.
The same functionality could also be used to collect values from certain diagnostic DMV’s running against a SQL Server instance. I've used this functionality to measure total value of 'runnable_tasks_count' field from sys.dm_os_schedulers DMV to investigate CPU pressure.
The system allows you to add/remove new SQL Server instances and performance counters dynamically then the collection scripts would pick-up the changes on the next run.
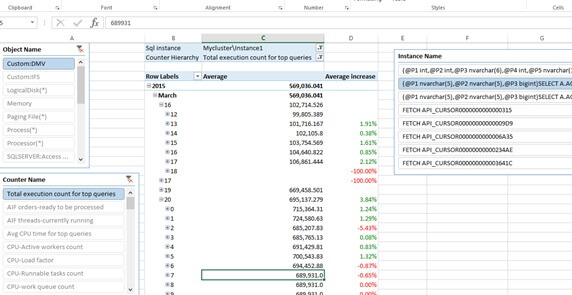
The report allows users to complete a baseline analysis by providing measures like rolling average, average for last 3 months, change rate over consecutive time periods, as shown in the sample below:
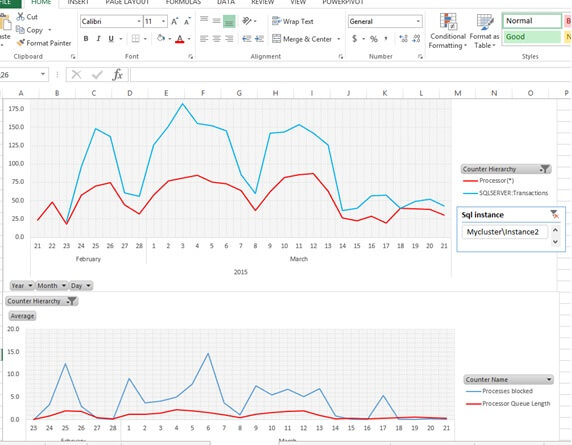
The sample below shows another type of visualization a user can build dynamically to chart corresponding metrics:
Prerequisites
This solution consists of two main parts:
- Data collection - The data collection is completed via PowerShell scripts and has been built on PowerShell 2.0, but I believe the code should work on higher versions. The data collection also requires a SQL Server 2008 or higher database to store the data. Finally, the server hosting the PowerShell scripts needs to have access to all SQL Server instances that are monitored.
- Business Intelligence - The business intelligence code was built on a SQL Server 2008 database with SSIS and SSAS. This can be easily upgraded to a higher SQL Server version. The report data can be analyzed using an Excel 2013 spreadsheet with a PivotTable or PivotChart from a user’s computer (provided the user has an access to the OLAP cube) or from a spreadsheet located on the monitoring server. Alternatively, these reports could be published on a SharePoint portal using Excel Services, allowing team members real time access to the performance reports.
In this tip I'll describe data collection process, which could be used either independently or in combination with the Business Intelligence toolset. I'll provide a detailed description of the Business Intelligence toolset in upcoming tips.
Data model
The data model consists of two databases:
- PerfCollections - All raw performance metrics
- PerfDWH - Data warehouse for the OLAP cube
I’ll provide a description of the data model for PerfDWH in an upcoming tip dedicated to the Business Intelligence part of this solution.
Below is the data model for the PerfCollections database:
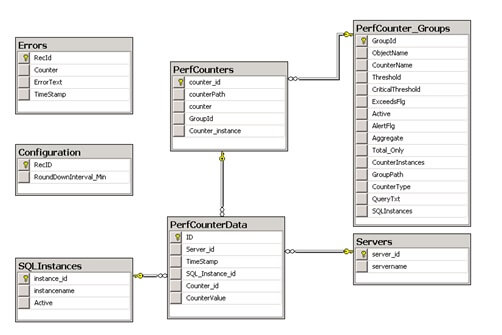
Here are short descriptions of the PerfCollections database tables:
- PerfCounter_Groups - Configuration table for the performance metrics. It contains thresholds, counter type, queries used to retrieve metrics (for non-standard performance metrics). I’ll shortly describe this table in more detail in the ‘Configuring performance collection’ section below.
- SQLInstances - Configuration table for SQL Server instances to be monitored. Centralized monitoring server should have direct access to those instances.
- Configuration - General settings, like collection time round down interval.
- PerfCounters - Low level lookup table for performance metrics, contains details related to specific counter instances. This table would be updated automatically by the PowerShell scripts.
- Servers - Lookup table for server names. This table would be filled in automatically by the PowerShell scripts.
- PerfCounterData - Contains raw performance data from multiple servers. This table would be filled in automatically by PowerShell scripts.
- Errors - Table for logging exceptions generated by the PowerShell scripts.
Deployment of SQL Server Performance Monitoring Collection Scripts
Deployment steps are as follows:
- Download the deployment package from
here and copy them into any dedicated folder.
- C:\PerfDWH\PerfmonCollection in my example.
- Open the CreatePerfCollections.sql script, change location of database files if required, execute it to create the PerfCollections database and included objects.
- Open the CreateSecurityObjects.sql script, specify the domain name, username and password to create a credential which would be used by collection jobs and execute it to create credential and proxy account for SQL Server Agent. The domain user account would need to be an administrator on a central repository server, as well as remotely monitored servers (see this article) to be able to run collection scripts. In addition, this account must be granted the ALTER SETTINGS server-level permission to query machine name (SELECT SERVERPROPERTY('ComputerNamePhysicalNetBIOS') on the monitored SQL instances. This account also needs to be a member of db_owner role for the PerfCollections database.
- Open the PerfCollectionJobs.sql script, specify the collection frequency value for local variable @CollFrequency_Min and script location folder from step #1, and execute it to create a regular collection job. The job would be in disabled state by default and would need to be enabled once all configurations are finished.
Configuring SQL Server Performance Data Collection
Configuration process includes following steps:
- Enter SQL instance names into SQLInstances table. Please note, collection for specific SQL instance would not start until the ‘Active’ flag for that instance is set to ‘True’.
- Enable ‘Collect performance counters from cmd’ SQL Server Agent Job.
- Edit
PerfCounter_Groups table to add/remove performance counters, as needed. Please
see the guidelines below:
- ObjectName (mandatory
field)
should be entered with the following format:
- For SQL instance related counters - SQLSERVER:XXXX. Please note, collection scripts would replace ‘SQLSERVER’ word with the appropriate instance name
- For the counters having multiple instances object name should be like XXX(*) (for example, LogicalDisk(*))
- CounterName (mandatory) – No restrictions
- Threshold (optional) – Identifies recommended threshold for counter and is useful for the Business Intelligence analysis. When the value of ‘ExceedsFlg’ field is set to ‘True’, counter’s value would be marked as ‘Beyond threshold’ when it raises above a threshold value. Similarly, when ‘ExceedsFlg’ field is ‘False’, counter’s value would be marked as ‘Beyond threshold’ when it drops below the threshold value.
- Critical Threshold (optional field) – Identifies the critical threshold for a counter and would affect the counter’s conditional formatting, depending on the value of the ‘ExceedsFlg’ field (similar to ‘Threshold’ field)
- ExceedsFlg (optional field) see #3.3 and 3.4
- Active (mandatory) – Turns on/off a specific counter’s collection
- AlertFlg (optional) – Created for future development purposes, not used with current version
- Aggregate (optional) – Identifies whether or not data related to this metric will be uploaded into the data warehouse for further analysis purposes.
- Total_Only (optional) – When this field is set to ‘True’ it’ll limit the collection to only ‘_total’ instance for multi-instance counters (like ‘%Processor Time’ counter)
- CounterInstances (mandatory) – When specified, it will limit the collection to only instance names listed in this column. Multiple instance names (separated by comma) could be specified for each counter. Please note, this field is a mandatory field, so either ‘*’ (to include all instances) or specific instance names should be specified in this field.
- GroupPath (read-only, calculated field) - Required by the collection scripts.
- CounterType (mandatory) - When set to value 1 (default) it will identify the counter as a standard performance counter, when set to value 2 it will identify a counter as query based custom counter.
- QueryTxt (optional) –SQL query for type 2 (query based custom) counters. Query should return following mandatory fields: InstanceName (counter instance name), CookedValue (counter’s value),Timestamp (collection date, time), Path –(unique string, identifying counter/instance). Here is a sample query for a custom counter, obtaining ‘Active workers count’ from sys.dm_os_schedulers DMV :select '_total' AS InstanceName, SUM(active_workers_count) As CookedValue,GetDate() as TimeStamp,'\\'+@@Servername+'\Custom:DMV\Active workers count' As Path FROM sys.dm_os_schedulers where scheduler_id < 255 AND status ='VISIBLE ONLINE'
- SQLInstances (mandatory field) - When specified, it will limit the collection to only SQL instances for which ID’s (instance_id field From SQLInstances table) are included in this column. Multiple SQL instance ID’s (separated by comma) could be specified for each counter. Please note, either ‘*’ (for all instances) or specific SQL instance ID's should be specified in this field.
- ObjectName (mandatory
field)
should be entered with the following format:
Collection scripts
Metrics are collected by the below scripts:
CollectPerfCountersFromSQLServers.ps1 – Main script which manages the parallel execution of collection scripts from multiple SQL Server instances. This script requires the central repository for the SQL Server instance’s name as a parameter.
Here is high level description of CollectPerfCountersFromSQLServers.ps1 script:
- Load SQL libraries, I’ve used sample code from this blog by Martin Bell for this function.
- Read the list of active performance counters from the PerfCounter_Groups table.
- Read the SQL Server instance information from the SQLInstances lookup table.
- Inside the loop for
each SQL Server instance the following occurs:
- Read machine name, hosting SQL instance
- Execute the CollectMetrics script to start the collection of all counters related to this SQL instance. Please note, collection jobs for multiple SQL instances would be executed in parallel.
- Wait until all individual jobs are finished and quit.
CollectPerfCountersFromSQLServers script is provided below:
param([Parameter(Mandatory=$true)][string]$PerfDbInstance)#Support Functions
Function LoadSQLModules
{
if ( Get-PSSnapin -Registered | where {$_.name -eq 'SqlServerProviderSnapin100'} )
{
if( !(Get-PSSnapin | where {$_.name -eq 'SqlServerProviderSnapin100'}))
{
Add-PSSnapin SqlServerProviderSnapin100 | Out-Null
} ;
if( !(Get-PSSnapin | where {$_.name -eq 'SqlServerCmdletSnapin100'}))
{
Add-PSSnapin SqlServerCmdletSnapin100 | Out-Null
}
}
else
{
if( !(Get-Module | where {$_.name -eq 'sqlps'}))
{
Import-Module 'sqlps' –DisableNameChecking
}
else
{
write-host "SqlServerProviderSnapin100 is not registered"
}
}
}

Function Get-ScriptDirectory
{
$Invocation = (Get-Variable MyInvocation -Scope 1).Value
Split-Path $Invocation.MyCommand.Path
}
#--------------------------------------------------------------

#Main module
#--------------------------------------------------------------
LoadSQLModules

$Path=Get-ScriptDirectory
$Jobscriptfile=$Path+".\CollectMetrics.ps1"

#Read performance metrics to be collected
$Query="SELECT [GroupID],[GroupPath],[CounterInstances],SQLInstances,CounterType,QueryTxt FROM [dbo].[PerfCounter_Groups] Where Active=1"
$PerfCounters=Invoke-Sqlcmd -ServerInstance $PerfDbInstance -Database "PerfCollections" -Query $Query

#Read SQL instance names,ID's from lookup table
$Query="SELECT [instancename],Instance_id FROM [dbo].[SQLInstances] WHERE Active=1 ORDER By Instance_Id"
$SqlInstanceList=Invoke-Sqlcmd -ServerInstance $PerfDbInstance -Database "PerfCollections" -Query $Query
#loop for SQL instances
foreach ($SqlInstance in $SqlInstanceList) #For each SQL instance
{
#Read machine name, hosting SQL instance
$QueryMachineName = "SELECT SERVERPROPERTY('ComputerNamePhysicalNetBIOS') as ActiveNode;"
$InstanceName=$SQLInstance.instancename
$InstanceId=$SQLInstance.instance_id
$MachineNames= Invoke-Sqlcmd -ServerInstance $InstanceName -Database "master" -Query $QueryMachineName
#Read all counters related this SQL instance
$Jobs = Start-Job $Jobscriptfile -ArgumentList $PerfDbInstance,$InstanceName,$InstanceId,$MachineNames[0] ,$PerfCounters
}
#Wait in loop until counters from all SQL instances are read
Get-job
$JobsCnt = (get-job -state running | Measure-Object).count
while($JobsCnt)
{
get-job -state running
start-sleep -seconds 5
$JobsCnt = (get-job -state running | Measure-Object).count
}}
CollectMetrics.ps1- Script to collect metrics from a single SQL Server instance. This script requires the central repository SQL Server instance’s name, monitored SQL Server instance’s name, monitored SQL Server instance’s ID from the SQLInstances table, monitored server’s physical machine name and array of metric attributes as parameters.
Here are high level steps for the CollectMetrics.ps1:
- Load SQL libraries
- Create connection object to be used by the counter insertion custom function,
- If the SQL instance is a named instance then separate the instance and server name as separate parts
- Inside the loop for the performance counters execute
the following steps for each counter:
- Read the attributes of the metric
- For SQL Server related metrics replace keyword ‘SQLSERVER’ in CounterName field with appropriate instance name
- Add machine name at the beginning to get the correct path
- Check whether or not this SQL Server instance is included in the
counter's SQL instances list and skip to the next counter if not
- Check counter’s type
and use Get-Counter command if it’s a standard counter. If this is a query based
counter, read the query from the PerfCounter_Groups table and run it against the SQL
Server instance
- If counter has multiple instances, loop through each instance and
check if that counter instance is configured for collection
- Read counter attributes (values, timestamp, etc.) and write them into the PerfCollection database using the usp_InsertPerfCollection stored procedure. This script calls the ‘exec-storedprocedure’ function to trigger the above mentioned stored procedure. For this function I’ve used a slightly modified version of the code from this blog, provided by Mike Shepard.
CollectMetrics.ps1 script is provided below:
param(
[Parameter(Mandatory=$true)][string]$PerfDbInstance,
[Parameter(Mandatory=$true)][string]$SqlInstanceName,
[Parameter(Mandatory=$true)][string]$SqlInstanceId,
[Parameter(Mandatory=$true)][string]$MachineName,
[Parameter(Mandatory=$true)][array]$PerfCounters =@{}
)
#--------------------------------------------------------------
#Support functions
Function LoadSQLModules
{
if ( Get-PSSnapin -Registered | where {$_.name -eq 'SqlServerProviderSnapin100'} )
{
    if( !(Get-PSSnapin | where {$_.name -eq 'SqlServerProviderSnapin100'}))
    {
        Add-PSSnapin SqlServerProviderSnapin100 | Out-Null
    } ;
    if( !(Get-PSSnapin | where {$_.name -eq 'SqlServerCmdletSnapin100'}))
    {
        Add-PSSnapin SqlServerCmdletSnapin100 | Out-Null
    }
}
else
{
    if( !(Get-Module | where {$_.name -eq 'sqlps'}))
    {
        Import-Module 'sqlps' –DisableNameChecking
    }
    else
    {
    write-host "SqlServerProviderSnapin100 is not registered"
    }
}
}

Function LogError
{
param(
[Parameter(Mandatory=$true)][string]$Metric,
[Parameter(Mandatory=$true)][string]$MsgTxt)
$ErrMsg=$MsgTxt.Replace("'","''")
$LogErrorQuery="dbo.usp_LogError '$Metric','$ErrMsg'"
Invoke-Sqlcmd -ServerInstance $PerfDbInstance -Database "PerfCollections"  -Query $LogErrorQuery
}

function exec-storedprocedure($storedProcName,
        [hashtable] $parameters=@{},
        $conn){

        $close=($conn.State -eq [System.Data.ConnectionState]'Closed')
        if ($close) {
           $conn.Open()
        }
        $cmd=new-object system.Data.SqlClient.SqlCommand($sql,$conn)
        $cmd.CommandType=[System.Data.CommandType]'StoredProcedure'
        $cmd.CommandText=$storedProcName
        foreach($p in $parameters.Keys){
            $cmd.Parameters.AddWithValue("@$p",[string]$parameters[$p]).Direction=
                  [System.Data.ParameterDirection]::Input
        }

        $ds=New-Object system.Data.DataSet
        $da=New-Object system.Data.SqlClient.SqlDataAdapter($cmd)
        [Void]$da.fill($ds)
    }


#--------------------------------------------------------------
#Main module
LoadSQLModules
#Create connection object for stored procedure
$SqlConnection = New-Object System.Data.SqlClient.SqlConnection
$SqlConnection.ConnectionString = "Server="+$PerfDbInstance+";Database=PerfCollections;Integrated Security=True"
#Separate instance and virtual names for named SQL instances

If ($SqlInstanceName.contains("\") )
{$NamedInstanceFlg=1
$InstName=$SqlInstanceName.Split("\")[1]
}
else
{$NamedInstanceFlg=0}

#Loop for each counter
foreach ($CounterGrpRecord in $PerfCounters)
{
try{
$GroupId=$CounterGrpRecord.GroupId
$CounterInstFilter=$CounterGrpRecord.CounterInstances
$Metric=[string]$CounterGrpRecord.GroupPath

IF ($Metric.StartsWith("\SQLSERVER") -And $NamedInstanceFlg -eq 1)
{#For SQL metrics replace with appropriate instance name
 $MetricWithInstance=$Metric.Replace("SQLSERVER","MSSQL`$"+$InstName)
}
else
{
$MetricWithInstance=$Metric
}
#Add machine name at the beginning to create correct path
#Write-output $MetricWithInstance
$MetricWithInstance="\\"+$MachineName+$MetricWithInstance

if ($CounterGrpRecord.SQLInstances -ne "*" -And !$CounterGrpRecord.SQLInstances.Contains($SqlInstanceId))
{
continue    #Skip to the next counter, if this SQL instance is not included in the counter's instances list
}

if ($CounterGrpRecord.CounterType -eq "1")
{       #Standard performance counter
$Samples=(Get-Counter  -Counter $MetricWithInstance).CounterSamples
}
else    #Query based counter
{
#Prepare and run query against sql instance
 $GetAppCountersQuery=$CounterGrpRecord.QueryTxt
 $Samples=Invoke-Sqlcmd -ServerInstance $SqlInstanceName -Database "master"  -Query $GetAppCountersQuery
}
#Loop to get all instances of collected counter
foreach ($Sample in $Samples)
{
if (!$Sample)
{
#LogError $MetricWithInstance "Counter value is null"
Continue  #Skip to next if empty
}
#Read attributes of current counter instance
$CurrDateTime= [datetime]$Sample.Timestamp
$CounterValue=[decimal]$Sample.CookedValue
$CounterPath=$Sample.Path
$CounterInstanceName=$Sample.InstanceName

#Check if this counter instance configured to be collection
If ($CounterInstanceName -and $CounterInstFilter -ne "*" )
{
$CounterInstanceName=$CounterInstanceName.Replace("'","''")
If (!$CounterInstFilter.Contains($CounterInstanceName))
 {
  Continue  #Skip to the next counter instance, if this instance is not configured for collection
 }
}
#Save values of counter into DB
exec-storedprocedure  -storedProcName 'usp_InsertPerfCollection' -parameters @{Timestamp=$currDateTime;
SqlInstanceName=$SqlInstanceName;ServerName=$MachineName;CounterPath=$CounterPath;
Counter_GroupId=$GroupId;CounterInstance=$CounterInstanceName;CounterValue=$CounterValue} $SqlConnection
}  #End of samples loop

}  #End of try block

Catch
{
$ExcepMsg=[string]$_.Exception.Message
LogError $MetricWithInstance $ExcepMsg
}
} #End of counters loop
if ($SqlConnection.State -eq [System.Data.ConnectionState]'Open')
{
  $SqlConnection.Close()
}
GetPerfCollection.bat - Windows batch file to trigger main script (CollectPerfCountersFromSQLServers.ps1) from a SQL Server Agent Job. This batch file requires a collection scripts folder and monitoring a SQL Server instance’s name as parameters. Here is GetPerfCollection.bat script:
powershell.exe -NoProfile -ExecutionPolicy Bypass -Command "%1.\CollectPerfCountersFromSQLServers.ps1 '%2'"
Next Steps
- Stay tuned for the next two parts of this tip to see how to use the SQL Server Business Intelligence tools to analyze performance data.


About the author
 Fikrat Azizov has been working with SQL Server since 2002 and has earned two MCSE certifications. He’s currently working as a Solutions Architect at Slalom Canada.
This author pledges the content of this article is based on professional experience and not AI generated.
View all my tips
