By: Scott Murray | Comments (2) | Related: > Power BI
Problem
What are Power BI Desktop custom visualizations and how can I use them? Are there any security concerns? What files comprise a custom visualization? How can I review the files?
Solution
In several previous tips (Getting Started with Power BI Desktop, Querying SQL Server Data in Power BI Desktop and Power BI Desktop Web Queries, we covered some of the basic methods and functionality available within Power BI Desktop (PBID). The tool is really "cool", and the best news is that getting PBID is easy as downloading it at: https://powerbi.microsoft.com/downloads.
The current edition of the software is available free of charge, but of course that could change. Furthermore to publish the PBID reports to the web, you must have an account setup on the Power BI site and currently sign up for the web publishing is only available to commercial email addresses. Before I go too far I need to warn you that the tool is still in its early stages. Sure it works well from my testing, but features are being added and removed every week and every month. With all these changes and updates, Microsoft is currently releasing a new version of PBID at least once per month if not more often. You can see the latest version information on the Microsoft Power BI Support page at: https://powerbi.microsoft.com/en-us/documentation/powerbi-desktop-get-the-desktop/.
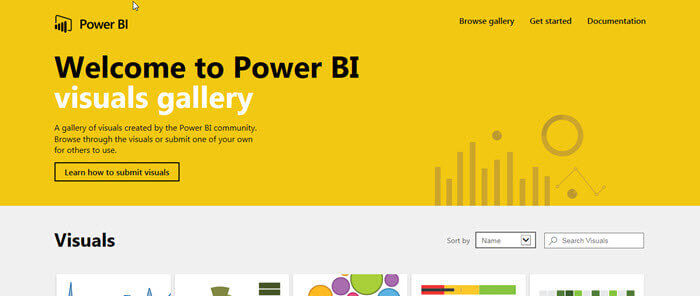
The Power BI Desktop includes a large variety of standard visualizations that cover a variety of report designer needs. In many cases these visualizations will meet the bulk of the needs of report designers. However, there are always those situations where a different style of chart, graph, or table is required to achieve a specific desired result. These customizations can be developed internally or you can retrieve other customized visuals from the Visualization Gallery, https://app.powerbi.com/visuals. The gallery, illustrated in the next two screen prints, contain visualizations that have been submitted to the Microsoft Power BI Group. These visuals can actually be used by Power BI Desktop or the Power BI products. These visuals are developed by community and are not warranted by Microsoft (more on security later).
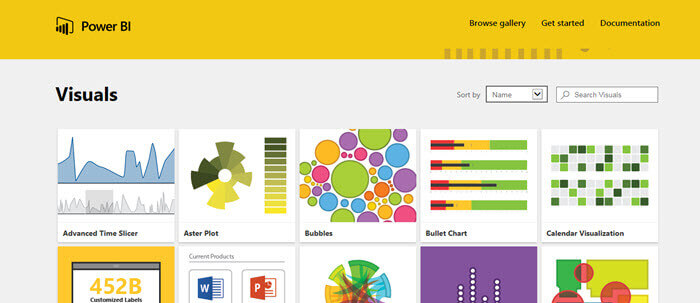
Within the online Visuals Gallery, you basically just click on the visualization you want in order to download the file to your own desktop.
Adding Customizing Visualizations in Power BI
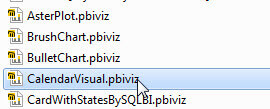
Once the decision is made to add a custom visualization, you must download the visual from the Power BI Visualization Gallery (as noted above) or retrieve the file from your own internal gallery if your organization designed the visualization locally. The visualization file that is created contains a pbiviz extension.
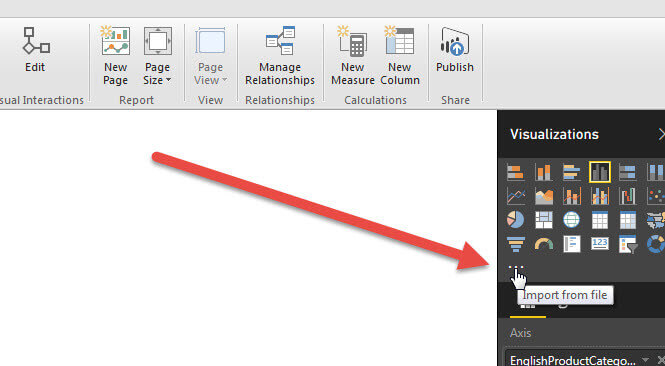
To import the visual, step 1 is to use the ellipse (3 dot button) to open the Import Visualization wizard, as shown below.
Microsoft covers its risk liability and is sure to let you know that the Custom Visual is not one of its own. We will discuss how you validate a custom visual shortly.
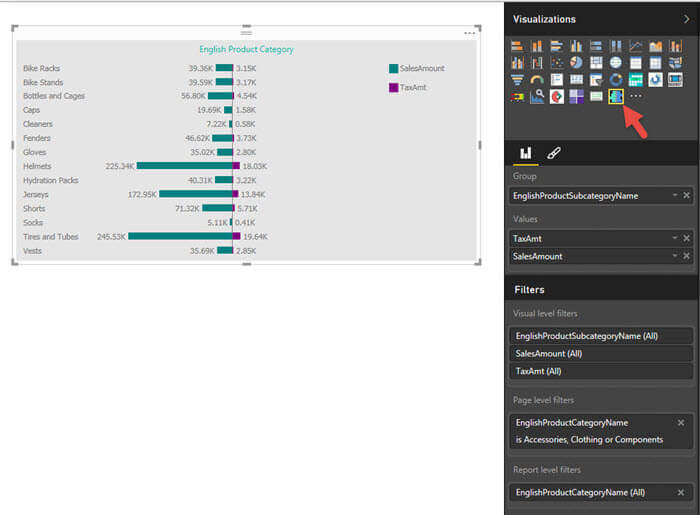
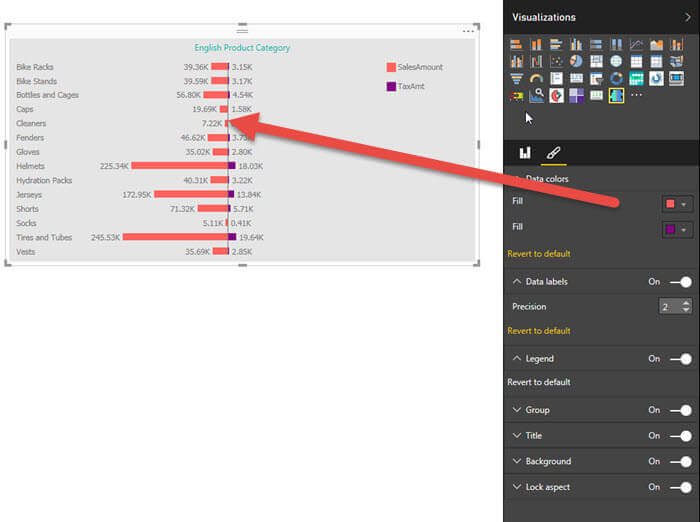
Once we have imported a visual, it now shows up in the report gallery, as shown next.
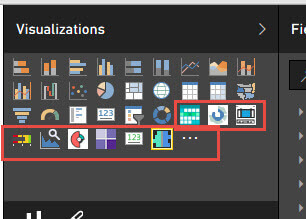
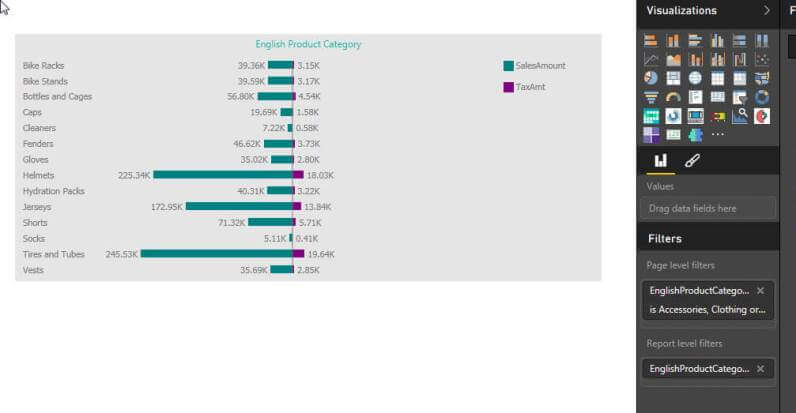
Now we simply use the visual like you would any other visual on the dashboard. In the below illustration, we added the Tornado Chart visual to our dashboard. Notice that the options and properties are similar to many of the standard visualizations.
Power BI Custom Visualizations Security Risks
So as you can see, custom visualizations are easy to implement
and use; security risks certainly exist and could be exploited within a
custom visual. The first step in your vetting process is to check out
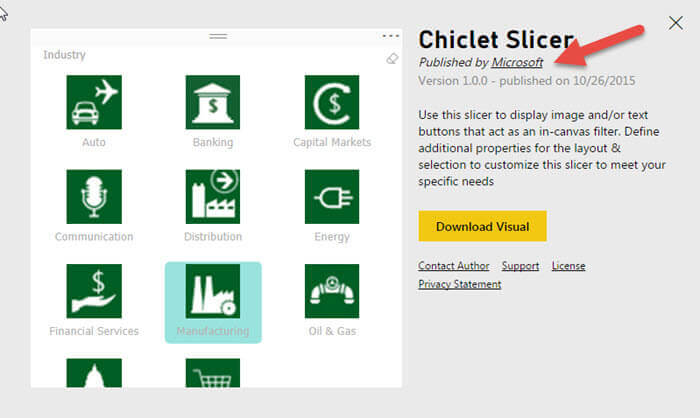
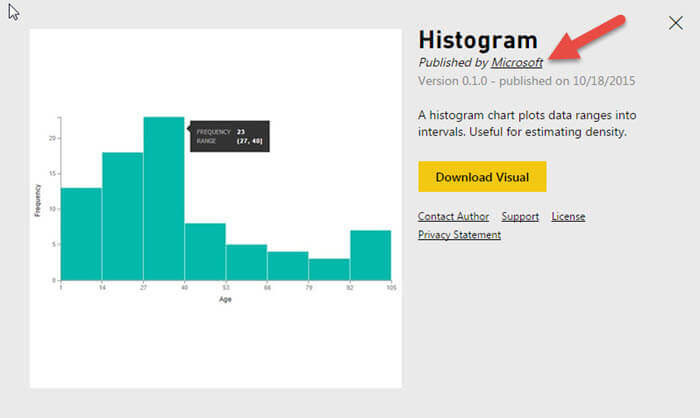
the publisher of the visualization. In particular, online you can see the
publisher just under the visualization name on the download page, and then by clicking the
support button you will be taken to the publisher's website. You could
also click the Contact Author link which will open an email to the
author's designated address. Finally, you can click on the GitHub link
to check out the source code for the visual; we will discuss shortly an
alternate way of examining the code used within the visual.
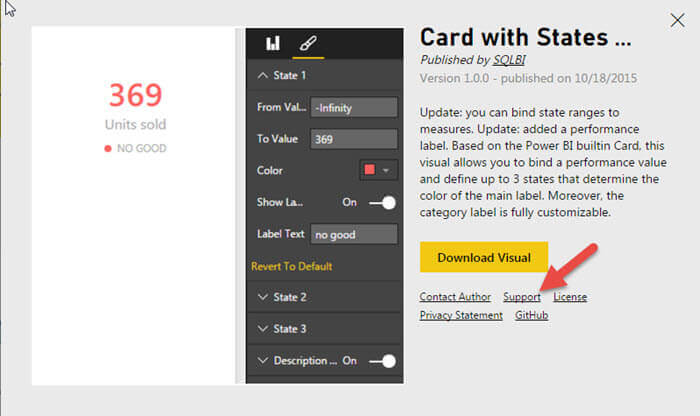
One of the other surprising things about the custom visuals, is that actually many of them are published by Microsoft; I assume these are a testing ground for new visuals that may be permanently added later.
Once you have checked out the website for a custom visual, you will then want to run through the code. As mentioned above, you can review the GitHub project for the non Microsoft projects. Alternately, I find it even more helpful to extract the pbiviz files using an unzip tool. In the below example, I use my preferred zip tool, 7-Zip, to extract the files from the main visualization file.
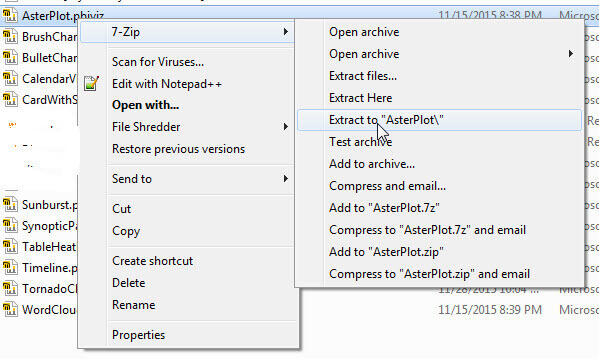
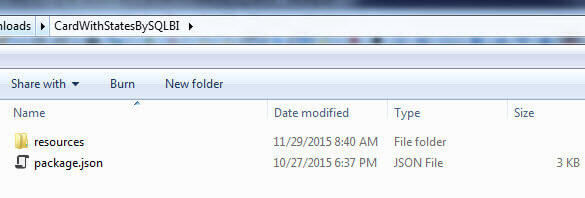
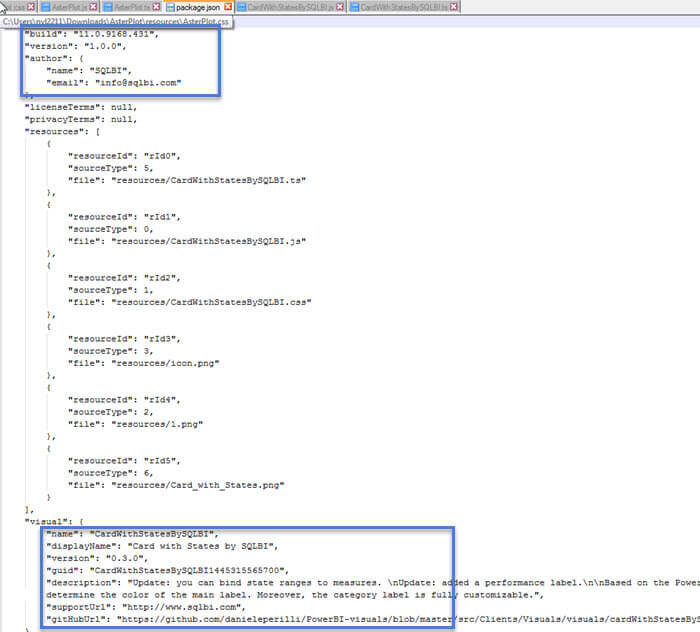
As shown below with the Card with States visual, the unzip process creates two directory levels. The first level includes the json file which is a manifest list of all the files used by the visual and also includes description and contact info for the visual publisher.
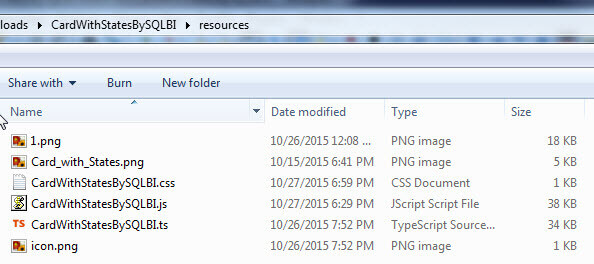
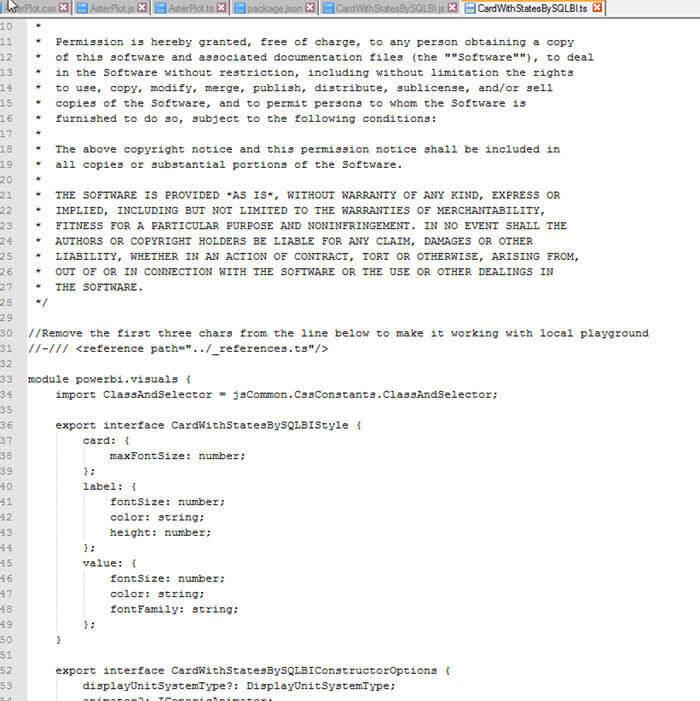
The resources sub-directory contain the "working" files for the visual. The png files shown are the thumbnail and example images for the visualization. The css file contains any styles you want to add. The remaining files, the js and ts file are the files you would want to examine the most as these files execute the JavaScript and Typescript that run the visualization and could contain rogue code..
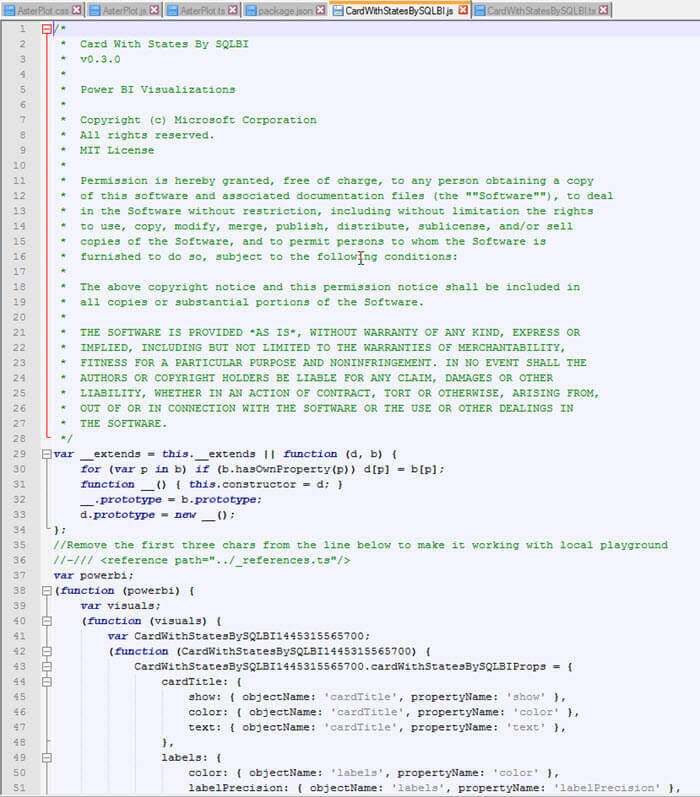
Typescript is a superset of JavaScript that compiles back to basic
JavaScript. Thus for both the js (shown above) and ts (shown
below) file, you need to examine what
calls are being made to the data, determine what data is being sent
internally and externally. I would also check to see if requests are
being made in the JavaScript to obtain non applicable data from the
machine executing the visual. Furthermore, you should check if the
JavaScript is attempting to write to the local machine's hard drives.
Just as you would with other code obtained from the Internet, be cautious and
check what you are wanting to run before actually putting the visual
into production.
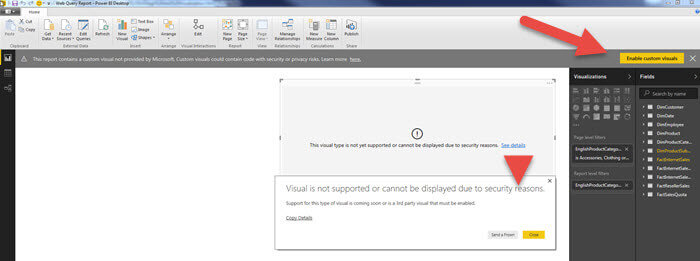
Enable a Visualization in Power BI
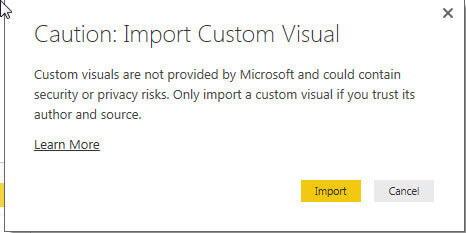
Once you have added the visualization, then it is now embedded into
the dashboard. Each time you open that report or any report that is
shared with you that contains a custom visual, you will receive the
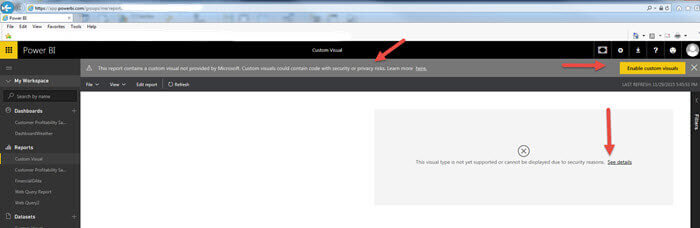
below message and the visualization will not display immediately. You must enable
the visual each time the PBID file is opened. As noted in the second
screen print, the same warning appears when you publish the report.
Once you enable the visual, it now appears as normal; however you must enable it upon each opening of the report.
Conclusion
The tool set / feature list for Power BI Desktop just keeps expanding; one way that PBID can be scaled is to include new custom visuals which are available via the online Visuals Gallery. This gallery allows you to download and implement custom visualizations that have been developed both by Microsoft and by the Power BI community (including internally within your organization). These visualizations are in addition to the existing set of visualization available when you first download the Power BI Desktop. Once you download the custom visual, you import them into your report; however, because of the security risks, you must enable the visual each time you open a report and run the visualization. You need to review each custom visual, and specifically vet that the JavaScript used to run the visualization is not a risk to the data that is being displayed nor is it attempting to garner non applicable information from the machine running the Power BI report.
Next Steps
- Check out these resources:
- Microsoft PowerQuery - https://powerbi.microsoft.com/en-us/
- TypeScript - http://www.typescriptlang.org/
- All Power BI Tips
- All Business Intelligence Tips
Learn more about Power BI in this 3 hour training course.


About the author
 Scott Murray has a passion for crafting BI Solutions with SharePoint, SSAS, OLAP and SSRS.
This author pledges the content of this article is based on professional experience and not AI generated.
View all my tips
