By: Siddharth Mehta | Comments | Related: > Power BI
Problem
Data search is a very common requirement and filters in reports is one way of letting users search the data and adjust the scope of data as desired. When reporting with large datasets, reports tend to have a substantial number of records on a single screen and even filters can have tens to hundreds of values. The data filtering mechanism must be more intelligent than pre-determined filters. Faceted search is one of the most effective ways to enable users to get insight of the data and plan their data discovery strategy on the reports. One of the common examples of faceted search is when you search for a product on Amazon.com, you can set filters on the left of the screen based on the attributes in the search results. Implementing a free-text style search and facet-based filtering can significantly change the way users search or filter data in the reports. In this tip we will learn how to implement faceted search or filtering in Power BI Reports.
Solution
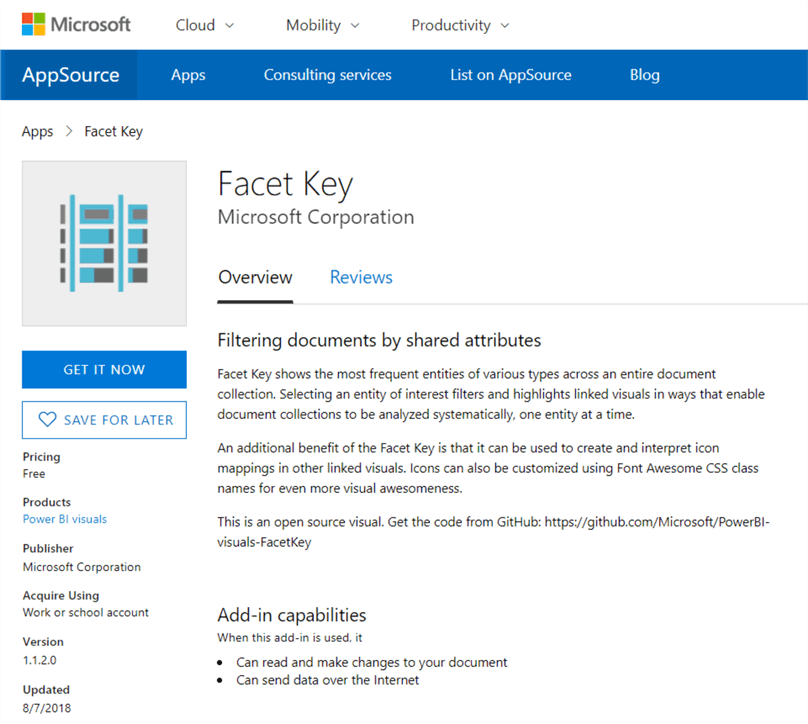
FacetKey visualization in the Power BI Visuals Gallery can be used to create faceted search and filters in Power BI Reports. For the exercises in this tip, we will need the WorldWide Importers database which can be downloaded. It is assumed you have this database installed on your SQL Server instance and should be available as source data for Power BI Reports. Follow the steps below.
How to create a Power BI Report with Faceted Search and Filtering
Power BI Faceted Search and Filtering is beneficial for large data sets to quickly narrow your result set in order to focus on the most meaningful data. This can be accomplished in Power BI with the following steps:
- Download the FacetKey visual, add it to Power BI Desktop, connect to your data source and preview the data.
- Drag and drop the FacetKey visual into your Power BI workspace then begin working with the particular facets which could be regions, countries, products, etc.
- Begin searching with the FacetKey parameters to refine your results with the configuration pane in Power BI. The Power BI data pane will automatically update with the results.
- Over time, facets can be refined in Power BI in order to improve the productivity of the users.
Check out the end to end example below to get started with Power BI Faceted Search and Filtering to streamline your reporting process.
Steps to Create a Power BI Faceted Search Report with Filtering
1) First, download the FacetKey visual from the Power BI Visuals Gallery, as it is not a built-in control in Power BI Report Designer. This visualization is available from Microsoft free of cost in the visualization gallery.
2) Once downloaded, we need to add it to Power BI Desktop. In the visualization tab of the Power BI Desktop, click on the ellipsis and select “Import from file” menu option. Point to the downloaded package file, to add the visualization in Power BI. This should add the FacetKey visual to Power BI Desktop visualizations gallery.
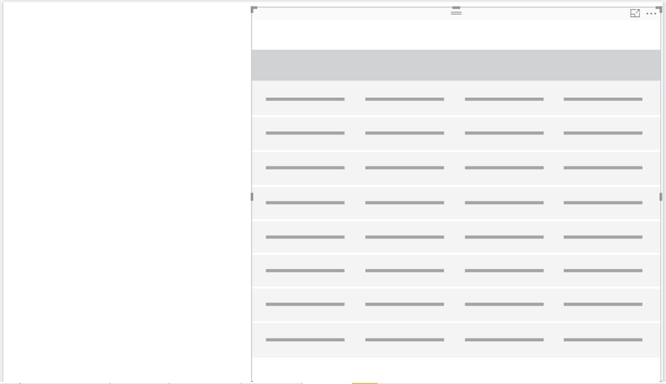
3) We need to add a voluminous dataset to the report. Table control is ideal for that, so add it to the report layout. Size this control to occupy the entire report leaving space for the facet control on the left-hand side as shown below.
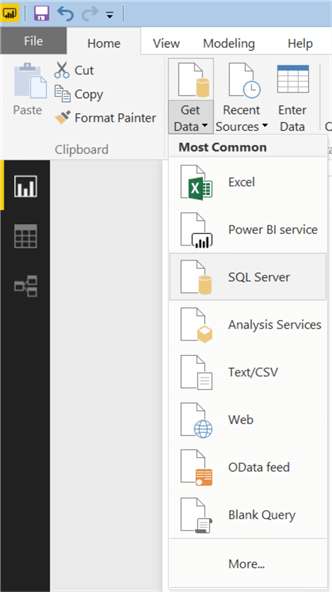
4) Once the visualization is added, we need to populate a reasonable large volume of data in this control on which analysis can be performed. We will use the Countries table that has categorical data which is suitable to understand facets. To start the data import, click on the Get Data and select SQL Server as shown below.
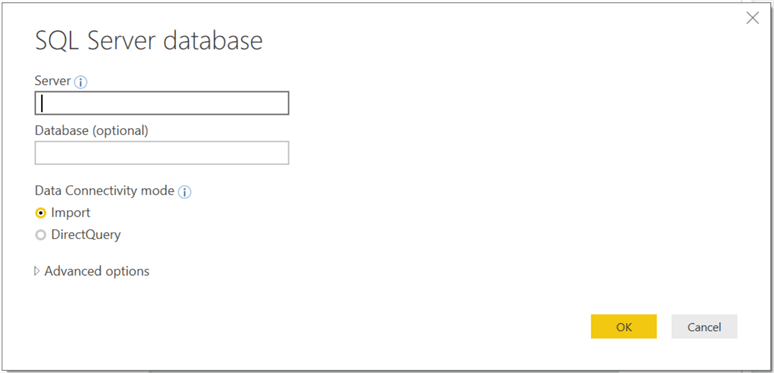
5) Provide server credentials to connect to the server on which you have hosted the database. Click Ok after providing the credentials.
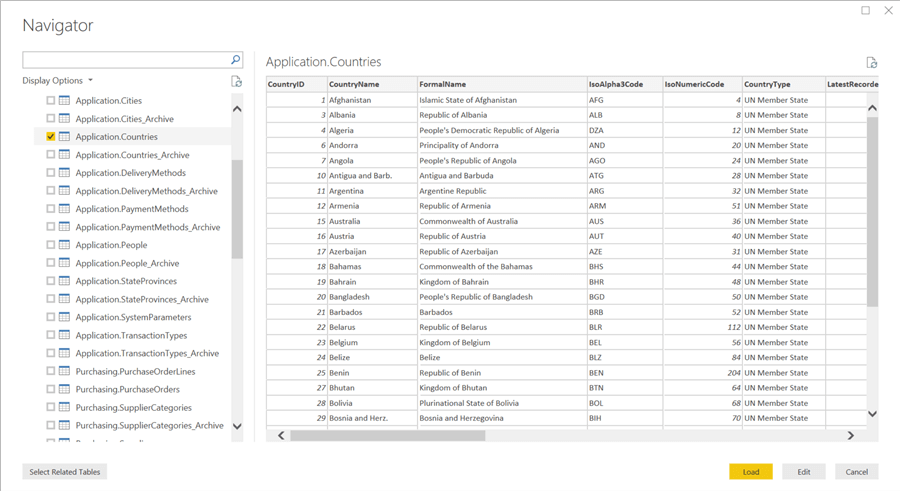
6) Select Application. Countries table as shown below and click Load.
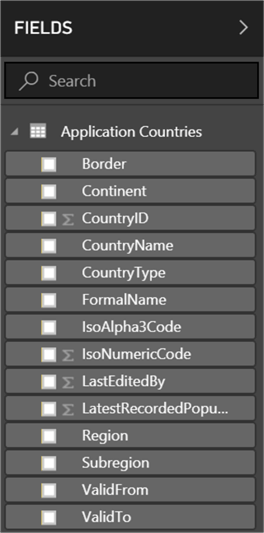
7) Once the model is loaded and created in Power BI Desktop, it should look as shown below.
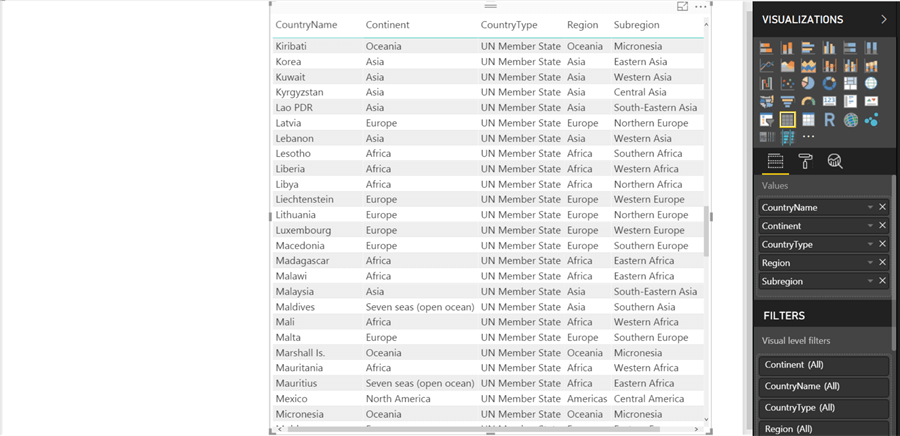
8) Select the table control and add fields to it as shown below. We are populating fields – CountryName, Continent, CountryType, Region, Subregion to this table for reference. The reason for populating these fields is that using the values of these fields we will be creating facets, which will show different facts and categories of values in these fields.
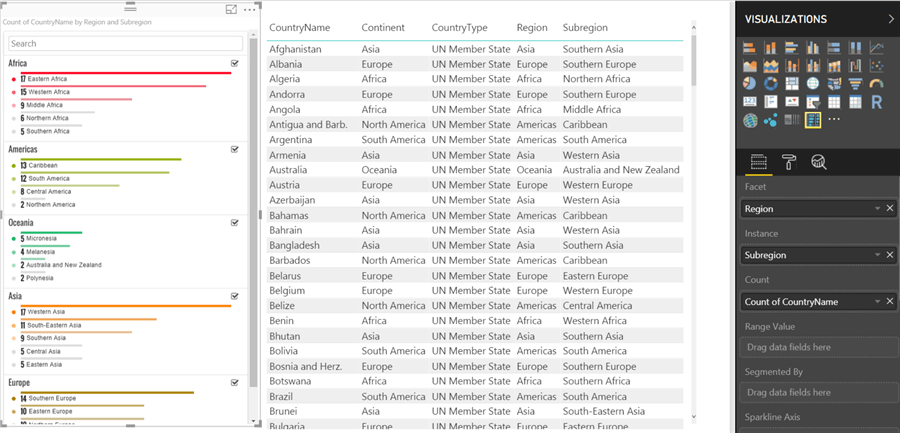
9) Add the newly added FacetKey control on the report. Select this control and add the fields as shown below. We need to add Region field in the Facet section. This will create the top-level categories for the filters. Add SubRegion filed to the Instance section, which is equivalent of sub-categories under the facets and finally add the CountryName filed to the Count section. It will automatically apply count aggregation to this fields. We intend to show the count of countries in each sub-region. After you had added all the fields as shown below, the facet filter should look as shown below.
10) Now it’s time to start the search. In the search box, visible at the top of the facet control, start typing the value of interest. It will search for the given terms in Region as well as Subregion fields. Let’s say we intend to search for Micronesia. Just type first few letters and it should show you the options that match the text provided in the search box as shown below.
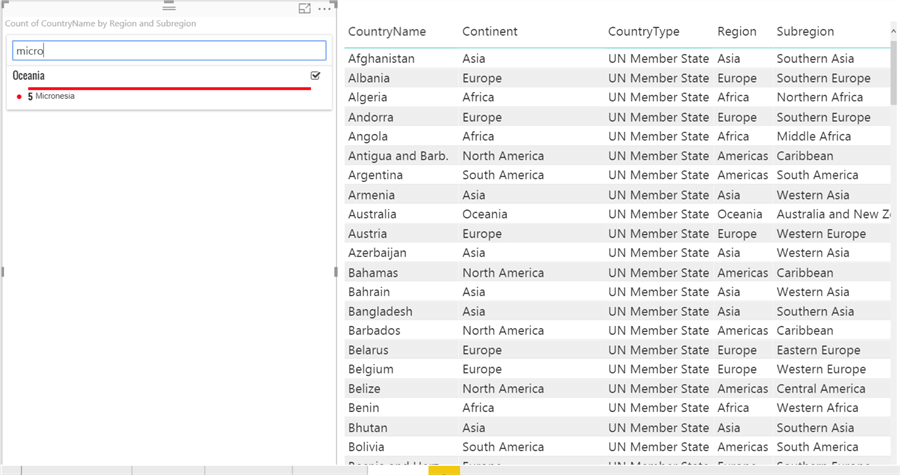
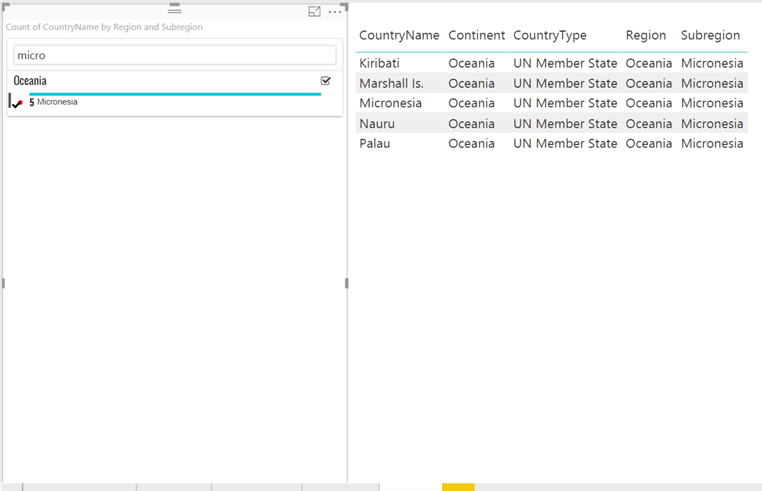
11) Click on Micronesia as shown in the facet control and the results in the table control will get filtered as shown below. If you look carefully, you will see that the facet item shows the number 5 for Micronesia which represents the total number of countries and on the right-hand side you will find 5 records in the table. This helps reconcile the total records too.
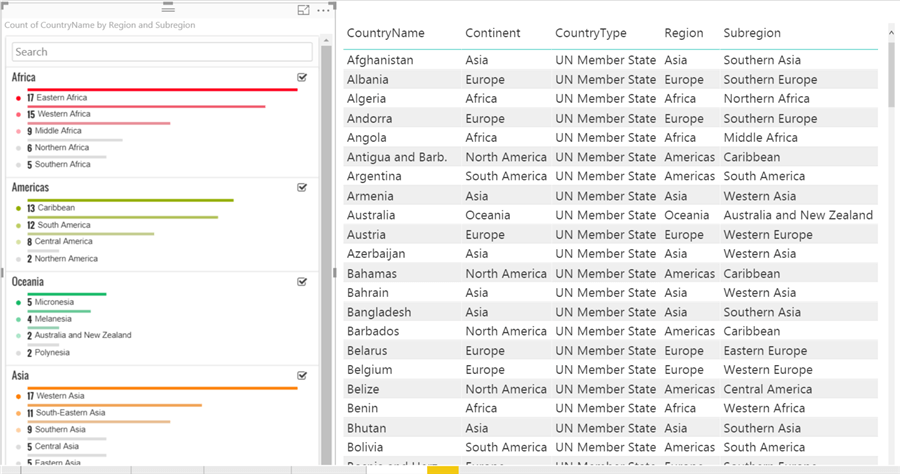
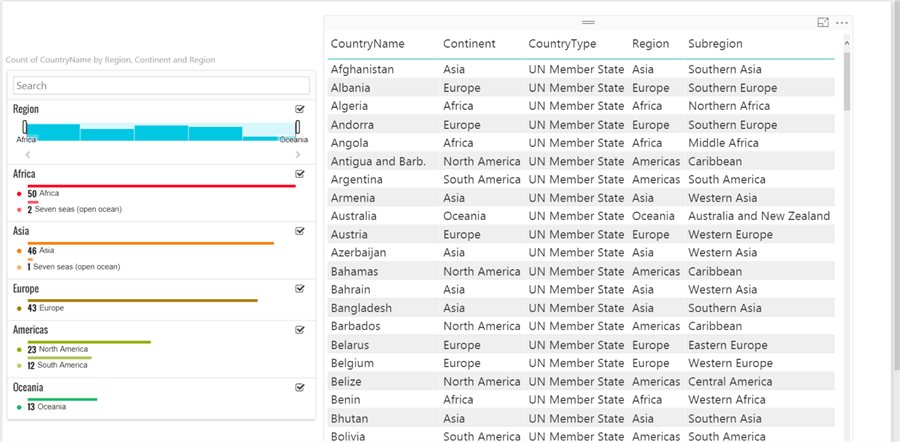
12) Click anywhere outside of the facet key for the filter to be removed and you will see all data again. Also, consider exploring the values in the facet control closely. You will find distinct colors in each facet, and the depth of the colors also varies by the total count in each item under the facet. The total number of countries in each item is represented by a bar which gives you a visual cue of the distribution contained in the item compared to other items in the same facet.
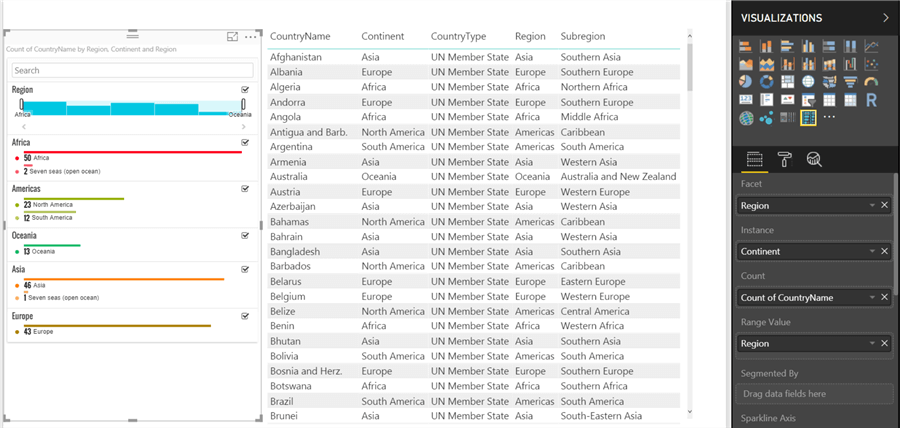
13) To understand an important feature of the facet control we need to change the config a little. Change the fields in the facet control as shown below. Replace the Subregion field in the Instance section with the Continent field and add the Region field to the Range Value section. This will change values under facet and will show the total number of countries for each continent. Try to compare the facet values after the changes with the ones before the changes. If you look at the values under the Europe facet, you will see the changes. Also, as we have added a field in the Range section, you can see the Range control above the facets, where an interactive control shows you the bar-graph style distribution by facets in a sorted order. In this case, as Continent is a text data-type, it is sorted alphabetically.
14) You can adjust the slider control, and this will apply a filter on the table. As shown below, we have selected the range Asia – Europe and all records are filtered accordingly.
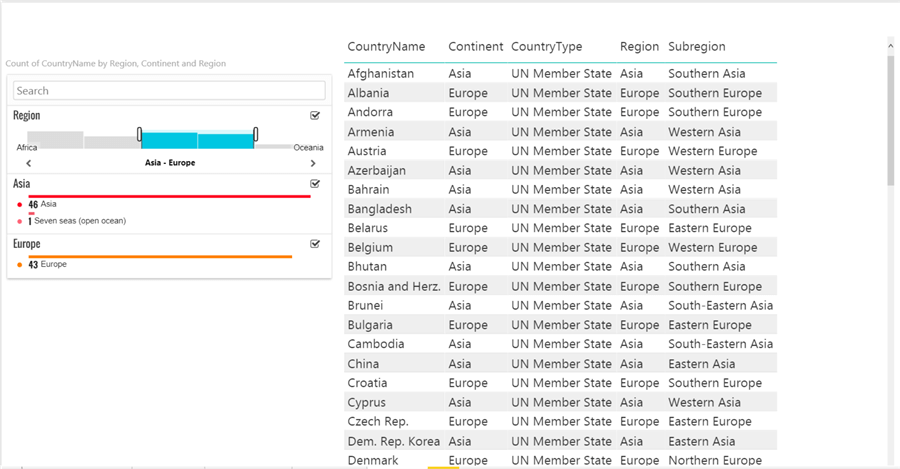
15) Click outside this area and the range filter will be removed and you should be able to see all data again as shown below.
Summary
It would take a lot of programming to enable filtering the way the facetkey control provides interactive filtering capabilities. Using the facetkey with just a few config steps, we enabled interactive filtering capabilities on the Power BI Report. Also, this filtering approach becomes much more informative with facets than filtering with pre-determined filters with a long list of values. In this way, you can enable faceted search on Power BI Reports using the FacetKey control.
Next Steps
- The FacetKey visual control has many formatting and configuration options. Consider exploring these and test to see what can make the search and filtering more interactive and intuitive.
Learn more about Power BI in this 3 hour training course.


About the author
 Siddharth Mehta is an Associate Manager with Accenture in the Avanade Division focusing on Business Intelligence.
This author pledges the content of this article is based on professional experience and not AI generated.
View all my tips
