By: Koen Verbeeck | Comments (2) | Related: > SQL Server 2016
Problem
SQL Server 2016 was released the first of June 2016. This release comes packed with dozens of new features and capabilities, and Reporting Services (SSRS) has its biggest revamp since SQL Server 2008R2. In the first part of this tip, we introduced a couple of new features, such as the HTML5 rendering, the Report Builder make-over and the custom parameter pane. In the second part, we'll explore other new features. As mentioned in the first part, the best is yet to come.
Solution
New Chart Types in Reporting Services 2016
SSRS 2016 introduces two new chart types: the treemap and the sunburst. Both are well suited to display hierarchical data.
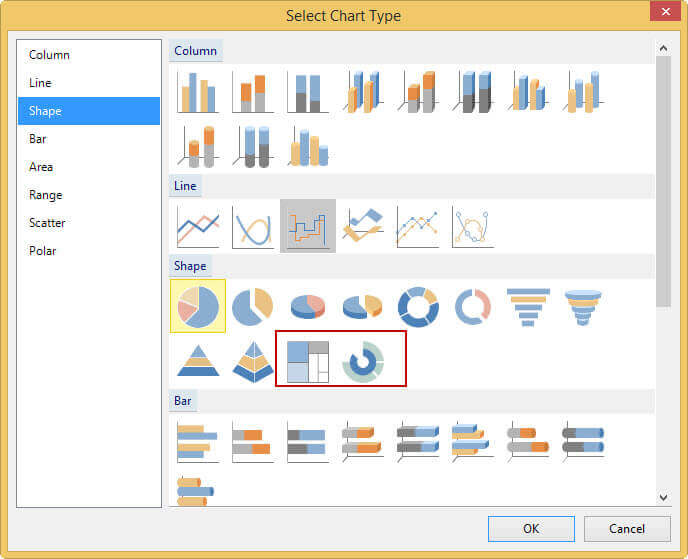
Also notice how the chart icons in the Select Chart Type have been updated to a more modern look and feel. The following example shows a treemap:
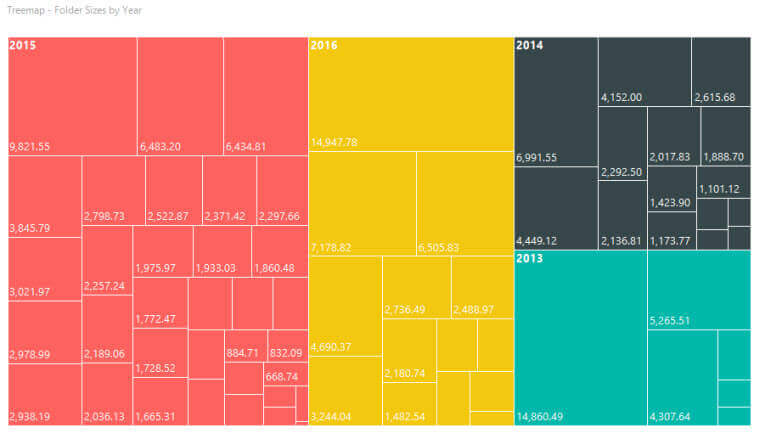
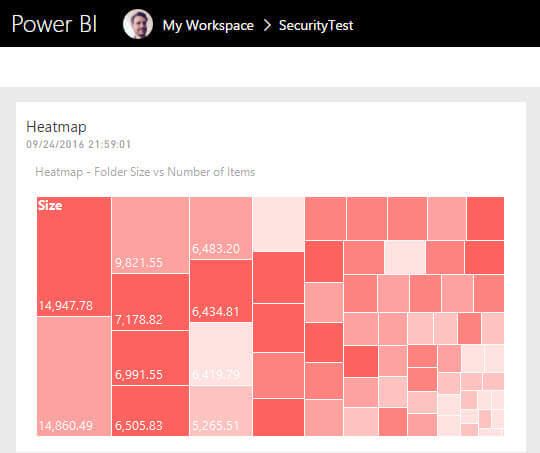
Treemaps use rectangles, so it's possible to compare the sizes of the different objects which each other relatively easy. More information on the treemap chart type can be found in the tip Create a Treemap Graph in SQL Server Reporting Services 2016. With the use of a little .NET, an extra measure can be added to the visualization, i.e. by varying the color intensity. This results in a so-called heatmap.
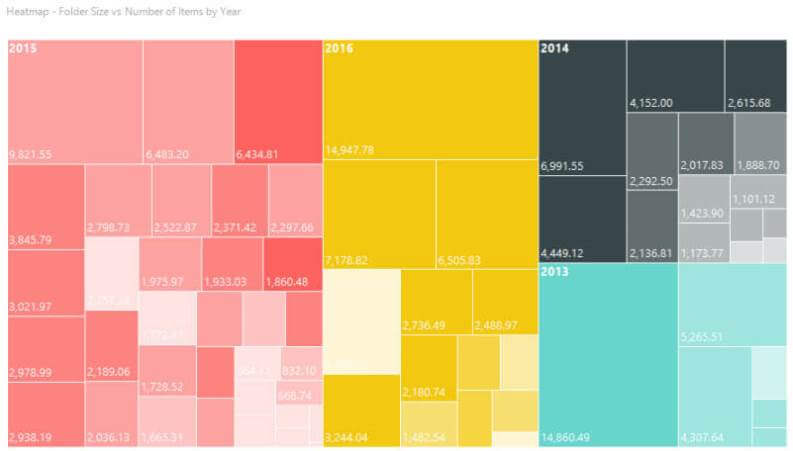
Now you can compare for example the correlation of the size of a folder with the number of items in it. You can read all about heatmaps in the tip How to create a heat map graph in SQL Server Reporting Services 2016. The sunburst graph type resembles a donut chart with multiple layers. Because the area of the slices are harder to process by the human brain, it's less suited to compare absolute differences than the treemap. You could use it though to compare relative differences.
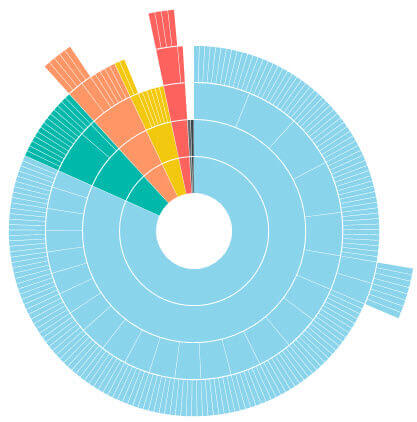
The sunburst is suited to display cyclical hierarchical data - such as years, quarters, months, days - or parent-child relationships with multiple levels. The example above shows the parent-child hierarchy of the AdventureWorks employee dimension. The sunburst chart is explained in the tip How to create a Sunburst Graph in SQL Server Reporting Services 2016. One change that has been implemented since the publication of the tip is that the sunburst chart starts its biggest slice at 12 o'clock. The slices are then sorted from largest to smallest. There are however currently no properties that influence this behavior, unlike the pie chart.
A Brand New Web Portal for SSRS 2016
One of the biggest changes in SSRS 2016 is the release of a brand new portal. This portal replaces the old Report Manager website. This new portal uses HTML5 technology, which has a couple of advantages: it works on all browsers and it loads very quickly. All of the functionality of the old Report Manager is incorporated into the new portal:
- security is still the same, using roles on the site level (System Administrator vs. System User) and on the folder level (Browser, Content Manager, My Reports, Publisher and Report Builder)
- you can still manage subscriptions and schedules on the server
- you can set caching and snapshot creation on reports
- you can create folders to organize your content. You can store shared data sources and shared data sets on the server and manage them there.
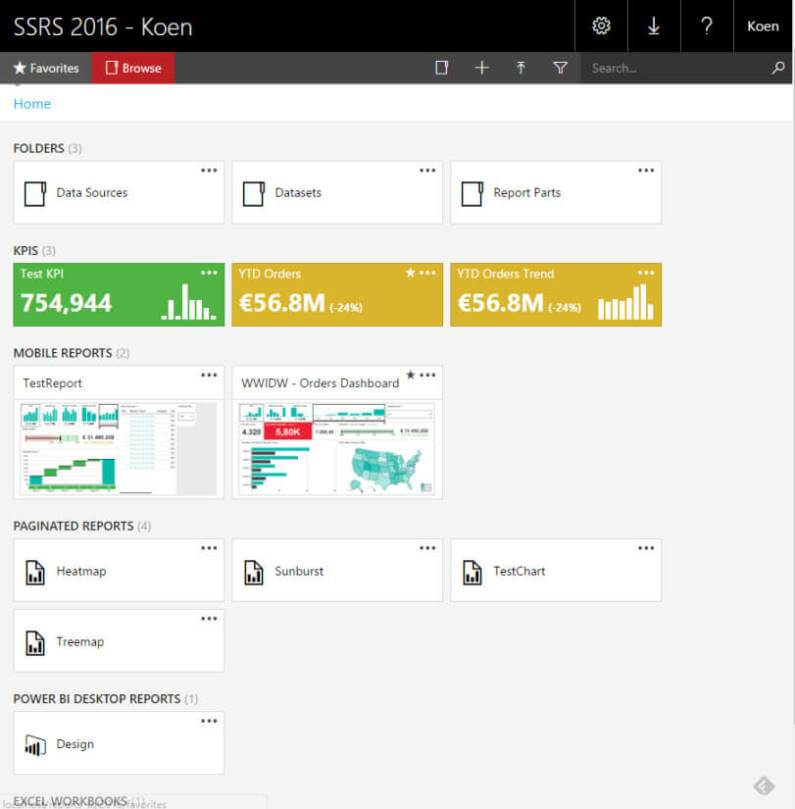
There are however a couple of new additions. You can for example upload more than just SSRS reports (named Paginated Reports now). You can also upload mobile reports (more on that in the next sections), but also Excel files and Power BI Desktop files. This makes your SSRS portal a centralized location for all your BI content. At the time of writing, clicking on an Excel file or on a Power BI Desktop file will open the appropriate client tool on your machine. However, it has been announced at the Microsoft Ignite event that the SSRS portal will be able to render Power BI reports soon (hopefully by the end of 2016).
Another great feature is custom branding. By creating a brand package, you can customize the layout of the SSRS portal. Using the lessCSS format, you can change the logo on the front page and all of the colors used by the portal. This way can customize the portal to the branding of your company. For more information on branding, check the MSDN page Branding the web portal.
Mobile Reports
Another great feature are mobile reports. Some time ago, Microsoft acquired DataZen, a company specialized in mobile reports on top of Analysis Services cubes. With SSRS 2016, Microsoft has integrated the DataZen technology into Reporting Services. Using the Mobile Report Publisher, you can create interactive dashboard optimized for mobile browsing.
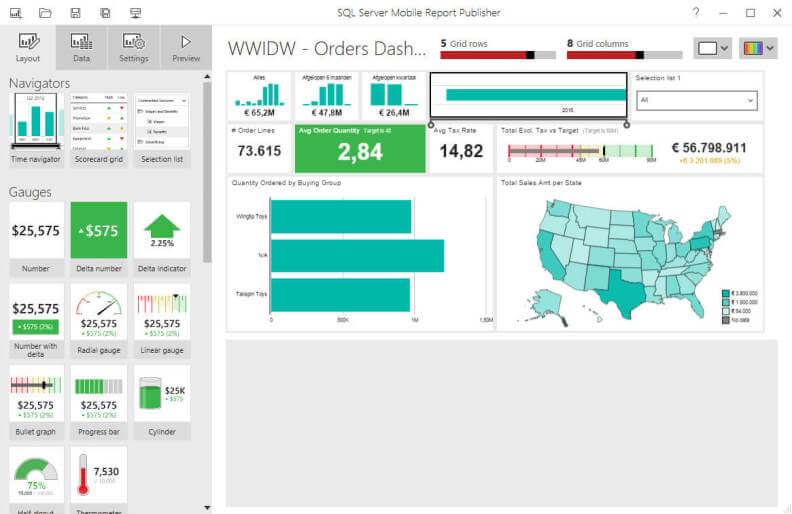
What's unique about the Mobile Report Publisher is that you can create dashboards using a "design first, data later" approach. Basically this means you can drag report objects on the canvas and start exploring the interactivity. Sample data is generated on the fly to support those report objects. This makes it really easy to quickly create mock-up dashboards. At a later point in time, you can connect the report objects to an actual data set. Furthermore, you can optimize the report for different screen sizes. You have 3 sizes: the Master (corresponding with a normal desktop view), the Tablet and the Phone. By switching to another layout, you can optimize your mobile dashboard for a specific screen size, by either re-arranging the layout or by dropping some report objects.

With a brand package (see previous section), you can also style your mobile reports as well. For a more thorough introduction to mobile reports, check out the tip SQL Server 2016 Reporting Services Mobile Report.
In the September 2016 release of Power BI Desktop, they implemented this capability of varying screen sizes into Power BI Desktop as well. Important to know is that you can also view your mobile reports on the SSRS server using the Power BI app.
KPIs
Another piece of DataZen technology are the KPIs. In the web portal, you can create key performance indicators that are displayed on the front page. Using a shared dataset, you can specify a goal, status and actual value. Optionally, you can specify a trend line as well.
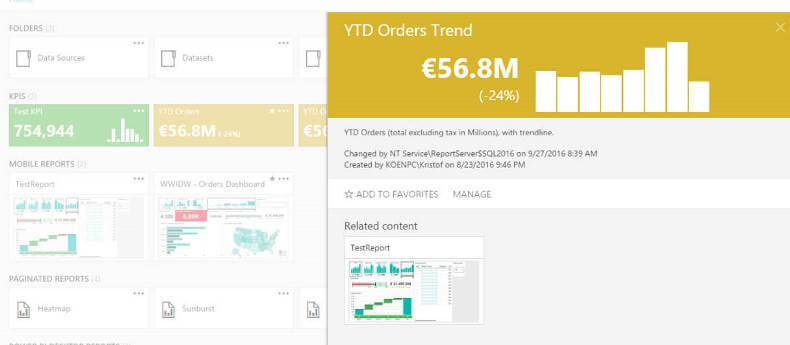
These KPIs are very useful for a quick-at-a-glance overview of your most important numbers. More details about how to create and configure KPIs can be found in the following tips:
- Create a basic KPI in SQL Server Reporting Services 2016
- Advanced KPI Configurations in SQL Server Reporting Services 2016
- Refresh the Data for a KPI in Reporting Services 2016
Pin Report Item to Power BI Dashboard
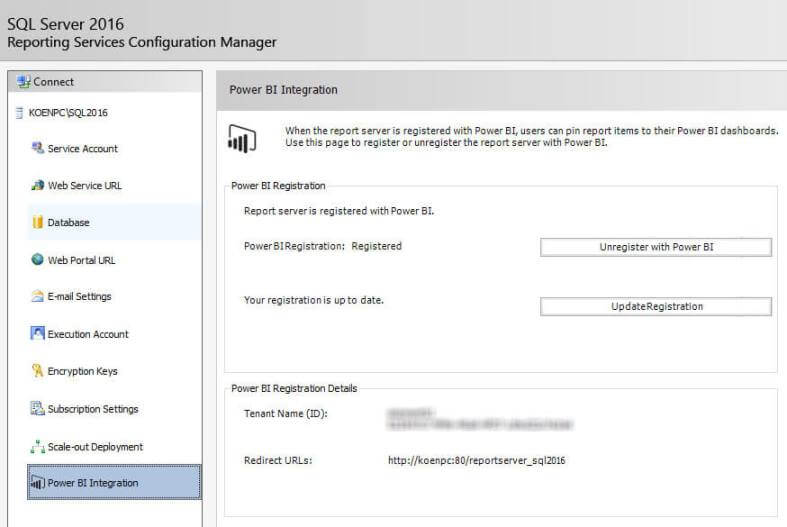
An integration point between SSRS 2016 and Power BI is the ability to pin a report object from a paginated report to a Power BI dashboard. In order to do this, Power BI integration must be set-up in the Reporting Services Configuration Manager.
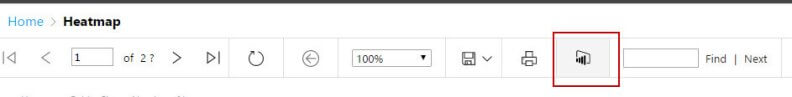
When you run a paginated report in the new web portal, there's a new button for pinning report objects.
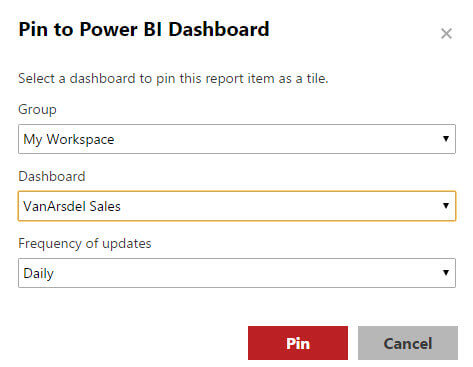
When you click this, you'll be asked to sign in into Power BI - if applicable - and to choose to which report object you want to pin. After that, you need to choose to which dashboard you want to publish, in which group and you also need to choose a refresh schedule.
The report object will then be added to the selected dashboard. Clicking on it will take you back to the on-premises paginated report.
Remember that the report needs to be configured to work with a stored credential. More information can be found in the tip Pinning a SQL Server Reporting Services Report to Power BI.
Other features
Finally there are some other smaller features and improvements:
- Support for .NET Framework 4, including 4.0 and 4.5.1.
- Support of integration with SharePoint 2016
- Report embedding. You can embed mobile and paginated reports into other web pages using iframes and URL parameters. You just add rs:Embed=true to the URL, insert it into an iframe and you're done.
- Modern paginated reports: you have maybe noticed in previous screenshots, but most defaults of charts have been updated to reflect a more modern style. More specifically, they are intended to look a lot like their Power BI counterparts. An example:
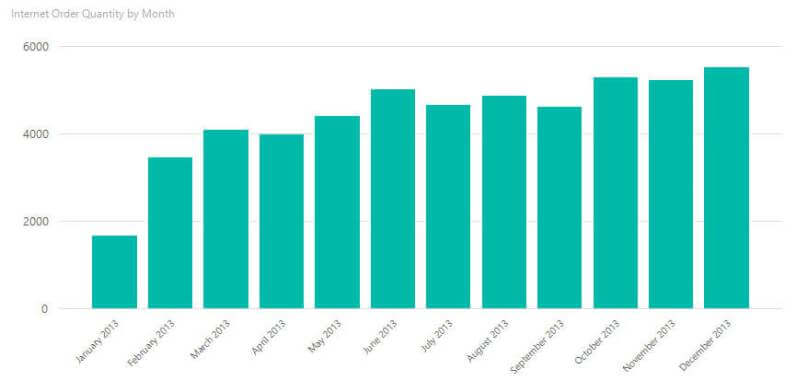
The only modification made to the screenshot above was changing the labels on the X-axis, so that they were all displayed.
Conclusion
In part 2 of the tip, we finished our overview of new features and capabilities of Reporting Services 2016. Along with the DataZen acquisition, it shows real investment from Microsoft into the Reporting Services product. There is now a strong mobile story and the foundations are set for a very bright future. Especially the integration between SSRS and Power BI is something to look forward to.
Next Steps
- Make sure you don't miss part 1 of this tip!
- Earlier tips about the new features discussed in this tip:
- Create a Treemap Graph in SQL Server Reporting Services 2016
- How to create a heat map graph in SQL Server Reporting Services 2016
- How to create a Sunburst Graph in SQL Server Reporting Services 2016
- SQL Server 2016 Reporting Services Mobile Report
- Create a basic KPI in SQL Server Reporting Services 2016
- Advanced KPI Configurations in SQL Server Reporting Services 2016
- Refresh the Data for a KPI in Reporting Services 2016
- Pinning a SQL Server Reporting Services Report to Power BI
- For more SQL Server 2016 tips, you can use this overview.
- The official documentation: What's New in Reporting Services.


About the author
 Koen Verbeeck is a seasoned business intelligence consultant at AE. He has over a decade of experience with the Microsoft Data Platform in numerous industries. He holds several certifications and is a prolific writer contributing content about SSIS, ADF, SSAS, SSRS, MDS, Power BI, Snowflake and Azure services. He has spoken at PASS, SQLBits, dataMinds Connect and delivers webinars on MSSQLTips.com. Koen has been awarded the Microsoft MVP data platform award for many years.
This author pledges the content of this article is based on professional experience and not AI generated.
View all my tips
