By: Jim Evans | Comments (5) | Related: > Microsoft Excel Integration
Problem
In this article I show a couple of very easy techniques for formatting data from SQL Server in Microsoft Excel that helps in analyzing results. In a previous article I demonstrated a technique for showing database activity based on transaction log activity. In this solution I will use a similar result set and show how to use Excel conditional formatting to make it interesting and easy to analyze the results showing the lows and highs of transaction log activity.
Solution
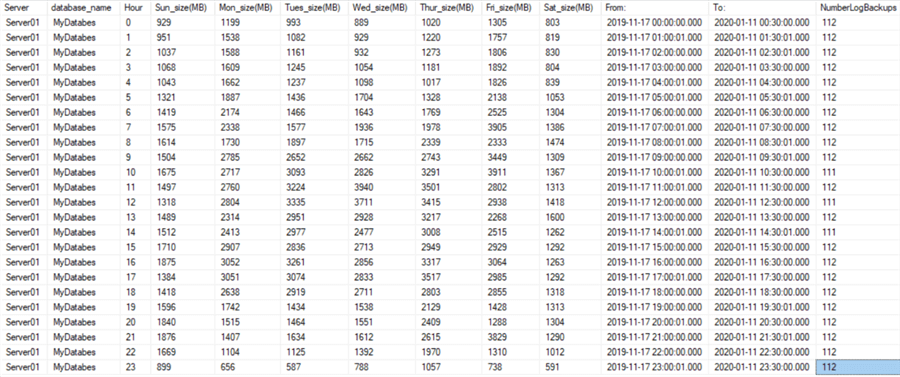
In this solution I will show how to take a vanilla result set that is hard to interpret, such as Example A below and easily turn it in to an interpretable visualization like Example B below.
Example A
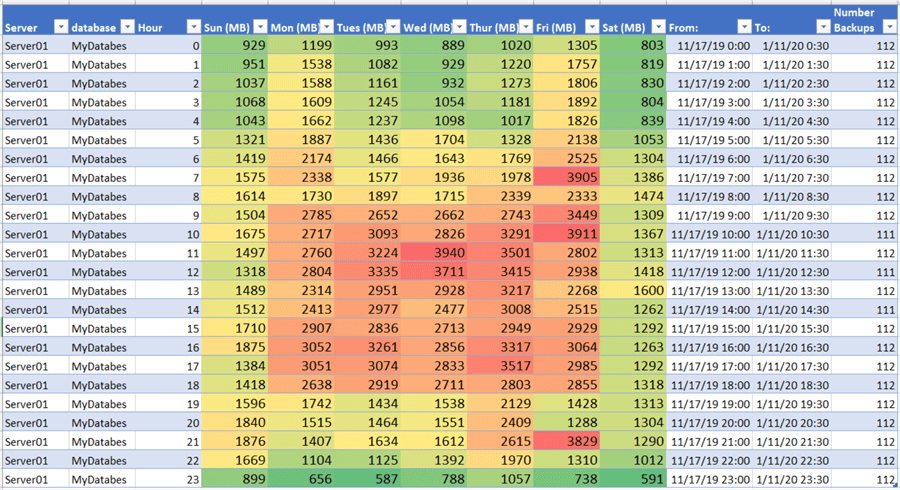
Example B
Step 1 – Activity Based on Transaction Log Size – Database Level
In this example I am using the SUM aggregate to get total transaction log backup sizes in MB rolled up by hour for each day of the week.
This has 2 parameters: (1) @NumWeeks which I will set to 8 weeks and (2) @Database which can be set to analyze a single database or set to NULL to analyze all the databases on a server with transaction log backups.
--Database LEVEL: SUM
--SUM: May be large for a large date range for analysis. this is my preferred over an 8 week period.
DECLARE @NumWeeks INT = 8 --<< SET the number of weeks to analyze.
DECLARE @Database nvarchar(100) = DB_Name() --'YourDBName'
SELECT
   @@servername as 'Server', --For all full recovery model DBs
   a.database_name,
   datepart(Hour,a.backup_start_date) as 'Hour',
   convert(INT, SUM(CASE WHEN datename(weekday,a.backup_start_date) = 'Sunday' THEN ceiling (a.backup_size/1048576.00) ELSE 0 END)) as 'Sun_size(MB)',
   convert(INT, SUM(CASE WHEN datename(weekday,a.backup_start_date) = 'Monday' THEN ceiling (a.backup_size/1048576.00) ELSE 0 END)) as 'Mon_size(MB)',
   convert(INT, SUM(CASE WHEN datename(weekday,a.backup_start_date) = 'Tuesday' THEN ceiling (a.backup_size/1048576.00) ELSE 0 END)) as 'Tues_size(MB)',
   convert(INT, SUM(CASE WHEN datename(weekday,a.backup_start_date) = 'Wednesday' THEN ceiling (a.backup_size/1048576.00) ELSE 0 END)) as 'Wed_size(MB)',
   convert(INT, SUM(CASE WHEN datename(weekday,a.backup_start_date) = 'Thursday' THEN ceiling (a.backup_size/1048576.00) ELSE 0 END)) as 'Thur_size(MB)',
   convert(INT, SUM(CASE WHEN datename(weekday,a.backup_start_date) = 'Friday' THEN ceiling (a.backup_size/1048576.00) ELSE 0 END)) as 'Fri_size(MB)',
   convert(INT, SUM(CASE WHEN datename(weekday,a.backup_start_date) = 'Saturday' THEN ceiling (a.backup_size/1048576.00) ELSE 0 END)) as 'Sat_size(MB)'
   ,MIN(a.backup_start_date ) as 'From:'
   ,MAX(a.backup_start_date ) as 'To:'
   ,COUNT(*) as 'NumberLogBackups'
FROM msdb.dbo.backupset a (NOLOCK)
WHERE a.type = 'L' --log backups
AND (a.database_name = @Database --Target Database
      OR @Database IS NULL)
AND a.backup_start_date >= DATEADD(WEEK, DATEDIFF(WEEK,-1,GETDATE())-1*@NumWeeks,-1)  --Note: -1 Starts us at Sunday.
AND a.backup_start_date < DATEADD(WEEK, DATEDIFF(WEEK,-1,GETDATE()),-1)
GROUP BY a.database_name,
  datepart(Hour,a.backup_start_date)
ORDER BY a.database_name,
  datepart(Hour,a.backup_start_date)
GO
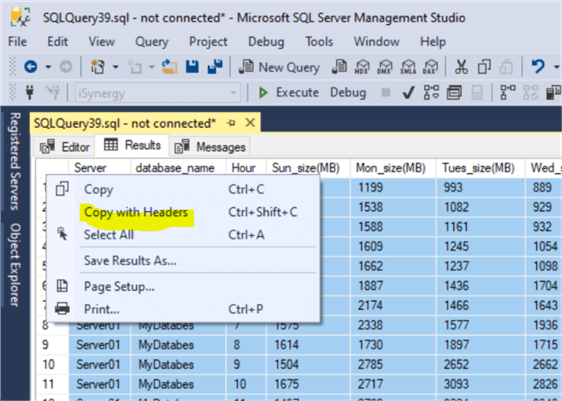
Step 2 – Copy the Results and Paste to Excel Workbook
After running the query with results to grid, click the upper left corner of the result set grid and select Copy with Headers.
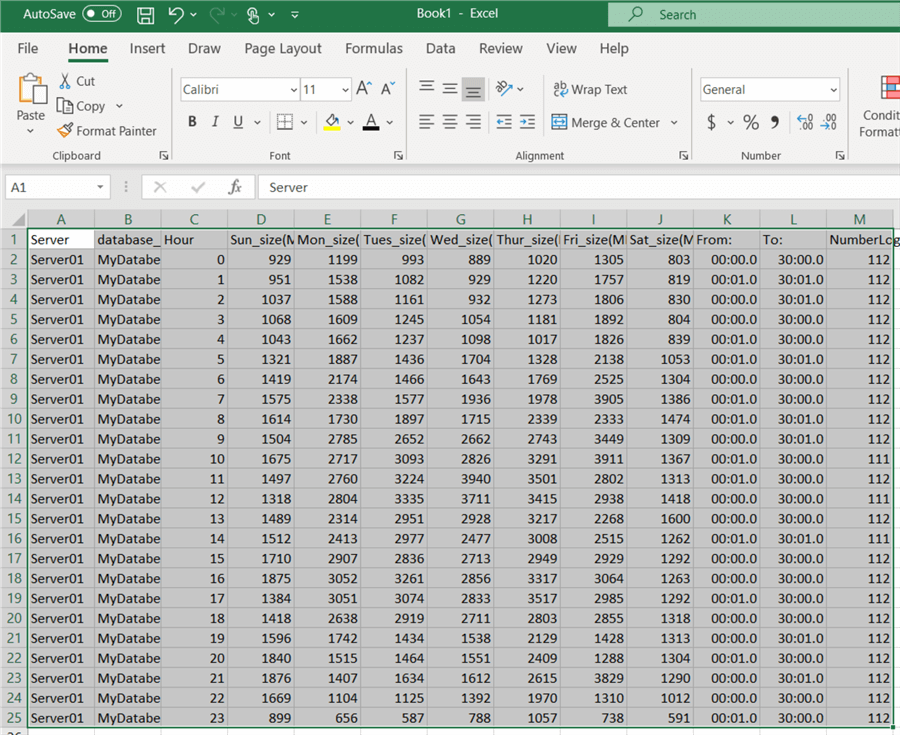
Step 3 – Paste the Results to Excel
Open Microsoft Excel and paste the results in cell A1.
Step 4 – Excel Standard Formatting to Table
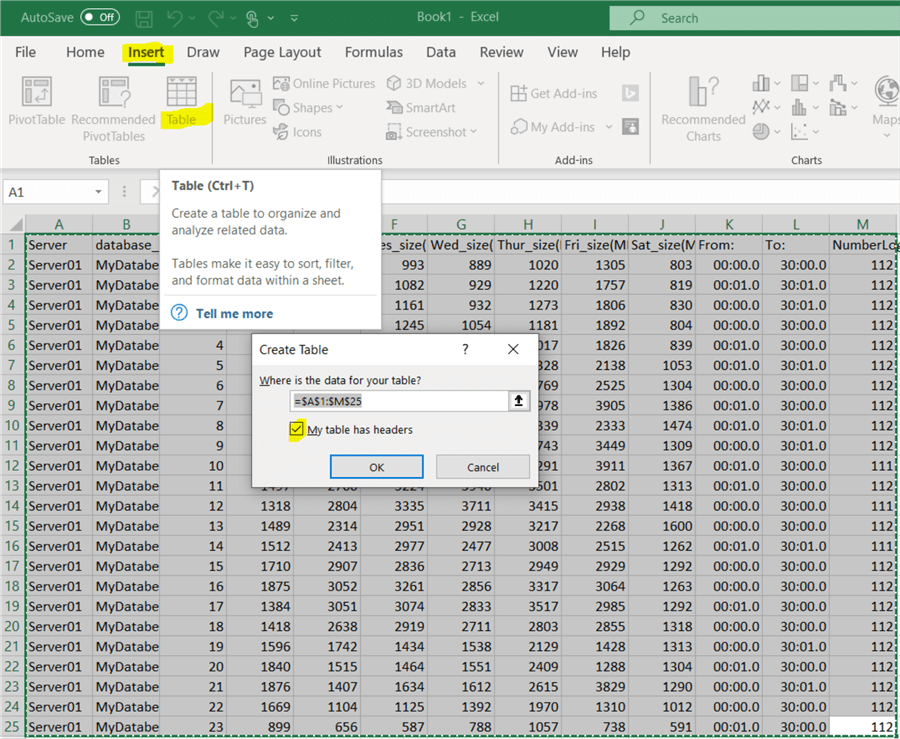
With the Results highlighted, select "Insert" from the top menu, then Table. In the Create Table dialog box check "My Table has headers". This turns your results into a nicely formatted table with alternating color rows and an automatic filter on each column.
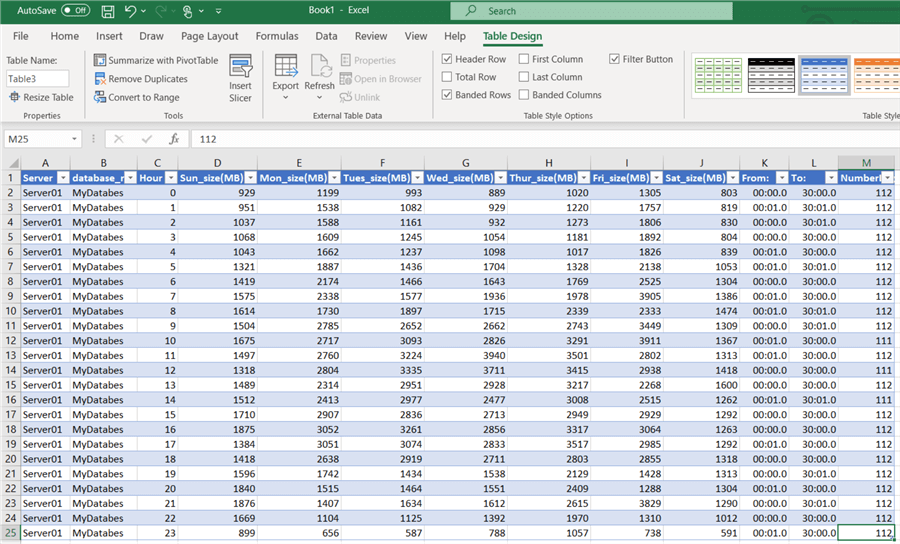
Below shows the formatted results. I do this often when I paste data into Excel.
Step 5 – Add Conditional Formatting
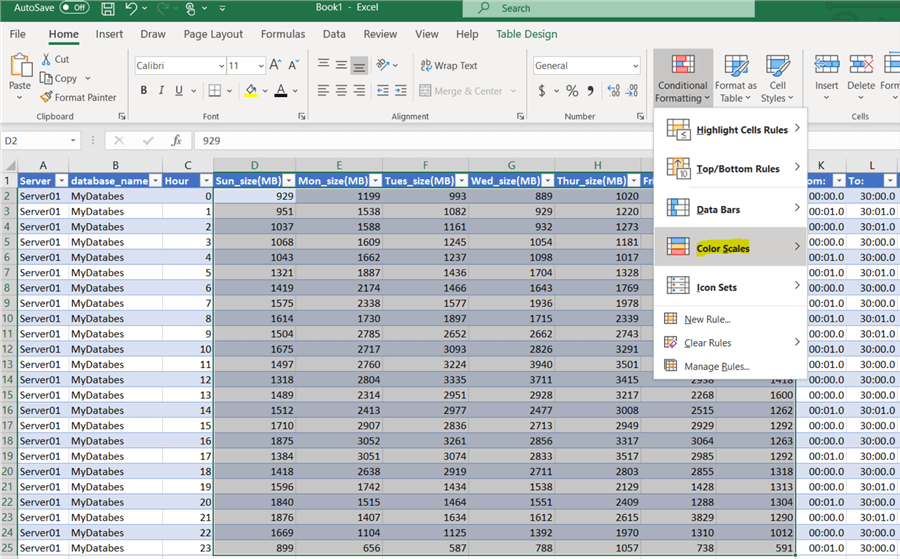
First highlight the data area to be formatted. In this case all the data that comprises of the Transaction Log sizes. With the Results highlighted, select the Home tab, select Conditional Formatting and then "Color Scales".
Step 6 – Add Conditional Formatting
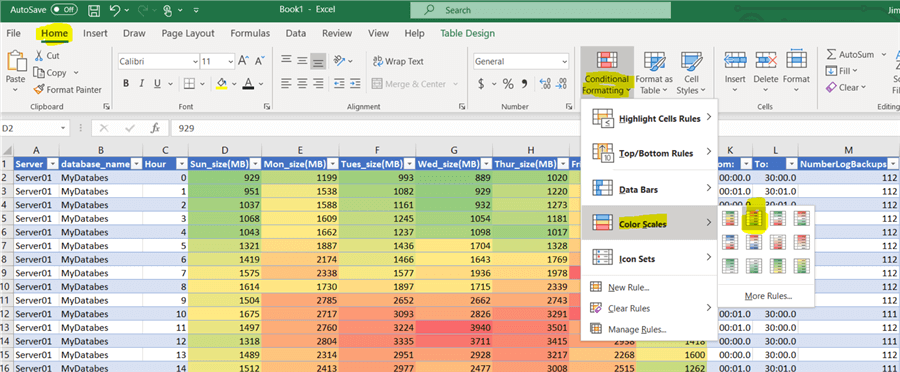
Next select the Color Scale Rules relevant for your results set. In this case I select from Red to Green with red showing highest intensity.
Final Results Conditional Formatting
Here are the final results.
I also, formatted dates in the From and To columns and shortened the Week day column names and adjusted the font size to make this easier to read. You can easily see the trends and the Hot Spots for the transaction log sizes each hour throughout the 8 weeks giving a visual of the normal weekly activity of the database.
Wrap Up
I hope you find this demo useful in visualizing your database traffic patterns. Certainly, you will be able to wow your co-workers when you share your results. Look for other results set where using conditional formatting will help visualize the results.
Next Steps
- Review my previous article: SQL Server Database Activity Based on Transaction Log Backup Size.
- Here is an Excel Charting example: Analyze Windows Performance Monitor Counters Using Excel.
- Read about SQL Server and Microsoft Excel Integration Tips.
- Learn more tips on Excel from Study material for exam 70-779 Analyzing and Visualizing Data with Microsoft Excel


About the author
 Jim Evans is an IT Manager currently for Crowe who has managed DBA, Developer, BI and Data Management teams for over 20 years.
This author pledges the content of this article is based on professional experience and not AI generated.
View all my tips
