By: Mircea Dragan | Comments | Related: > Microsoft Excel Integration
Problem
Data loading into a SQL Server table and extracting data from a SQL Server table is something that is done every day. Microsoft Excel is one of most popular programs on Windows for these tasks due to the fact that a spreadsheet is similar to a SQL table and makes it easy to input data in a table format, visualize data in a spreadsheet and process it for further needs.
Data exported to Excel is often used for presentations like charts. For example, if you have to present the sales evolution for a period, it is more effective to present a chart with that data rather than the data itself.
Consider the following data which represents sales for different items over several years:
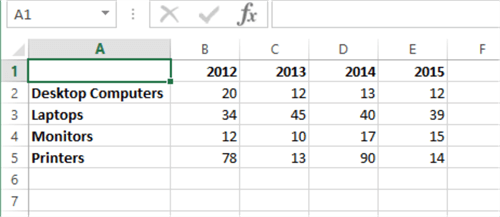
These numbers don’t show much information on the evolution of sales for upper management. People do not want to do a manual comparison of these numbers to extract the information they want. This is why we represent data in a chart:
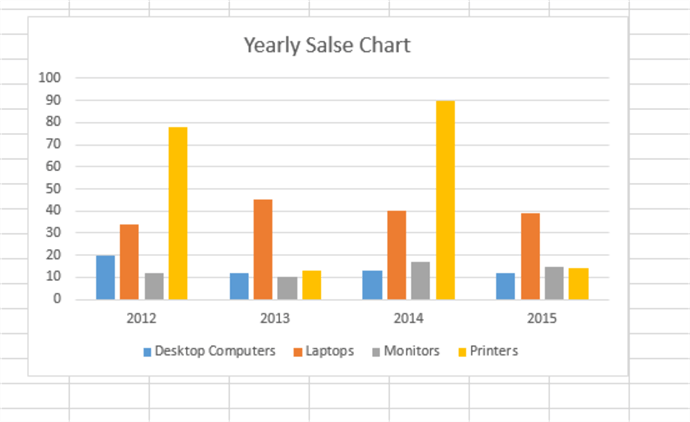
We can see that the raw data in the table now has a meaning.
Each chart is created based on the data it represents. It would be easier if we had a program which reads the data from a SQL table, exports it to an Excel sheet, and creates a chart of our choice from that data. This article aims to show you how to complete this process.
I used SQL Server 2019, Visual Studio 2019, and Microsoft Excel 2013. Some of the C# code will not work if you don’t use the latest .NET (minimum 4.8). The database I will use is northwind for SQL Server 2019 (see Northwind sample databases for SQL Server).
Solution
As presented in Export SQL Server Data to Multiple Excel Worksheets with C# one of the sheets contains the company’s organization structure. I will simplify this query and generate the company organization chart for the first 3 levels (CEO, level 1 and level 2) in a different sheet.
Export Company Organization Structure to Excel
The Excel file will be created on the desktop. If a previous file with the same name exists, it will be deleted.
The query which creates the company organization structure is similar to the one presented in Export SQL Server Data to Multiple Excel Worksheets with C#, but with less fields:
select
    employees.Name, employees.JobTitle,
    employees.OrganizationLevel,
    employees.Department,
    managers.name [Reports to],
    case when employees.JobTitle != managers.JobTitle
        then managers.JobTitle else '' end [Manager Job Title]
from
    (
        SELECT
            e.[BusinessEntityID],
            p.FirstName + case when p.MiddleName is not null
                then ' ' + p.MiddleName else '' end + ' ' + p.LastName [Name],
            e.[JobTitle], d.[Name] AS [Department], edh.[StartDate],
            case when e.OrganizationLevel is null
                then 0 else e.OrganizationLevel end OrganizationLevel,
            case when e.OrganizationNode is null
                then '/' else e.OrganizationNode.GetAncestor(1).ToString() end OrganizationNode
        FROM Person.Person p
            join HumanResources.Employee e on e.BusinessEntityID = p.BusinessEntityID
            JOIN [HumanResources].[EmployeeDepartmentHistory] edh
                ON e.[BusinessEntityID] = edh.[BusinessEntityID]
            JOIN [HumanResources].[Department] d ON edh.[DepartmentID] = d.[DepartmentID]
        WHERE edh.EndDate IS NULL
    ) employees
    join
    (
        SELECT
            e.[BusinessEntityID],
            p.FirstName + case when p.MiddleName is not null
                then ' ' + p.MiddleName else '' end + ' ' + p.LastName [Name],
            e.[JobTitle], d.[Name] AS [Department], edh.[StartDate],
            case when e.OrganizationLevel is null
                then 0 else e.OrganizationLevel end OrganizationLevel,
            case when e.OrganizationNode is null
                then '/' else e.OrganizationNode.ToString() end OrganizationNode
        FROM Person.Person p
            join HumanResources.Employee e on e.BusinessEntityID = p.BusinessEntityID
            JOIN [HumanResources].[EmployeeDepartmentHistory] edh
                ON e.[BusinessEntityID] = edh.[BusinessEntityID]
            JOIN [HumanResources].[Department] d ON edh.[DepartmentID] = d.[DepartmentID]
        WHERE edh.EndDate IS NULL
    ) managers
    on employees.OrganizationNode = managers.OrganizationNode
group by employees.department, employees.JobTitle, employees.OrganizationLevel,
    managers.name,
    managers.JobTitle,
    employees.[name], employees.BusinessEntityID, employees.StartDate
order by employees.OrganizationLevel,  employees.JobTitle
We export this query to a sheet named "Company Organization Structure". As you can see, the query still gives us the full organization structure. This structure is too big to be included in an organization chart (the chart will be huge and hardly visible on the screen). So, I will represent only the first 3 levels (levels 0, 1 and 2 as you get from the query) of the organization, CEO being on level 0.
In order to create the organization chart, we need to collect the first 3 levels of the organization structure. We will use a list for that:
List<List<string>> topExec = new List<List<string>>();
We store CEO name in a string and collect other managers’ details in the above list while we fill up the organization sheet:
while(drmanager.Read())
{
    for(int j = 1; j <= drmanager.FieldCount; ++j)
    {
        xlsManagers.Cells[i, j] = drmanager.GetValue(j - 1);
    }

    // Check for CEO and level 1 and 2 in the company
    int level = drmanager.GetInt32(2);
    if(level == 0) // CEO
        ceo = drmanager.GetString(0);
    else if(level == 1 || level == 2)
    {
        topExec.Add(new List<string>()
        {
            drmanager.GetString(0),
            drmanager.GetString(1),
            level.ToString(),
            drmanager.GetString(4)
        });
    }
    ++i;
}
drmanager.Close();
Once we have information about the managers, we can create the company organization chart.
Create the Company Organization Chart
If you have ever tried to manually create a company organization chart from existing data, you are aware it can take a lot of time to complete. If you have never done it, consider that it may take a few hours to create the chart manually for the data in this example.
Excel 2013 has 151 types of charts. When we want to create a chart in C# for example, we refer to that chart by its index in an array called SmartArtLayouts. This array is 1-based (index starts from 1, not from 0 like in a C# array). Later versions of Excel (including Excel 365) might have a different number of charts, but I think (I haven’t tested) that the charts which already exist in Excel 2013 are the same in later Excel versions. What makes me believe this? The compatibility of Excel files. When you create a chart in Excel 2013 and open it in a later version of Excel, you will see the same type of chart. I might be wrong, so please correct me in the comments.
There is no relation between the charts you can access in Excel by using menus and the order of them in the array. In order to create the organization chart, I have to get the name of all the charts and see which one I want to use. The predefined charts which exist in Excel can be obtained in C# with a code such as:
for(int j = 1; j <= xlsApp.SmartArtLayouts.Count; ++j)
{
    Office.SmartArtLayout l = xlsApp.SmartArtLayouts[j];
    Excel.Shape sh = xlsSmartArt.Shapes.AddSmartArt(l, 5, 5, 6, 6);
    Office.SmartArt sm = sh.SmartArt;
    if(sh.HasSmartArt == Office.MsoTriState.msoTrue)
    {
        xlsManagers.Cells[i + j, 1] = j;
        xlsManagers.Cells[i + j, 2] = sm.Layout.Category;
        xlsManagers.Cells[i + j, 3] = sm.Layout.Name;
    }
}
This code will create a list with predefined charts including index, category, and chart name (this name is what you see when you access a chart using Excel menus). It looks like:
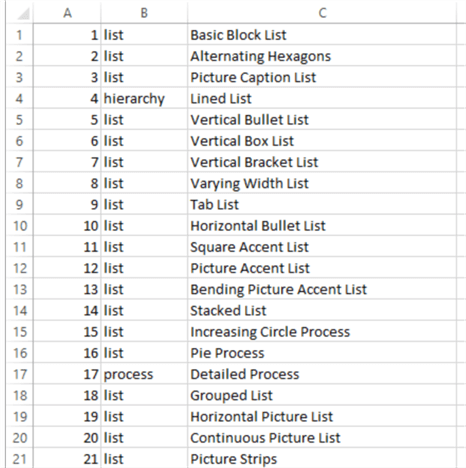
I will attach an Excel file with all charts (the output produced by the code above).
The organization chart I choose is "Horizontal Hierarchy" and has the index 106. We create this chart in a different sheet with a code such as:
// Create the SmartArt Horizontal Hierarchy
xlsSmartArt = (Excel.Worksheet)xlsWorkbook.Sheets[2];
xlsSmartArt.Name = "Company Organization Chart";
xlsManagers.Cells[1, 1] = "Company Organization Chart";
Excel.Range rangeChart = xlsManagers.get_Range("A1", "H1");
rangeChart.Merge(1);
rangeChart.Borders.Color = Color.Black.ToArgb();
rangeChart.Interior.Color = Color.Yellow.ToArgb();
rangeChart.Font.Name = "Courier New";
rangeChart.Font.Size = 14;
rangeChart.Cells.HorizontalAlignment = Excel.XlHAlign.xlHAlignCenterAcrossSelection;

Office.SmartArtLayout layout = xlsApp.SmartArtLayouts[106]; // SmartArt Horizontal Hierarchy index
Excel.Shape shape = xlsSmartArt.Shapes.AddSmartArt(layout, 50, 50, 700, 2000);
shape.AlternativeText = "Company Org Chart";

if(shape.HasSmartArt == Office.MsoTriState.msoTrue)
{
    Office.SmartArt smartArt = shape.SmartArt;
    Office.SmartArtNodes allNodes = smartArt.AllNodes;
    Office.SmartArtNode ceoNode = null;
The if statement above is left open intentionally because I still need to comment the code inside it.
When we create the chart, the template fills in with several default nodes. We will need to remove them before building up our chart:
// Remove the nodes added by the template
foreach(Office.SmartArtNode node in allNodes)
{
    if(node.Level != 1)
    {
        node.Delete();
    }
    else
    {
        ceoNode = node;
        ceoNode.TextFrame2.TextRange.Text = ceo + "\n" + "Chief Executive Officer";
    }
}
As you can see, we create the first level node and call it ceoNode. The next level (level 1) is created by adding the level 1 managers to this node. Keep track of the nodes we create on level 1 because we need to add to each node on the next level (level 2) nodes. In other words, we want to add to each person who reports to the CEO and the people who report to them (or the persons they managed directly).
// For each person in level 1 create a node
List<Office.SmartArtNode> level1 = new List<Office.SmartArtNode>();
foreach(List<string> list in topExec)
{
    if(list[2] == "1")
    {
        Office.SmartArtNode node = ceoNode.AddNode(Office.MsoSmartArtNodePosition.msoSmartArtNodeBelow);
        node.TextFrame2.TextRange.Text = list[0] + "\n" + list[1];
        level1.Add(node);
    }
}
The next step is quite easy and similar to the previous one:
// Add level 2 people
foreach(List<string> list in topExec)
{
    if(list[2] == "2")
    {
        foreach(Office.SmartArtNode node in level1)
        {
            string text = node.TextFrame2.TextRange.Text;
            text = text.Substring(0, text.IndexOf('\n'));
            if(text == list[3])
            {
                Office.SmartArtNode node2 = node.AddNode(Office.MsoSmartArtNodePosition.msoSmartArtNodeBelow);
                node2.TextFrame2.TextRange.Text = list[0] + "\n" + list[1];
            }
        }
    }
}
After this step we can save the Excel file.
As an exercise, you can try to generate different charts with the data of your choice.
Attached files
I attach the C# project used, the Excel file which contains data generated by the projects, and the Excel file which contains all Excel charts for Excel 2013.
References
- https://www.dotnetperls.com/excel
- Export SQL Server Table to Excel with C#
- https://docs.microsoft.com/en-us/sql/relational-databases/tables/lesson-1-converting-a-table-to-a-hierarchical-structure?view=sql-server-ver15
- Export SQL Server Data to Multiple Excel Worksheets with C#
Next Steps
- Do some computation in the Excel file with exported data
- Generate simple reports in Excel with the exported data


About the author
 Mircea Dragan is a Senior Computer Scientist with a strong mathematical background with over 18 years of hands-on experience.
This author pledges the content of this article is based on professional experience and not AI generated.
View all my tips
