By: Joe Gavin | Updated: 2021-08-20 | Comments | Related: > Monitoring
Problem
How do I obtain data and interpret the results of some commonly used SQL Server related Performance Monitor Counters?
Solution
We've seen how to create and run a Perfmon Collector Set to capture real-time performance information. Now, we'll look at some output, metrics and values to look for when troubleshooting.
Objects / Counters
The following table has a list of Perfmon Objects / Performance Counters commonly used to review SQL Server performance along with their descriptions and a guide of expected values.
| Perfmon Object | Perfmon Counter | Counter Description | What to Look For |
|---|---|---|---|
| Memory | Available MBytes | Available MBytes is the amount of physical memory, in Megabytes, immediately available for allocation to a process or for system use. | Should remain fairly constant and probably not go below 4096 MB or so. May indicate 'max server memory' left at default, non-SQL Server applications running on server |
| Processor | % Processor Time | % Processor Time is the percentage of elapsed time that the processor (CPU) spends to execute a non-Idle thread. | % Processor Time will vary quite a bit on an active server. Spikes to 100% aren't uncommon but if it's over 70% or so for any length of time your users are probably experiencing performance issues. Missing or no indexes on a table being queried could be the culprit. |
| SQLServer:Access Methods | Forwarded Records/sec | Number of records fetched through forwarded record pointers | Ideally close to 0. |
| SQLServer:Access Methods | Full scans/sec | Number of unrestricted full scans. These can either be base table or full index scans | Less than 1 preferred. |
| SQLServer:Access Methods | Page Splits / Sec | Number of page splits per second that occur as a result of overflowing index pages | Should be less than 20% of Batch Requests/Sec. |
| SQLServer:Buffer Manager | Buffer Cache hit ratio | Percentage of pages that were found in the buffer pool without having to incur a read from disk | You would like to see this steady at or close to 100%. Less could indicate not enough memory on server or allocated to SQL Server. |
| SQLServer:Buffer Manager | Checkpoint Pages / Sec | Number of pages flushed by checkpoint or other operations that require all dirty pages to be flushed | Benchmark for comparison. |
| SQLServer:Buffer Manager | Page life expectancy | Number of seconds a page will stay in the buffer pool without references | Rule of thumb is this should not go below 300ms. |
| SQLServer:General Statistics | User Connections | Number of users connected to the system. | Used as a benchmark value to see if the average number increases over time indicating more activity. |
| SQLServer:Locks | Average Wait Time (ms) | The average amount of wait time (milliseconds) for each lock request that resulted in a wait | Ideally should be 0. |
| SQLServer:Locks | Lock Waits / Sec | Number of lock requests that could not be satisfied immediately and required the caller to wait before being granted the lock | Ideally should be 0. |
| SQLServer:Memory Manager | Memory Grants Pending | Current number of processes waiting for a workspace memory grant | Ideally should be 0. |
| SQLServer:Memory Manager | Target Server Memory (KB) | Ideal amount of memory the server is willing to consume | Total Server Memory (KB) / Target Server Memory (KB) should be approximately 1. |
| SQLServer:Memory Manager | Total Server Memory (KB) | Total amount of dynamic memory the server is currently consuming | Total Server Memory (KB) / Target Server Memory (KB) should be approximately 1. |
| SQLServer:SQL Statistics | Batch Requests/Sec | Number of SQL batch requests received by server | Benchmark of server activity. |
| SQLServer:SQL Statistics | SQL Compilations/Sec | Number of SQL compilations | Should be at 10% or less than total Batch Requests/sec. |
| SQLServer:SQL Statistics | SQL Re-Compilations/Sec | Number of SQL re-compilations | Should be at 10% or less than total Batch Requests/sec. |
View Performance Data
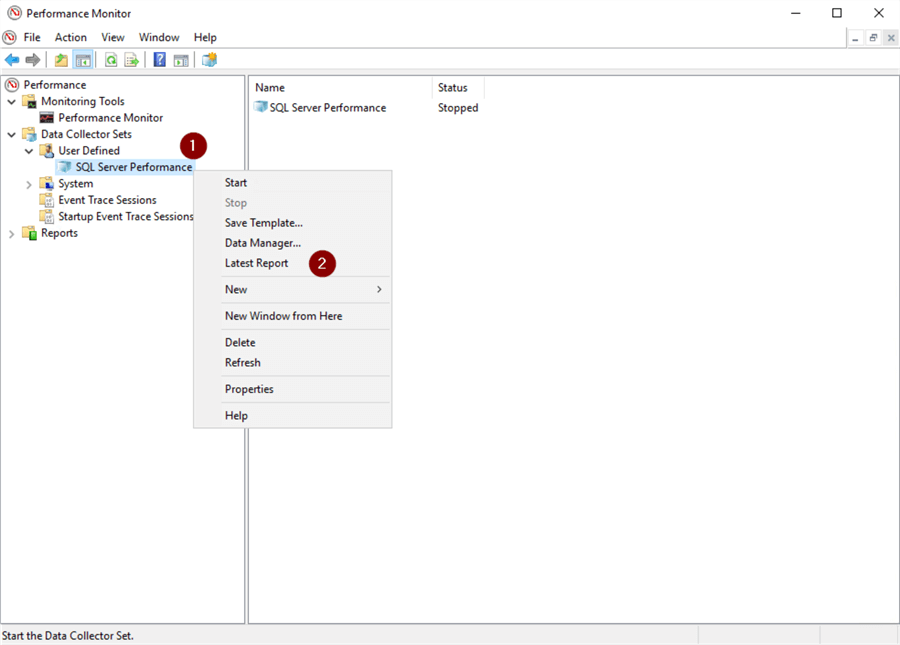
Go to our previously created and run Collector Set.
- Right click
- Latest Report
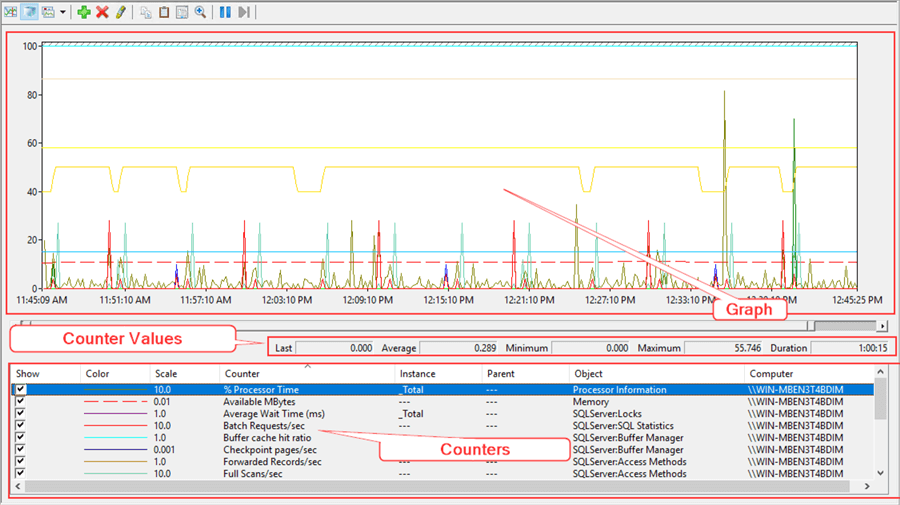
Here we see data collected on a particular day from 11:45AM to 12:45PM. The top part of the screen is a graphical representation of each Counter. Right below that are the values for the selected Counter. And the bottom is where we select Counters.
It's time to look at two examples.
Example #1
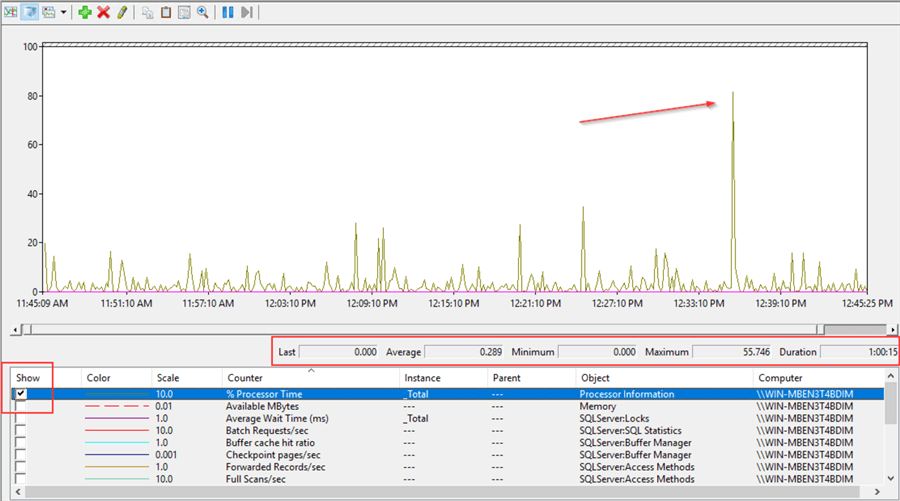
Here I've unchecked all the Show boxes except for % Processor Time to show a cleaner graphical representation. Looking at the numbers on the bottom we see that that the minimum was 0%, maximum was 55.746% and the average was 0.289%. Looking at the graph confirms the numbers and as we see there was a very short spike around 12:35PM, but it was otherwise low.
Example #2
Refer to the Perfmon Object / Counter table for the next example and we see that in order to figure out if the SQL Compilations/Sec and SQL Re-Compilations/Sec are below the threshold that we need to obtain the value of Batch Requests/sec.
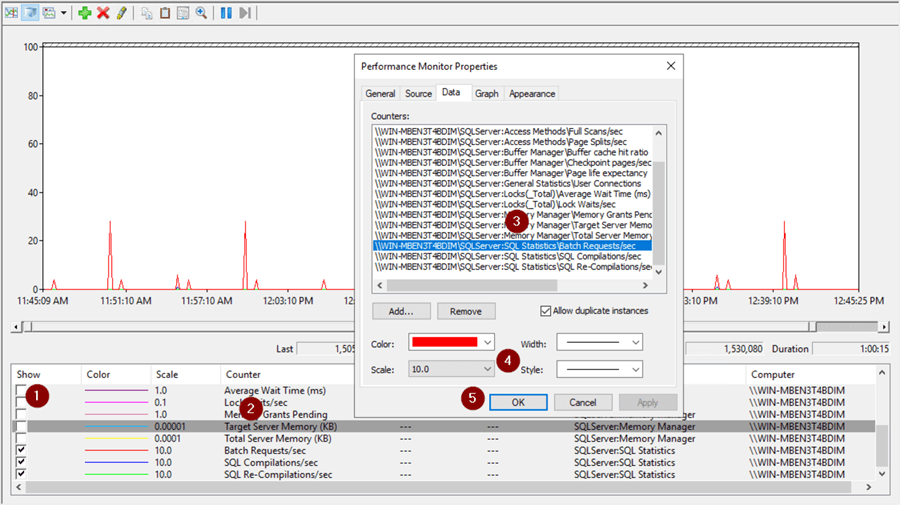
- Uncheck all but the 3 Counters in question
- Right click in Counters area
- Select each of the 3 Counters individually
- Select scale that fits the line within the screen area in dropdown for Batch Requests/sec and match it for SQL Compilations/Sec and SQL Re-Compilations/Sec
- OK
Looking at the graph we see Batch Requests/Sec is the only Counter easily visible. SQL Compilations/Sec and SQL Re-Compilations/Sec are barely visible the bottom. By eye that indicates they're both well below the 10% threshold.
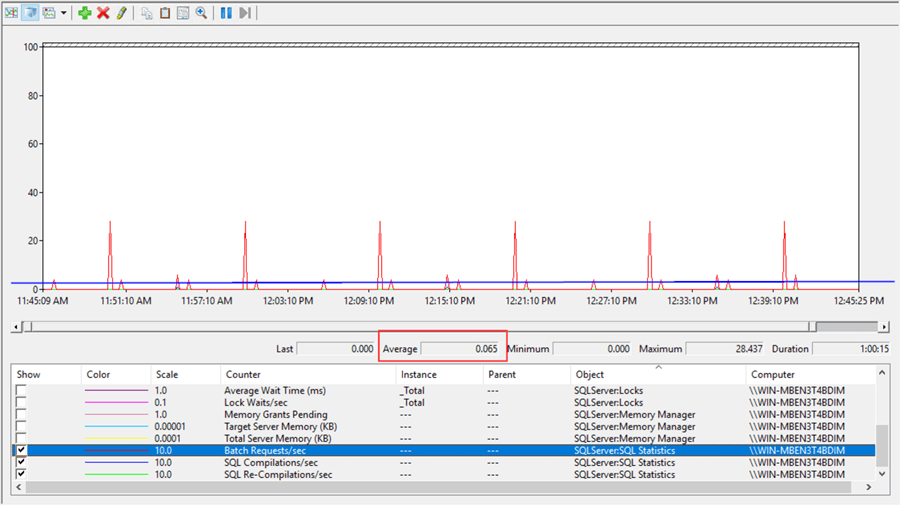
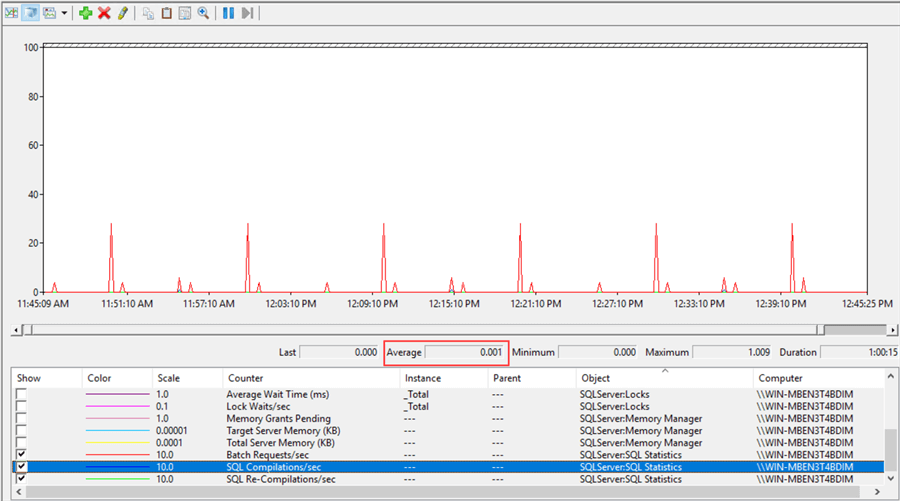
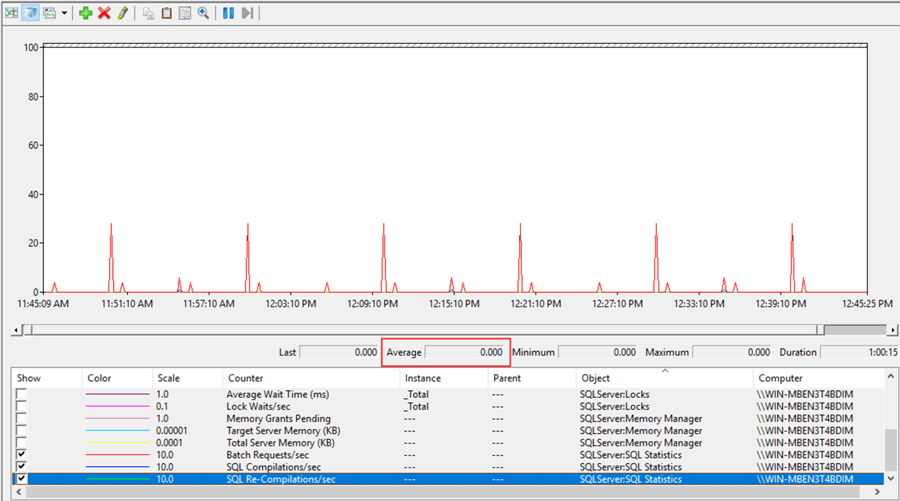
To confirm, select Average Batch Requests/sec and it's is 0.065. 10% of 0.065 is 0.0065. Select SQL Compilations/Sec and the average is 0.001. Select SQL Re-Compilations/Sec and the average is 0.00. Both of these values are less than 0.0065 so we're within range.
Export Perfmon Data to a .csv File
You may prefer to view and analyze the Perfmon data in a spreadsheet. Perfmon gives us the ability to export it to a .csv file.
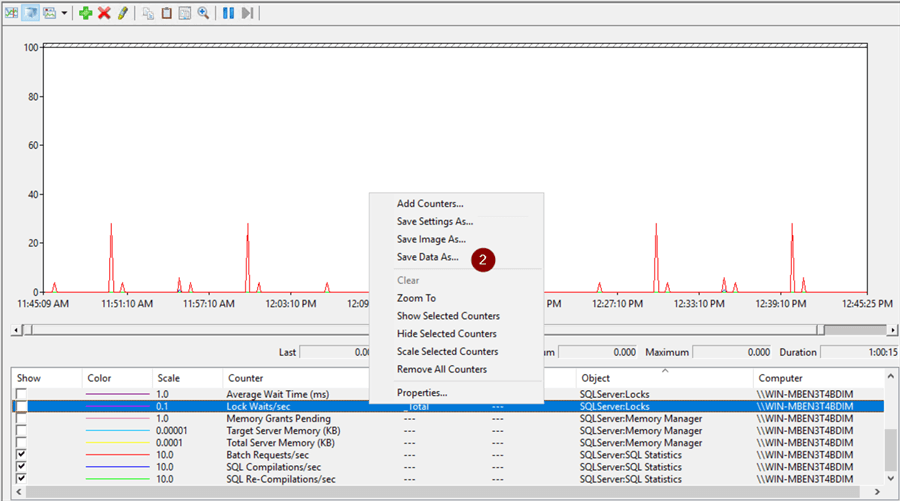
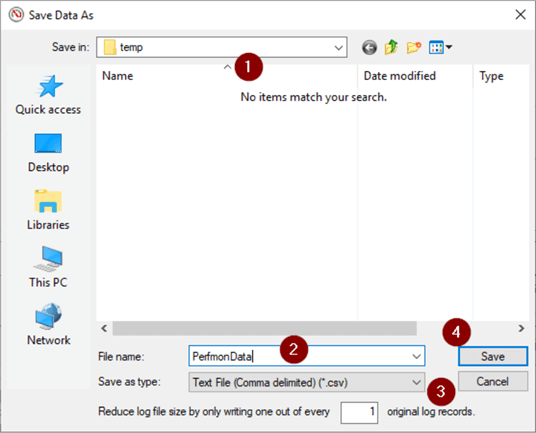
- Right click anywhere
- Save Data As…
- Choose location
- Name file
- Select 'Text File (Comma delimited)(.csv)' in dropdown
- Save
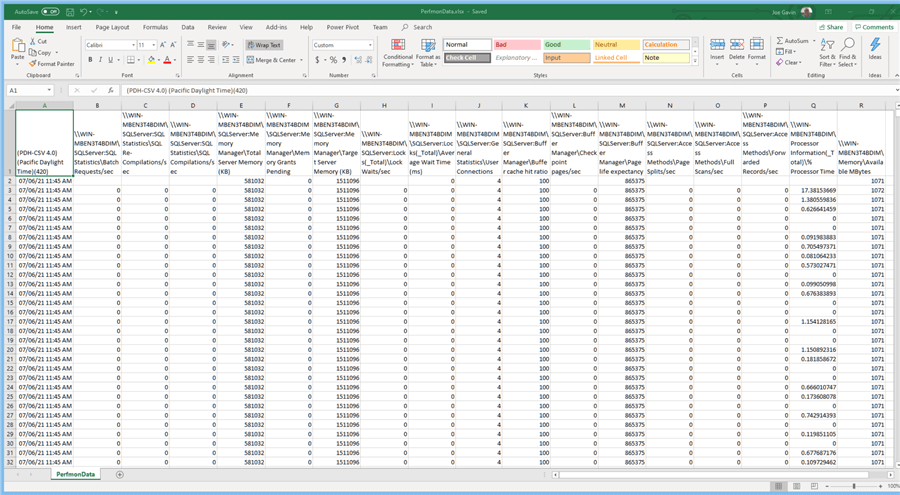
After some formatting to make it a little more readable and saving to a .xlsx it's ready for some slicing and dicing.
Next Steps
We've seen how to view Perfmon data and configure some options to make viewing it a bit easier for some general SQL Server related Counters.
Stay tuned for a tip on looking at Perfmon data in some more specific areas.
Here are some links with further information.
- Introduction to Microsoft Windows Performance Monitor for SQL Server
- Windows Performance Monitor Tutorial
- Setting a Fixed Amount of Memory for SQL Server
- SQL Server Performance Tuning with Query Plans and New Indexes
- How to Identify Microsoft SQL Server Memory Bottlenecks


About the author
 Joe Gavin is from the Greater Boston area. He started working with SQL Server and Sybase in 1998 in the financial services industry and has been a SQL Server Database Administrator for a dairy cooperative since 2011. He graduated from Northeastern University in Boston with a Bachelor of Science in Engineering Technology (BSET) degree in Computer Technology. Joe has spoken at the Boston and Providence SQL Saturday events.
 This author pledges the content of this article is based on professional experience and not AI generated.
View all my tips
Article Last Updated: 2021-08-20
