By: Joe Gavin | Updated: 2021-09-27 | Comments | Related: > Monitoring
Problem
How do I use Windows Performance Monitor to look for disk related SQL Server issues?
Solution
So far, we've seen how to review some general SQL Server and memory related Performance Monitor output. Now that we'll look at some disk related counter output.
Objects / Counters
The following table has a list of Perfmon Objects / Counters related to disk performance with their descriptions and a guide of expected values. As with any Perfmon data we're using the output as a benchmark. It's not a direct link to a certain problem but the data is useful to see when we need to see what areas to start looking at and to see what changes improve, or hopefully not degrade performance.
| Perfmon Object | Perfmon Counter | Counter Description | What to Look For |
|---|---|---|---|
| Physical Disk | Avg. Disk sec/Read | Average time, in seconds, of a read of data from the disk | This Counter should ideally be under 15 milliseconds. It should not exceed 50 milliseconds. |
| Physical Disk | Avg. Disk sec/Write | Average time, in seconds, of a write of data to the disk | This Counter should ideally be under 15 milliseconds. It should not exceed 50 milliseconds. |
| Physical Disk | Disk Reads/sec | Rate of read operations on the disk | This Counter should ideally be under 15 milliseconds. It should not exceed 50 milliseconds. |
| Physical Disk | Disk Writes/sec | Rate of write operations on the disk | This Counter should ideally be under 15 milliseconds. It should not exceed 50 milliseconds. |
Add Counters
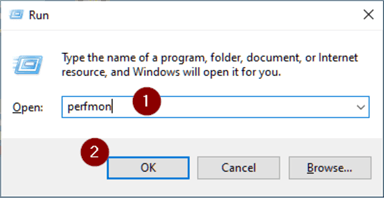
Windows Key + R: to open the Run menu.
- Enter perfmon in the run box
- OK
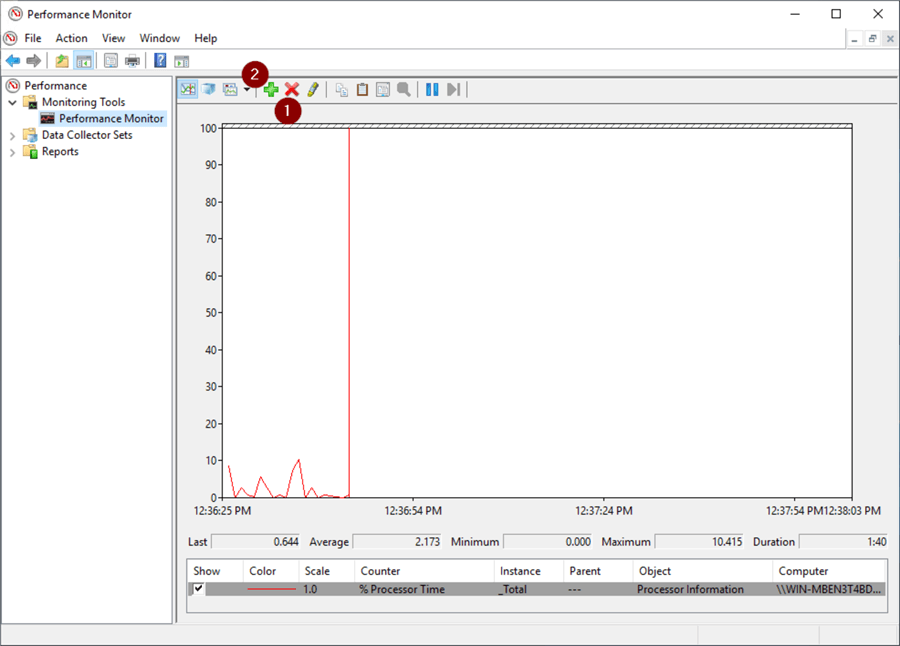
Click the 'X' symbol to remove default % Processor Time counter (This is an optional step. I just find it easier to have as clean an output as possible.)
- Click the 'plus symbol' to bring up 'Add Counters' screen and start adding counters
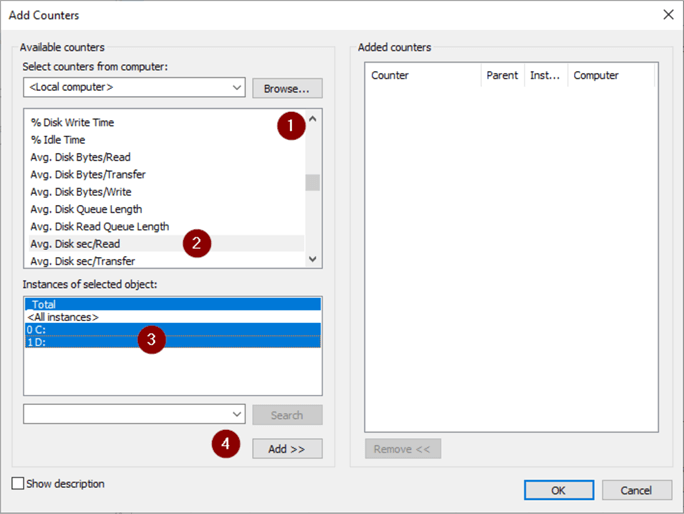
- Scroll down to and Click the PhysicalDisk dropdown in the Perform Objects box
- Scroll down and select Avg. Disk sec/Read
- Select drives
- Add
- Select Avg. Disk sec/Read
- Highlight drive letters
- Add
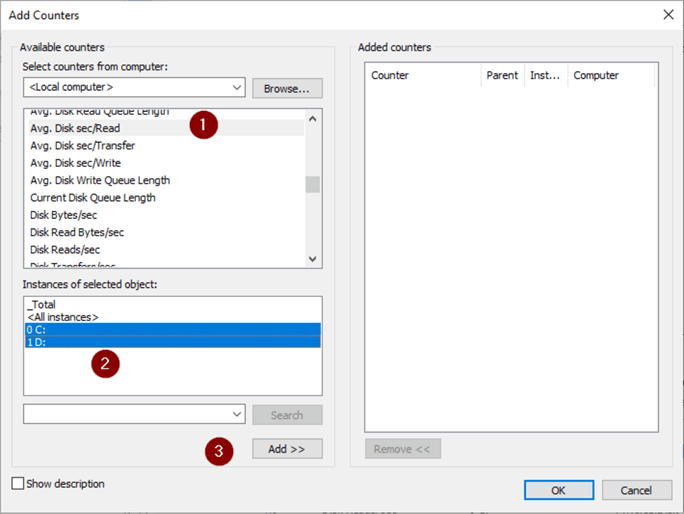
Repeat the process for Disk Reads/sec and Disk Writes/sec then click OK
Create Collector Set
To save the added Counters we'll save them to a Collector Set. This will let run the Counters without having to re-add them and also run on a schedule.
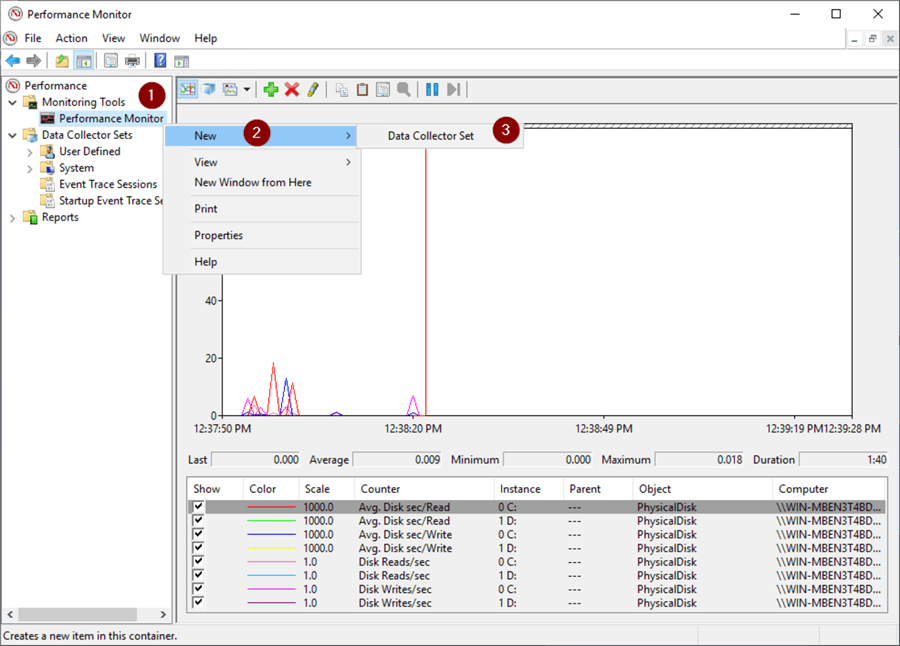
- Right click Performance Monitor
- New
- Data Collector Set
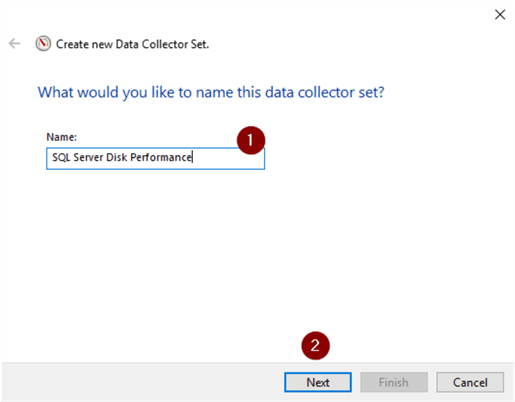
- Enter a name (I chose SQL Server Disk Performance, but you can call it anything that makes sense to you.)
- Next
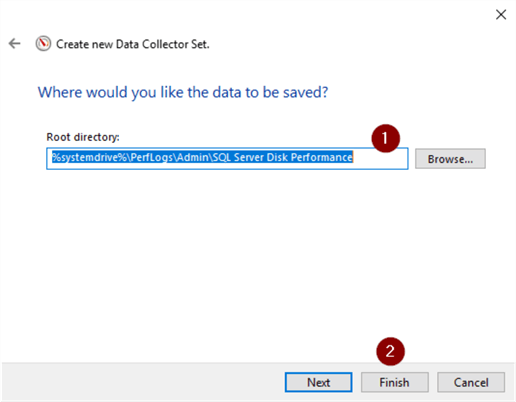
- Accept or change directory
- Finish
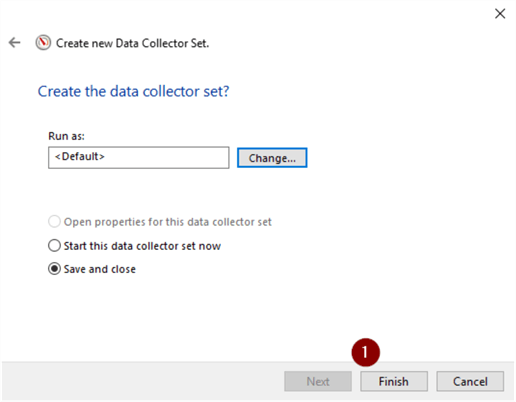
- Finish
Run Collector Set
Run the Collector set to start gathering data.
- Expand User Defined dropdown
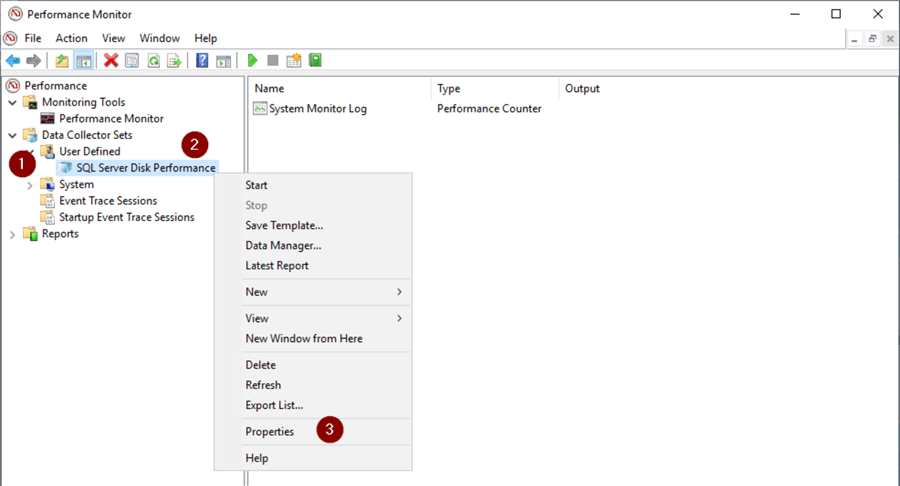
- Right click on Collector Set
- Properties
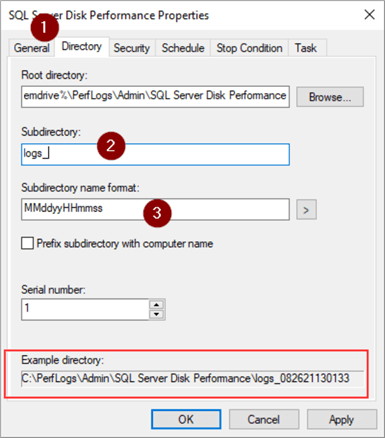
- Directory tab
- Enter name of subdirectory
- Enter MMddyymmss in 'Subdirectory name format:' files (This will let you create a new file for every time the Collector Set is run. Otherwise you'll get an error saying 'When attempting to start the Data Collector Set the following system error occurred: Cannot create a file when that file exists.).
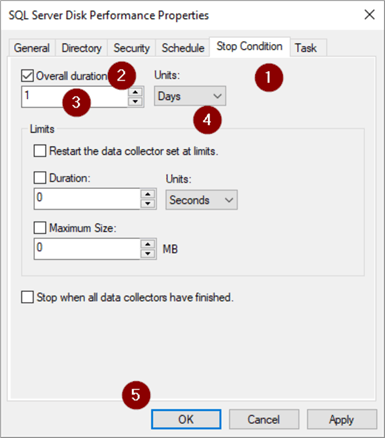
We're going to manually start the Collector Set so just need to tell it how long to run.
- 'Stop Condition' tab
- Check 'Overall duration'
- Select number of units to run
- Select units to run
- OK
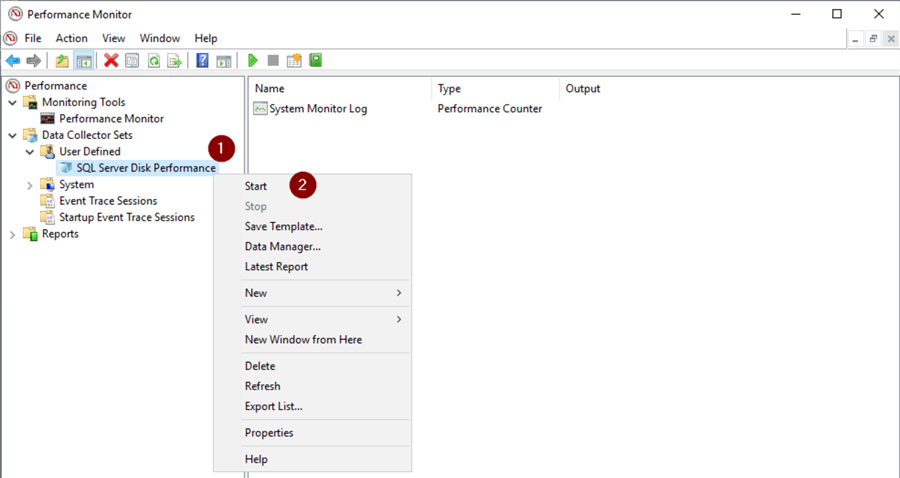
- Right click on Collector Set
- Start
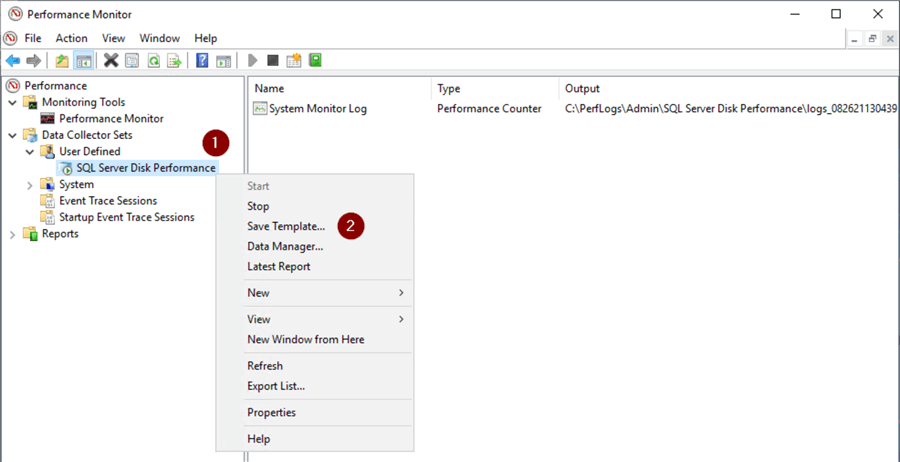
Save Collector Set to Template
To be able to import the Collector Set to another Windows machine we can save it to a template.
- Right click on Collector Set
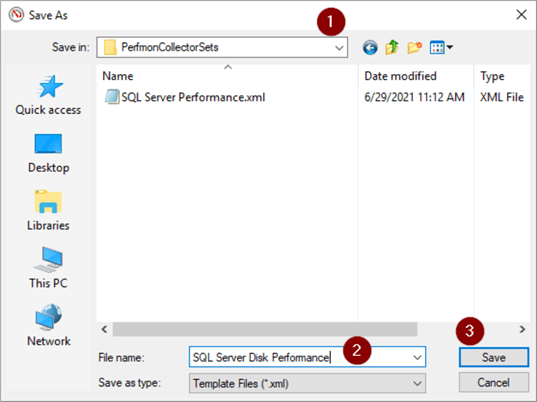
- 'Save Template…'
- Select file location
- Name file
- Save
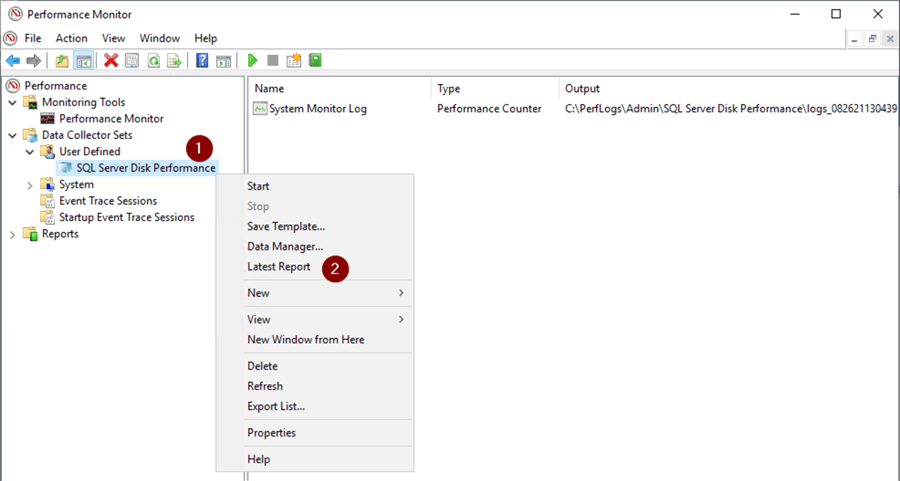
View Performance Data
24 hours have passes and it's time to view the performance data.
- Right click on Collector Set
- Latest Report
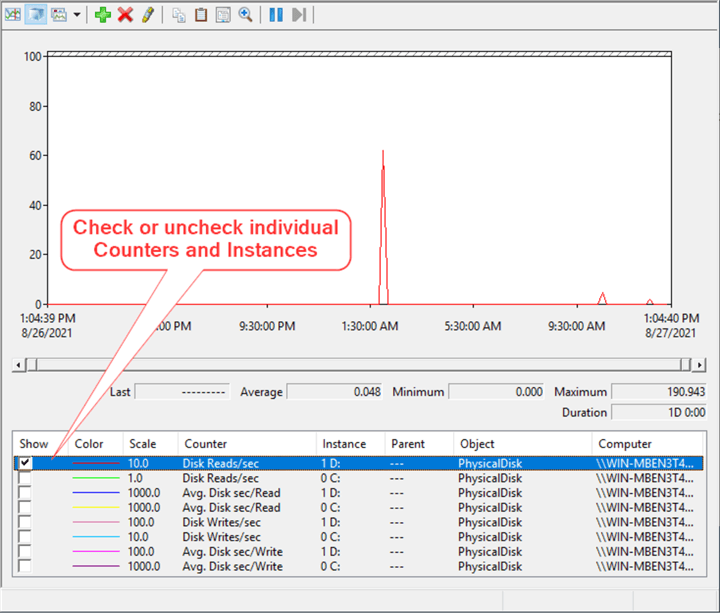
The graphical representation of the data is in the top part of the window and we can click on each Counter and drive to get data for each in the bottom.
The average Disk Reads/sec for the D:\drive is 0.048 seconds = 48 milliseconds. This is approaching the high end of 50 milliseconds and would indicate slow disk performance on this server that needs to be investigated further. I'm running this on a Windows 2019 virtual machine hosted on a laptop so I'm not expecting a whole lot of performance. If this were a real server, it would be time to discuss with the storage team.
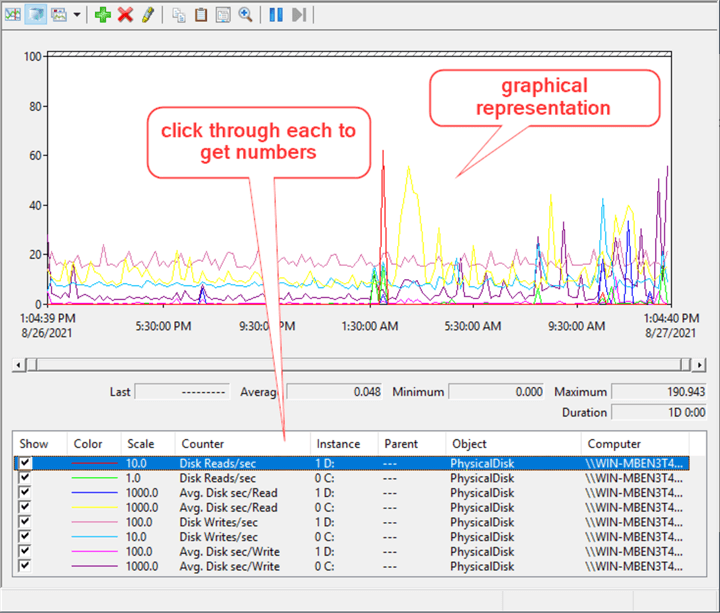
All the boxes in the Show column can be left checked if you want to view them all together for comparison. Check or uncheck individual Counters and Instances to get a simpler graphical of each.
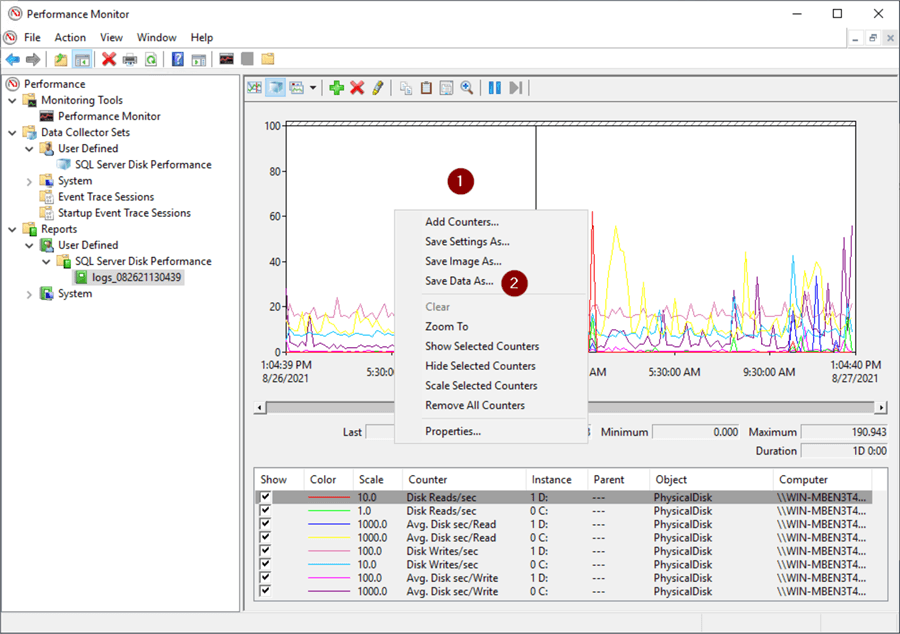
Export Perfmon Data to a .csv File
Depending on how many Counters you're looking at it may be preferable to view and analyze the Perfmon data in a spreadsheet. This will allow filtering and sorting data as well as creating you own graphs. To get started we'll export the data collected to a .csv file.
- Right click anywhere
- Save Data As…
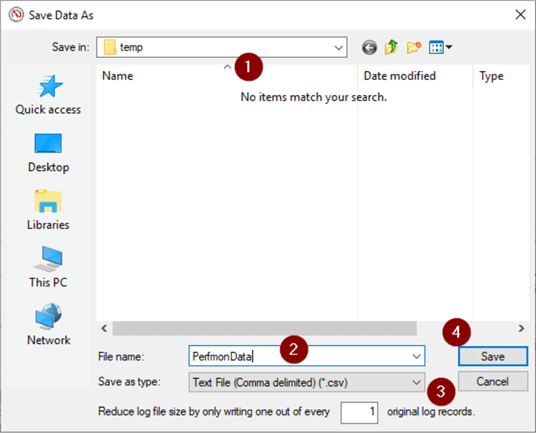
- Choose file location
- Name file
- Select 'Text File (Comma delimited)(.csv)' in dropdown
- Save
Made the following formatting changes to make it more readable:
- Format of the first column to a time format
- Top row Alignment to Word Wrap
- Made all columns the same width
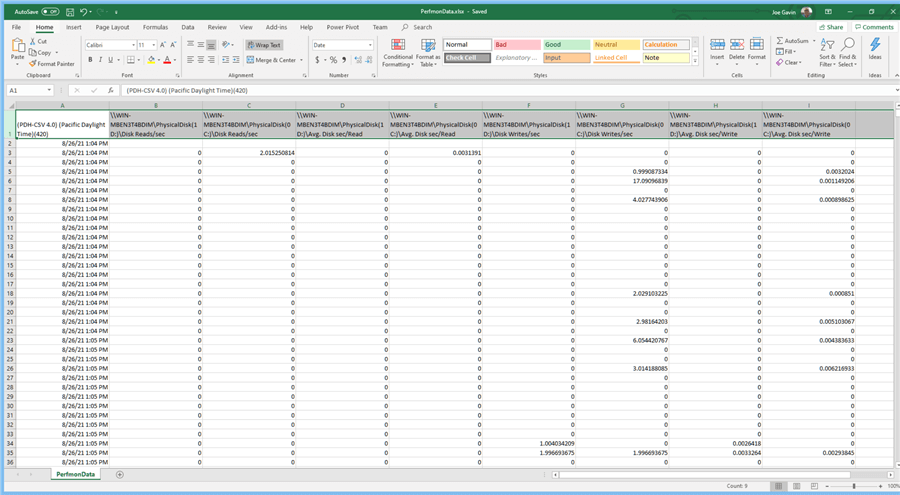
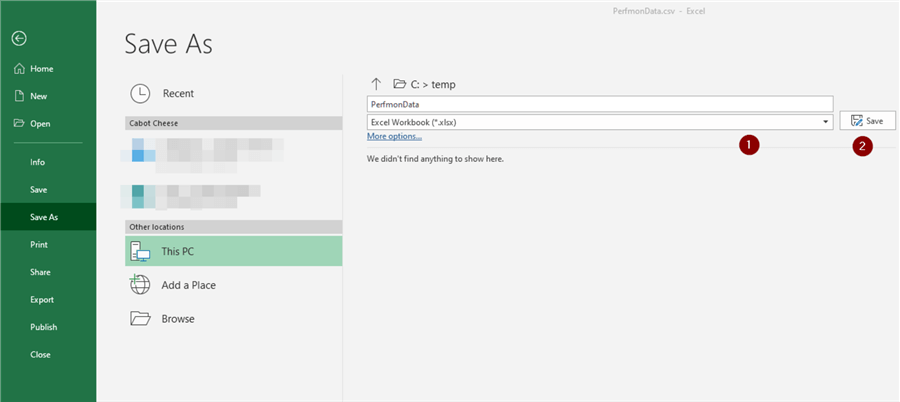
File > Save As
- Choose Excel Workbook (*.xlsx) in dropdown
- Save
Next Steps
So far, in this and previous tips we've seen how to analyze some basic disk related Perfmon data, specific memory related data, and specific disk related data.
Here are some links with further information.
- Performance Monitor
- Perfmon Counters to Identify SQL Server Disk Bottlenecks
- Perfmon Counters for CPU Usage, Memory, Disk and Network Performance
- Windows Performance Monitor Tutorial
- Setup Performance Monitor to Always Collect SQL Server Performance Statistics
- Create Windows Performance Monitor Data Collector Set


About the author
 Joe Gavin is from the Greater Boston area. He started working with SQL Server and Sybase in 1998 in the financial services industry and has been a SQL Server Database Administrator for a dairy cooperative since 2011. He graduated from Northeastern University in Boston with a Bachelor of Science in Engineering Technology (BSET) degree in Computer Technology. Joe has spoken at the Boston and Providence SQL Saturday events.
 This author pledges the content of this article is based on professional experience and not AI generated.
View all my tips
Article Last Updated: 2021-09-27
