By: Rajendra Gupta | Updated: 2022-12-01 | Comments | Related: > Amazon AWS RDS
Problem
Monitoring your Microsoft SQL Server is key to keeping your relational database management system (RDBMS) running smoothly, especially regarding performance issues. As a database professional (DBA, Developer, Architect, etc.), you'll likely encounter performance problems with databases now and then. These database performance issues can stem from blocking or deadlocks in SQL Server. So, you must keep an eye on deadlocks in your SQL database - whether hosted on-premises or in the cloud to prevent concurrency issues.
The Amazon RDS SQL Server does not provide sysadmin privileges for monitoring. How do you monitor or detect deadlocks in this case? Let's check it out in this tip.
Solution
In the tip, Tracing a SQL Server Deadlock, Greg Robidoux defines deadlock as: A deadlock occurs when two or more processes are waiting on the same resource and each process is waiting on the other process to complete before moving forward. When this situation occurs, and there is no way for these processes to resolve the conflict, SQL Server will choose one of the processes as the deadlock victim and rollback that process, so the other process or processes can move forward.
Whenever SQL Server detects a deadlock and kills the victim session, it logs the following deadlock error message:
SQL Server trace flags 1204 and 1222 help detect the deadlock.
- trace flag 1204: It returns information about the nodes (processes) involved in the deadlock.
- trace flag 1222: It gives detailed information about the deadlock in XML format.
These trace flags apply to on-premises SQL Server. However, we cannot enable the trace flags using the DBCC TRACEON command on a Amazon RDS SQL Server. If you try to run DBCC TRACEON(1222) with the SQL admin account, you get a permission error.
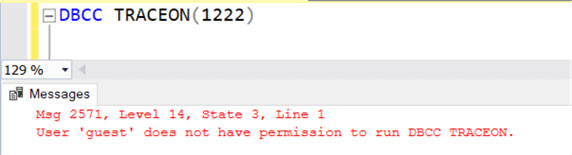
How do you enable trace flags 1202 and 1222 on a Amazon RDS SQL Server and trace deadlocks? Let's check it out.
Enable Trace Flags in Amazon RDS SQL Server Database
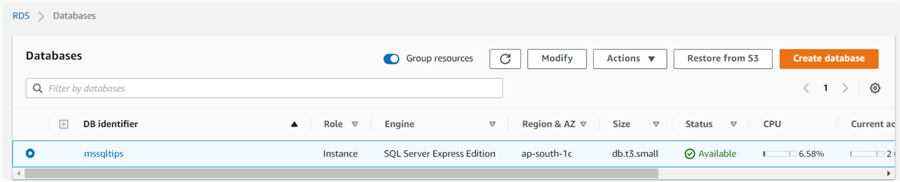
In the Amazon Web Portal, navigate to the RDS service and click on the RDS instance. On the summary page, click on Configuration.
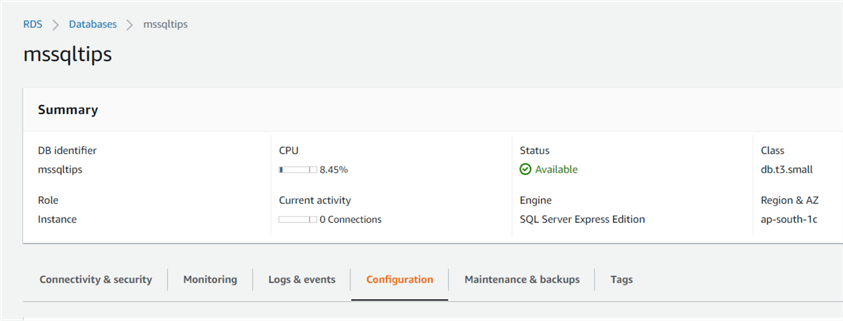
The configuration page displays Amazon RDS SQL Server configuration, such as collation, license model, options group, and parameter group.
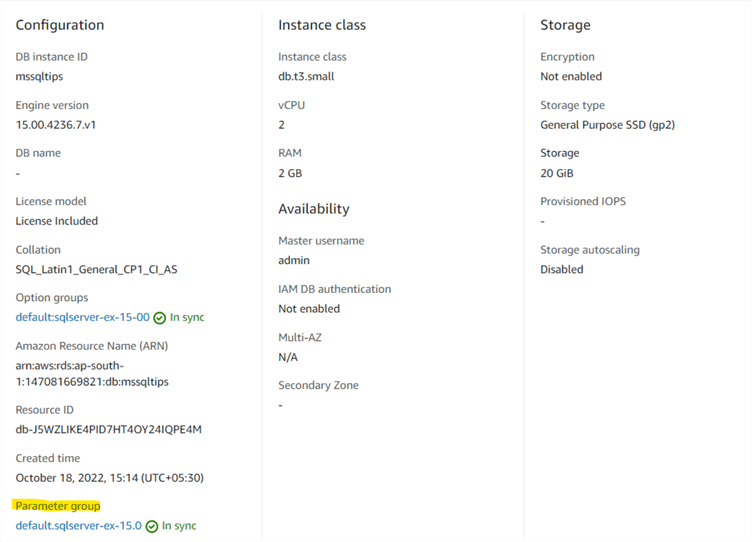
By default, SQL Server assigns a parameter group as per the SQL Server version and edition. For example, in my case, the parameter group is default.sqlserver-ex-15.0.
Click Parameter Group on the left side of the screen as shown below.
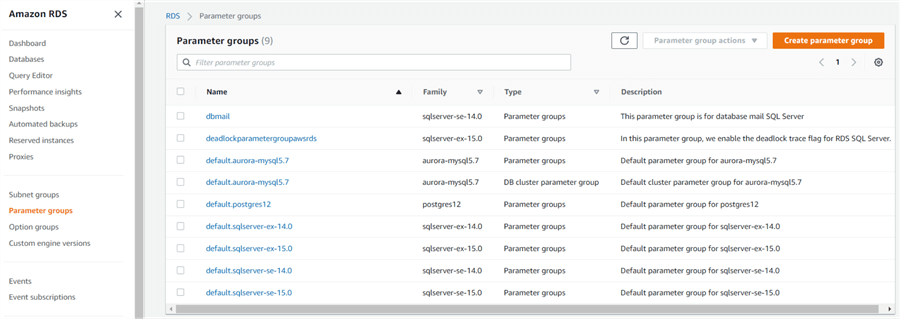
It shows all available parameter groups. Click Create parameter group. This window will appear:
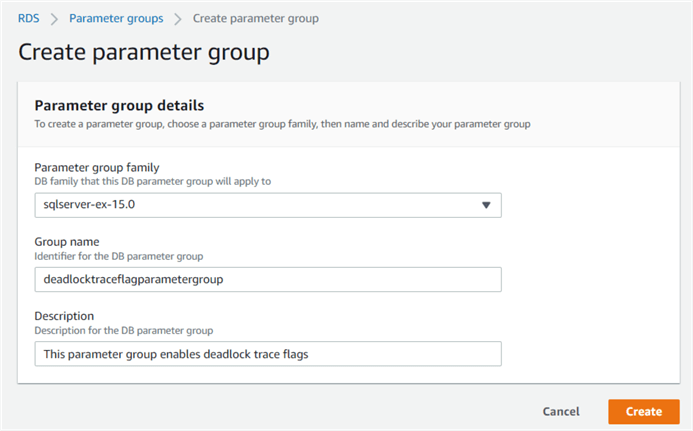
The Create parameter group requires the following inputs:
- Parameter group family: Choose the DB parameter group family from the drop-down as per your SQL Server edition and version. As our default parameter group is the default.sqlserver-ex-15.0, choose the parameter group family as sqlserver-ex-15.0.
- Group name: Specify a unique identifier for the DB parameter group.
- Description: You can add an optional description for the parameter group.
Click Create. Below is the custom DB parameter group.
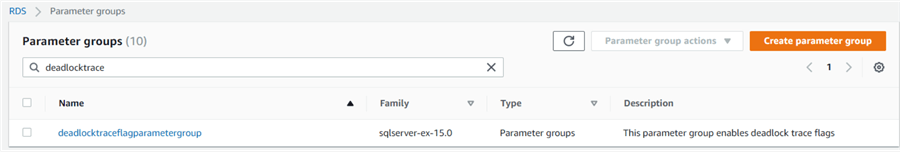
The custom parameter group is a copy of the default parameter group. We need to modify it to enable trace flags 1204 and 1222.
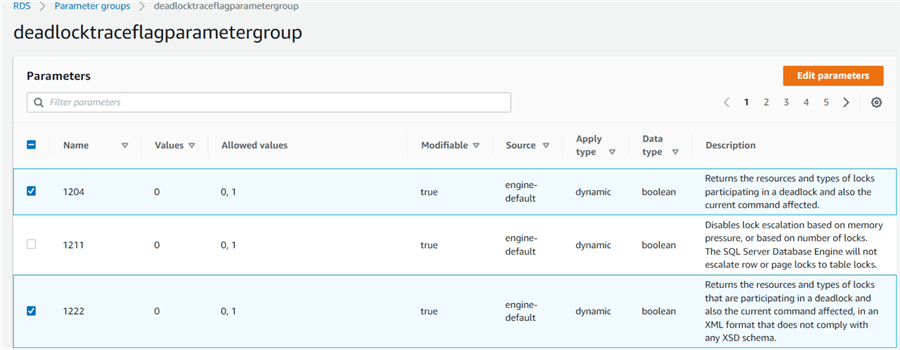
Open the new parameter group and select trace flags 1204 and 1222. As shown below, its current value is 0, i.e., these trace flags are disabled.
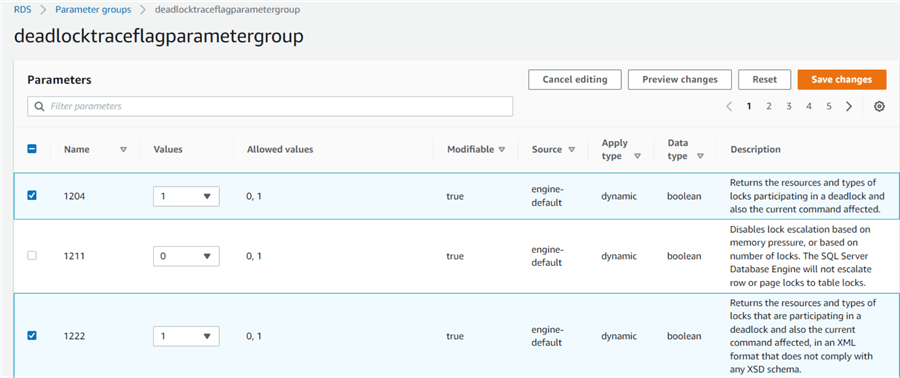
Select the trace flags and click Edit parameters. Modify the value from 0 to 1 to enable trace flags. Click Save changes.
Modify the RDS instance to map the custom DB parameter group with the RDS instance. To modify the RDS instance, choose the RDS instance radio button and click Modify.
In the RDS configuration page, choose the DB parameter group created above.
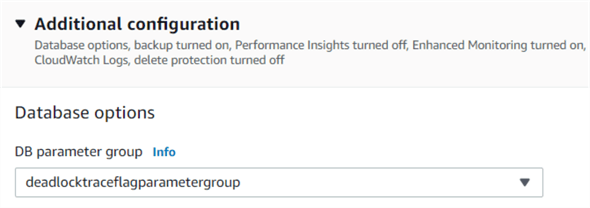
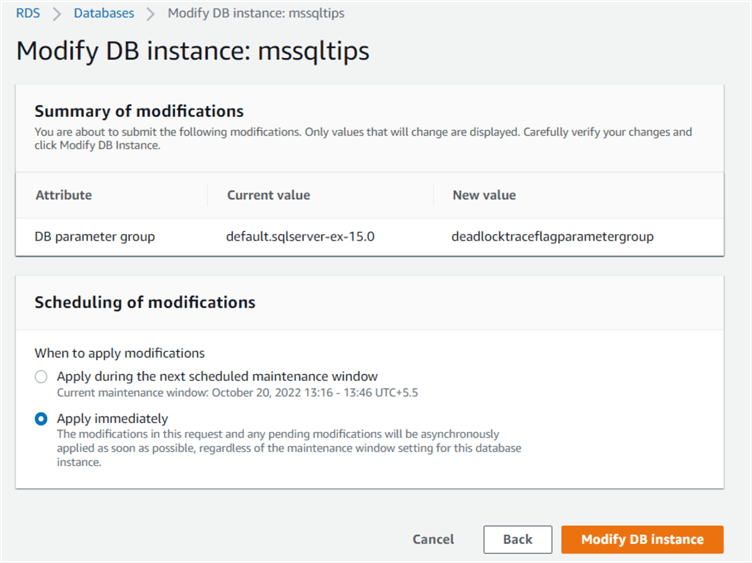
Click Continue. Review the configuration change. It will change the DB parameter group from the current value (default-sqlserver-ex-15.0) to a new value (deadlocktraceflagparametergroup), as shown below.
AWS provides two options for applying the changes:
- Apply during the next scheduled maintenance window: We can choose that the configuration changes be applied during the next scheduled maintenance window, and the date/time is given. For example, in my case, it is October 20, 2022, 13:16 - 13:46 UTC+5.5
- Apply immediately: This option will apply the changes to the RDS instance immediately. It might disconnect all users to apply the configuration change.
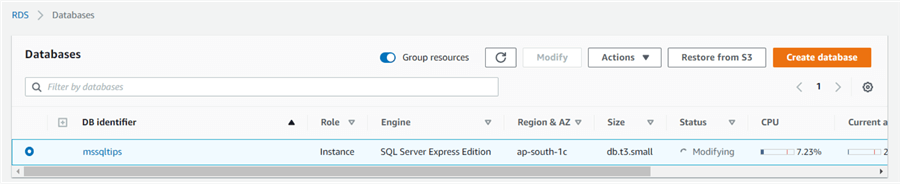
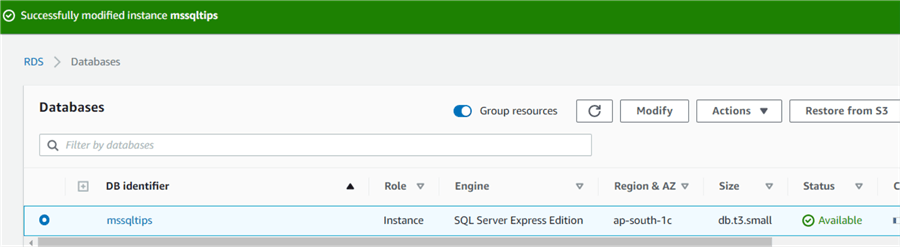
This is my lab environment. Therefore, I chose to apply immediately and clicked on Modify DB instance. Refresh the RDS dashboard to see that the RDS instance status changes to Modifying.
Once the RDS status shows Available, we can capture deadlocks in the Amazon RDS SQL Instance, as shown in the image below.
Capture SQL Server Deadlocks for the RDS Database
Let's generate the deadlock situation for our Amazon RDS SQL Server instance. Connect to RDS using endpoint and create sample tables T1 and T2. Here is the T-SQL code that can be run in SQL Server Management Studio (SSMS):
CREATE TABLE T1
(ID INT IDENTITY(1,1), [text] VARCHAR(20))
GO

CREATE TABLE T2
(ID INT IDENTITY(1,1), amount int)
GO

INSERT INTO T1([text]) VALUES ('Rajendra'),('Mohan')
INSERT INTO T2(amount) values (100),(200)
Now, open two different sessions and run the queries in the following order:
| Session 1 | Session 2 |
|---|---|
|
BEGIN TRAN UPDATE T1 SET [text] = 'Raj' WHERE ID=1 |
|
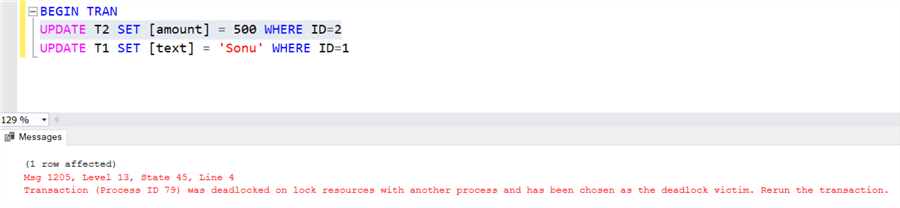
|
BEGIN TRAN UPDATE T2 SET [amount] = 500 WHERE ID=2 UPDATE T1 SET [text] = 'Sonu' WHERE ID=1 |
|
| UPDATE T2 SET [amount] = 600 WHERE ID=2 |
This creates a deadlock situation, and SQL Server kills one of the transactions as a deadlock victim. Either COMMIT or ROLLBACK the other transaction, so the transaction is complete.
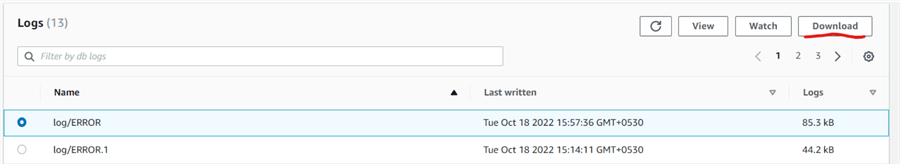
To check all deadlocks in AWS SQL Database, click on Logs & events in the RDS dashboard.

It shows all SQL Server error log files.
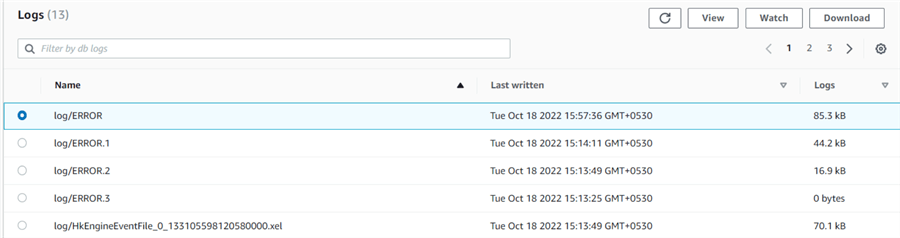
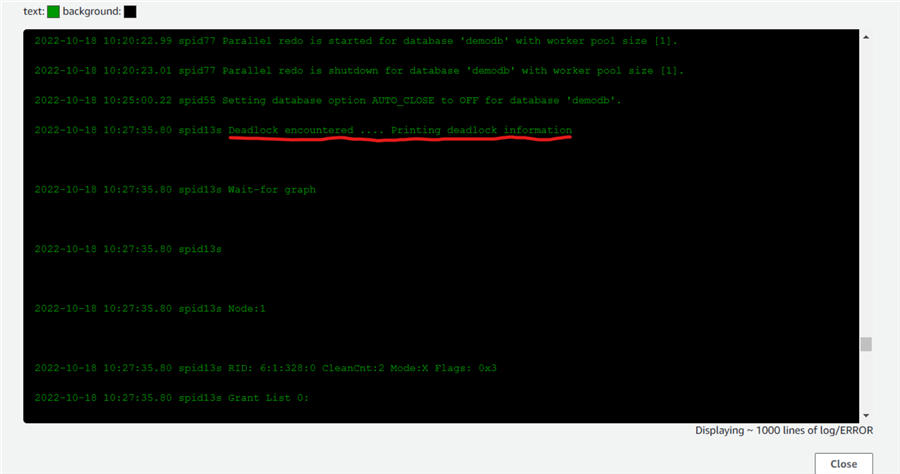
Choose the latest error log (log/ERROR) and click View. It captured the deadlock information in SQL Server logs.
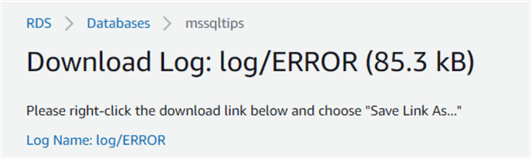
We can download the error log to read it in a text editor and find the deadlock information. Click Close and choose Download instead of View.
The following screen appears and asks the user to right-click on the download link below and choose "Save Link As."
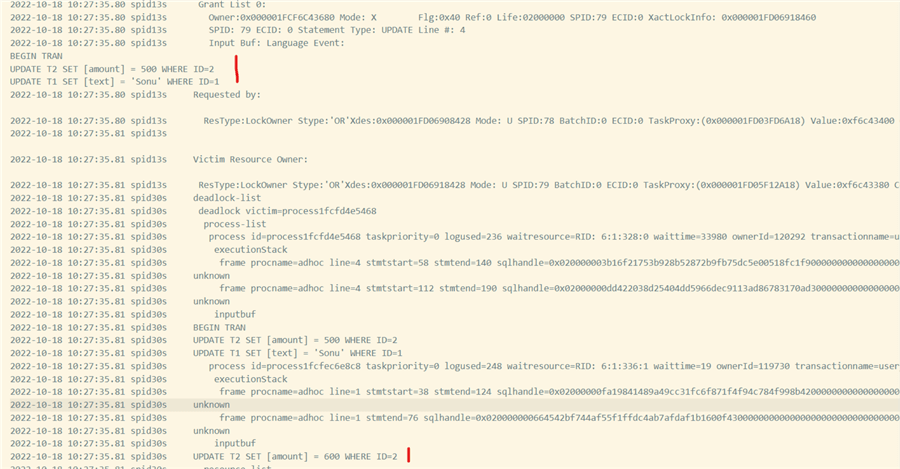
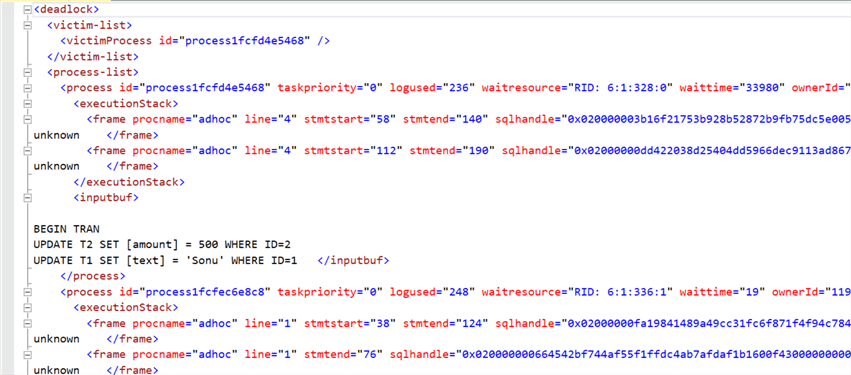
To view, open the download error log file in a text editor (notepad/Visual Studio Code) to get the deadlock information, process, and query involved (see below).
View Deadlock Graph for AWS RDS SQL Server
The system_health extended event captures the deadlock information in the XML format. We can convert the XML to view the deadlock graph. The deadlock graph visualizes the sessions involved in the deadlocks, making it easy to investigate and troubleshoot deadlock-related processes.
The following query returns the deadlock XML:
WITH DeadlockGraph
AS (SELECT CAST(ReadXevent.event_data AS XML)
AS Event_Data
    FROM sys.fn_xe_file_target_read_file(N'system_health*.xel', NULL, NULL, NULL) AS ReadXevent )
SELECT ReadXevent.deadlockgraph
FROM
(
    SELECT Deadlockgraph.query('.') AS deadlockgraph
    FROM DeadlockGraph
        CROSS APPLY event_data.nodes('(/event/data/value/deadlock)') AS d(Deadlockgraph)
) AS ReadXevent;
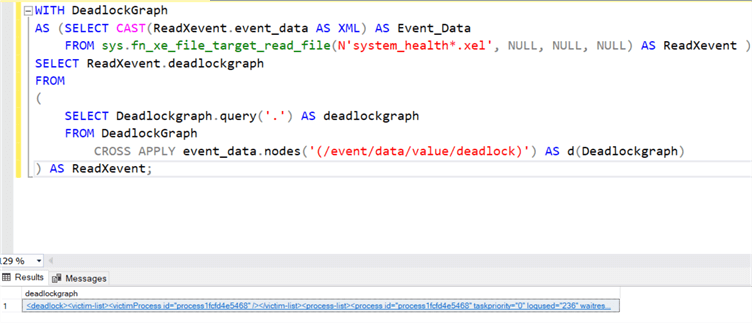
Click on the XML link to view the deadlock information in XML format.
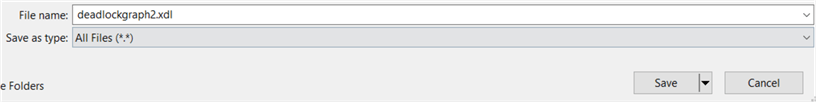
If you want to view the deadlock graph, save this XML file with the XDL extension.
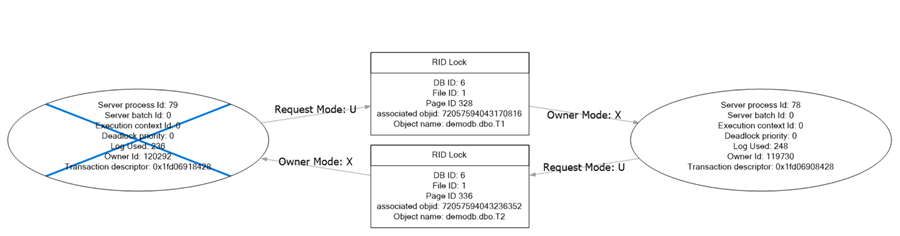
Open the XDL file in SSMS to see a deadlock graph, as shown below.
Next Steps
- Refer to existing AWS tips and AWS RDS documentation.
- Troubleshoot SQL Server deadlocks with this tip: Finding and troubleshooting SQL Server deadlocks.


About the author
 Rajendra Gupta is a Consultant DBA with 14+ years of extensive experience in database administration including large critical OLAP, OLTP, Reporting and SharePoint databases.
This author pledges the content of this article is based on professional experience and not AI generated.
View all my tips
Article Last Updated: 2022-12-01
