By: Kun Lee | Comments (2) | Related: More > Database Administration
Problem
As part of your DBA duties, you should be analyzing the size of your database so you can prepare for growth. This may be for new purchases of disk sub-systems, consolidation, pre-allocating enough space for your database to minimize fragmentation or maybe to maximize performance. With all of the necessary tasks that need to be done on a daily basis very few DBAs have the time to be proactive. In this tip we will look at how you can use some of the SQL Server data mining tools to help you predict database growth.
Solution
Previously, I used the Trend functions in Excel to predict growth patterns and needs. This works OK, but it required extra work in Excel to prepare and show the data. I found a better and easier solution to predict database growth by using the Data Mining Add-Ins for Office 2007 and the results are great.
Pre-requisite
Before you get started here are a few things that you will need to have in place to make this work in your environment.
- You will need MS Excel 2007
- SQL Server Analysis Service 2008 + Data Mining Add-Ins for Office 2007 (SQL 2008) or SQL Server Analysis Service 2005 + Data Mining Add-Ins for Office 2007 (SQL 2005)
- An automated process to collect database size information. If you are not familiar with this process, you can check out this great article "Collecting SQL Server database usage information for free space and trending".
(1) Collect and Load Data
Now that you have the components installed we need to prepare some test data.
You can either use this tip to gather data Collecting SQL Server database usage information for free space and trending and follow the steps below or you can use this sample Excel Workbook that you can download.
Manually Gather Data
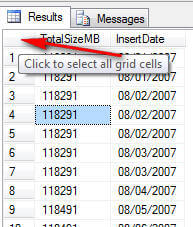
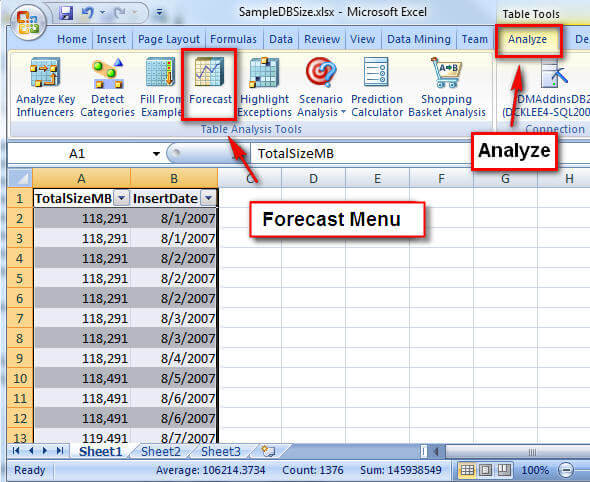
After you have collected the data you can run a query in SSMS to pull the data. For this example I am only using TotalSizeMB and InsertDate. If you right click in the upper left cell it will select all data.
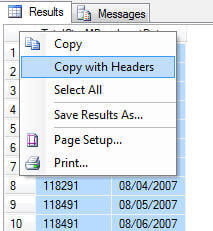
Then right click in this same cell and you will see the option "Copy with Headers" if you are using SQL 2008 SSMS. If you are not use SQL 2008 then you will need to pull in the column headers with the data.
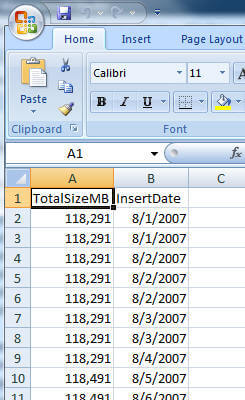
Then open Excel 2007 and paste this data so you have a sheet like the following.
(2) Format
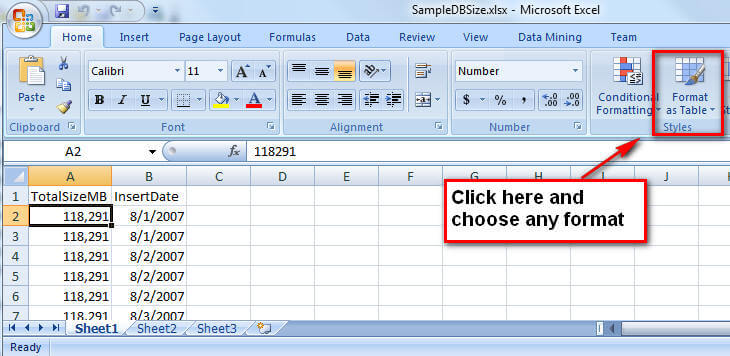
Now that you have the data, the first thing that you need to do is to format the data using the "Format as Table" option. Click any data range (I usually just click "A1") and click the "Format as Table" tool button in the "Home" ribbon as shown below.
It should automatically preselect the range of data like below. If not, you will need to do this manually so all data is selected.
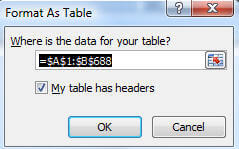
You can choose any format option when you do this . I just used the first format option. It doesn't really matter what you use.
(3) Setup Forecast
After the above step is done you will see a new menu item "Analyze" as shown below. Under this menu you will see an option "Forecast" which is also highlighted below.
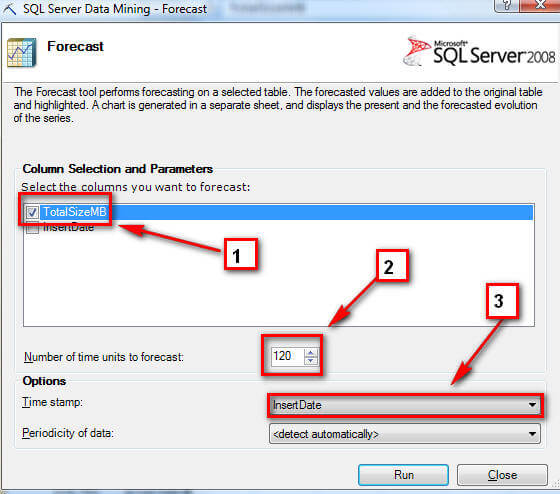
Click on Forecast and follow these steps.
- Choose "TotalSizeMB" for the columns you want to forecast
- Change the "Number of time units to forecast:" to days that you want to see. I choose 120 and that means it will predict the database size for next 120 days.
- Choose "Time stamp" column for your input for time which should be "InsertDate"
- Optional - choose "Periodicity of data". I get better results by choosing to detect automatically. If your data is absolutely clean you can choose one of the other options. But for this example I will let Excel choose.
(4) Run Forecast
At this point click "Run" to start the forecast and you will see the prediction for 120 days as shown below.
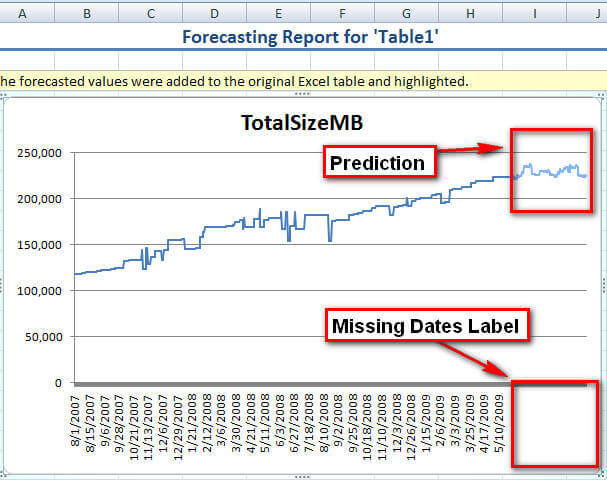
As you may have noticed there are some missing date labels. So, there is one more step that you can do to clean this up.
(5) Touch Up
In order to fill in the missing labels, click the "Sheet1" sheet (Original Sheet) and go to the very end of the data (cell B689 cell in the Sample Excel worksheet). This is the new data that was predicted.
To fill in the missing dates select from cell B687 to the end of the missing data in column B and click the "fill" button and choose "Series" as shown below.
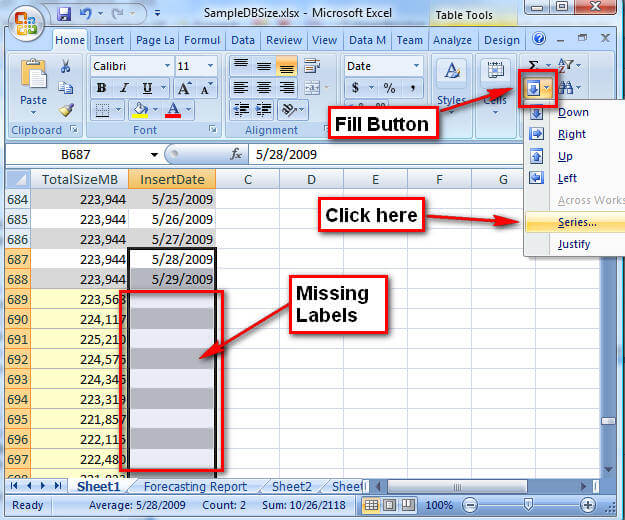
Click the "Trend" check box and click "OK"
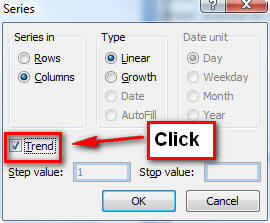
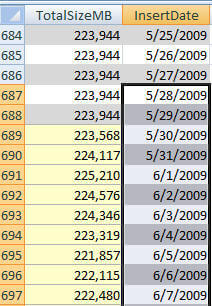
Excel will then fill in the missing dates based on the other data as shown.
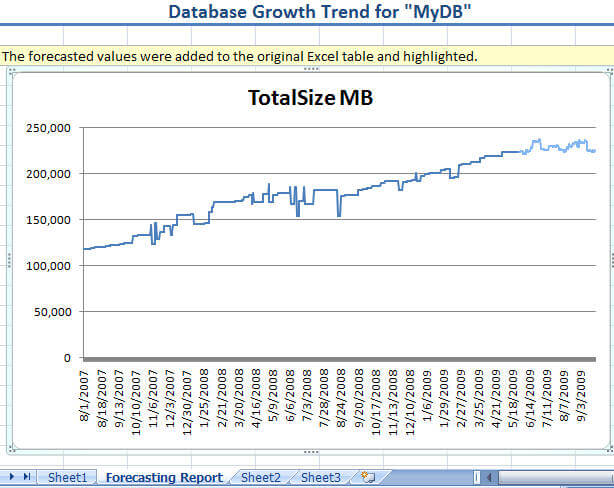
(6) Final Report
You can change the Title and other cosmetic things if you want, but basically that is it. You can move your mouse on the graph line to see the actual numbers for presentation purposes or go back to the original data sheet to get the numbers. Enjoy!
Next Steps
- You can also use the "Data Mining" feature to get a better interface to change the data.
- Automate this and put it into your SharePoint environment by utilizing Excel Service
- You can also use this feature to analyze some of the PerfMon data. Here is a tip that shows you how to collect PerfMon data "Setting up Performance Monitor to always collect SQL Server performance statistics"


About the author
 Kun Lee is a database administrator and his areas of interest are database administration, architecture, data modeling and development.
This author pledges the content of this article is based on professional experience and not AI generated.
View all my tips
