Problem
A countdown timer can be a powerful visual tool in many Business Intelligence reporting scenarios. This could be for marketing campaigns, contract expiries, and business deals with clients. Real-time countdown visuals are not natively supported in Power BI. Although, there is the Count Down Timer custom visual, which is not dynamic in its configuration.
The question is then how we can build a dynamic countdown timer that is updated based on the underlying data and does not require any manual configuration, like the Count Down Timer custom visual mentioned earlier.
Solution
To fully explain this solution, a real business scenario is ideal. Assume you are required to build a report for your marketing team that is managing multiple campaigns at the same time. As you would expect, each marketing campaign has a distinct and unique end date and time, so the requirement is that the stakeholders would like to see and monitor the time left for each marketing campaign.
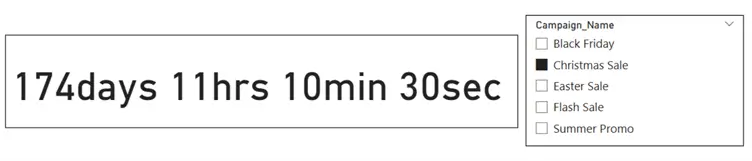
Usually, stakeholders like to view this countdown timer in a visual like the one shown in the image below, and it updates dynamically depending on the campaign selected on a slicer visual.
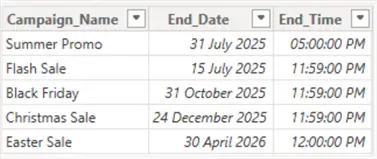
I will be leveraging the data in the table below for this demonstration. Usually, your data table would be different, but the concept is still the same. Just ensure the “End_Date” and “End_Time” columns or a combination of both (datetime) exists in your data table.
Follow the steps below to build a dynamic Power BI countdown timer.
Step 1: Combine the End_Date and End_Time Columns
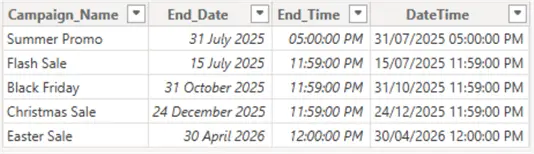
You need to combine the date and time columns into a single “datatime” column, as seen in the DAX calculated column below.
DateTime =
COMBINEVALUES ( " ", CampaignsTable[End_Date], CampaignsTable[End_Time] )
The output will create a column with datetime data type, as seen below.
Step 2: Create a Measure to Calculate the Difference Between Current Time and Target (DateTime)
To calculate the difference between the target and current time as a decimal number of days use the following measure. For example, 2.5 represents 2 days and 12 hours remaining.
Time_Difference =
VAR _Targetdate =
SELECTEDVALUE ( CampaignsTable[DateTime] ) -- This retrieves the target datetime of the selected campaign
VAR _CurrentTime =
NOW () -- This returns the current system datetime, which serves as the reference point for calculating the countdown
RETURN
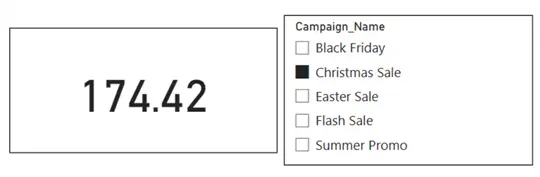
_Targetdate - _CurrentTime The output is below. The numbers are based on the time and date I wrote this article. So if you use the same data I have in this tip by the time it’s published, you certainly would not see the same values.
Step 3: Compute a Measure to Extract Days from the Time_Difference Measure Created in Step 2
To do this, I will use the INT() DAX function, which helps to get the whole number of days from the time difference calculation. See the DAX code below.
Extract_Days =
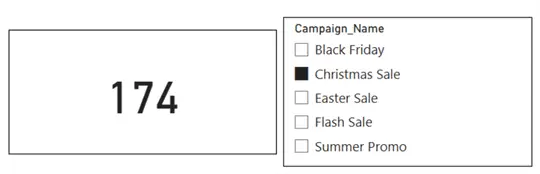
INT([Time_Difference]) The output of the above DAX code should look like the image below.
Step 4: Compute a Measure to Extract Hours from the Time_Difference Measure Created in Step 2
To do this, I will use the HOUR() DAX function, which helps to extract the hour portion from the time difference calculation earlier. It will act on the fractional part of the day. See the DAX code below.
Extract_Hours =
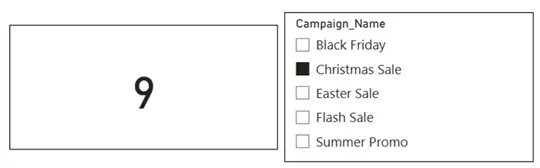
HOUR([Time_Difference]) Using the same campaign selection, you can see the output as in the image below.
Step 5: Compute a Measure to Extract Minutes from the Time_Difference Measure Created in Step 2
To get the minutes part of the time difference, I will use the MINUTE() DAX function, as seen in the code below.
Extract_Minute =
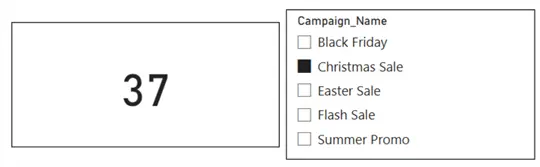
MINUTE([Time_Difference]) The output is as seen in the image below.
Step 6: Compute a Measure to Extract Seconds from the Time_Difference Measure Created in Step 2
To retrieve the seconds part from the time difference measure, I will use the SECOND() DAX function as seen in the code below.
Extract_Seconds =
SECOND([Time_Difference])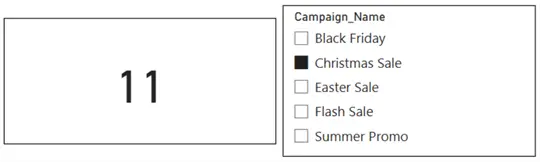
Step 7: Create a Single Measure to Combine All Steps into One
All we have been doing is breaking this step into smaller bits for better understanding. But to follow best practice, we shall now combine all the measures in a single measure called “TimeRemaining” leveraging DAX variables, as seen in the DAX code below.
TimeRemaining =
    VAR _Target = SELECTEDVALUE(CampaignsTable[DateTime])
    VAR _NowTime = NOW()
    VAR _TimeDiff = _Target - _NowTime
    VAR _Days = INT(_TimeDiff)
    VAR _Hours = HOUR(_TimeDiff)
    VAR _Minutes = MINUTE(_TimeDiff)
    VAR _Seconds = SECOND(_TimeDiff)
RETURN
    FORMAT(_Days, "00") & "days " &
    FORMAT(_Hours, "00") & "hrs " &
    FORMAT(_Minutes, "00") & "min " &
    FORMAT(_Seconds, "00") & "sec "
As can be seen in the DAX code above, I added formatting to the outputs to make it easier for the users to understand what they are observing. You can choose to use “d” for days, “h” for hours, and so on, as long as it meets your requirements.
Also, each part of the output is formatted to always display double digits, for example, 02, 07, etc. All parts of the output are now also concatenated into a unified string, as seen in the final output below.
Step 8: How to Visualize the Countdown Timer
Card Visual
Visualizing a Countdown timer is best done using a Card Visual alongside a slicer. Power BI has different Card visuals that can do this efficiently. In my example, I have leveraged the standard Card visual along with the Campaign names on a slicer visual, as can be seen in the image above.
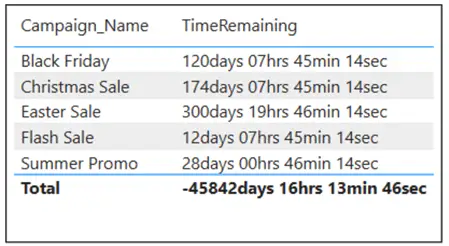
Table or Matrix Visual
You can also use a table or matrix visual to show the countdown timer, depending on your business requirements. In this case, you might not need a slicer visual along with it but only need to monitor the timer. See the image below.
You can further improve this by adding conditional formatting to the table or matrix visual. For instance, a red background for campaigns that have less than 7 days left.
How to Keep the Countdown Timer Updated in Power BI
In Power BI, you would find that the countdown timer does not auto-refresh in real time. However, there are ways to ensure that the countdown is always refreshed and accurate.
Option 1: Leverage Manual Refresh
You can opt to manually refresh your report that has this countdown timer in the Power BI service by clicking on the refresh button in the Power BI service to refresh and update it.
Option 2: Scheduled Refresh in Power BI Service
You can choose to set up scheduled refreshes in the Power BI service within your semantic model settings to ensure that the NOW() function reflects the actual current time. You have the flexibility on how often you need the refreshes to be. For example, you could set it to refresh every 30 minutes or every hour, depending on your needs.
Option 3: Use of DirectQuery
Where you have your data source supported by DirectQuery, you don’t need to do anything more; Power BI can refresh the visual on interaction. The countdown will automatically update itself when users slice or filter the report.
Option 4: Leverage Power Automate Integration
You can also opt to leverage Power Automate to trigger a semantic model refresh at custom intervals. In the past, I wrote an article, Notify Users of Power BI Dataset Changes, on how to refresh your semantic model in the Power BI service using Power Automate. You can adapt this approach to suit your needs.
This option is better suited for requirements where a near-real-time dashboard is needed.
As part of good practice, if this countdown is critical for your reporting, to ensure consistency and prevention of broken logic, your organization might want to establish clear standards for how date/time fields are populated and maintained in your source tables.
In this tip, I have demonstrated that with a bit of DAX and planned modelling, it is possible to create a dynamic countdown timer in Power BI, which eliminates the need to use the usual custom visual. I have also shown different options that can be taken to ensure the countdown is always accurate and updated.
It would be great to hear from you if you have approached this differently. Please share your approach or challenges; it would be interesting to hear about these.
Next Steps
- Read this Microsoft documentation: Date and time functions.
- Read more about using Direct Query in Power BI.
- Learn more about Data Refresh in Power BI.
- Read my other articles: Kenneth Omorodion Bio.
