Problem
One of the responsibilities of a centralized business intelligence (BI) team is to create and manage a plethora of reports for various stakeholders across business and technical teams. Report consumers and data governance stakeholders are deeply interested in understanding the definition of the metrics and measures within these reports. While it is a best practice for BI developers to manually document the descriptions for the measures and DAX code they are writing in their Power BI (PBI) reports, competing priorities may require their attention for other value-added efforts, leaving almost no time to create relevant documentation for their PBI reports.
This age-old conundrum has been tackled by several solutions that automate the process of extracting metadata from PBI. This can include measure names, DAX code, manually-defined descriptions, etc. However, DAX code is seldom useful to business stakeholders, and description fields are rarely filled in manually for the corresponding measures, leaving the challenge of fully automating the PBI documentation unsolved.
Solution
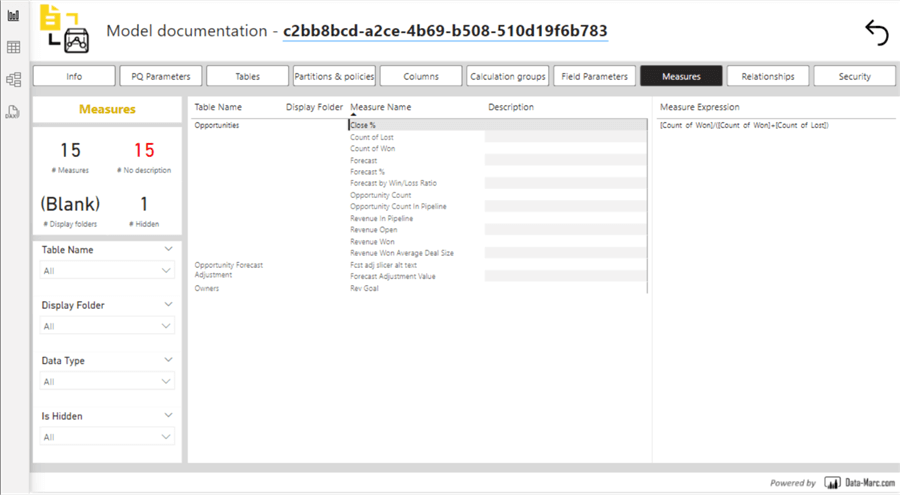
Several solutions are available on the market that are capable of extracting PBI metadata and displaying it to end users like DAX studio and other tools. Model Documenter – Data – Marc is an excellent example of a free tool that can be added to your existing PBI Desktop application as an “External Tool”. The following figure shows it can generate metadata related to your measures and more. However, as we mentioned, these measures might not always be helpful to business users due to the complex DAX code.
The solution to use is Fabric’s Semantic Link Python package called SemPy, which allows you to read and write data from PBI using Python in Fabric notebooks. You will also need an OpenAI key to infuse AI into the process of interpreting the descriptions of the DAX measures into natural language. Some capabilities of Fabric’s SemPy library, shown in the code block below, include listing workspaces at a meta-level and listing reports, datasets, and dataflows in workspaces. You can also list tables being used in a dataset and buildout robust monitoring capabilities by having access to refresh and failure metadata for all processes in Fabric.
import sempy.fabric as fabric
dir(fabric)
fabric.list_workspaces()
fabric.list_reports(workspace="Fabric Sandbox")
fabric.list_datasets(workspace="Fabric Sandbox")
fabric.list_dataflows(workspace="Fabric Sandbox")
fabric.list_tables(workspace="Fabric Sandbox",dataset="Regional Sales Sample")
fabric.list_refresh_requests(workspace="Fabric Sandbox",dataset="Regional Sales Sample")
Extract PBI Measures with Fabric Semantic Link (SemPy)
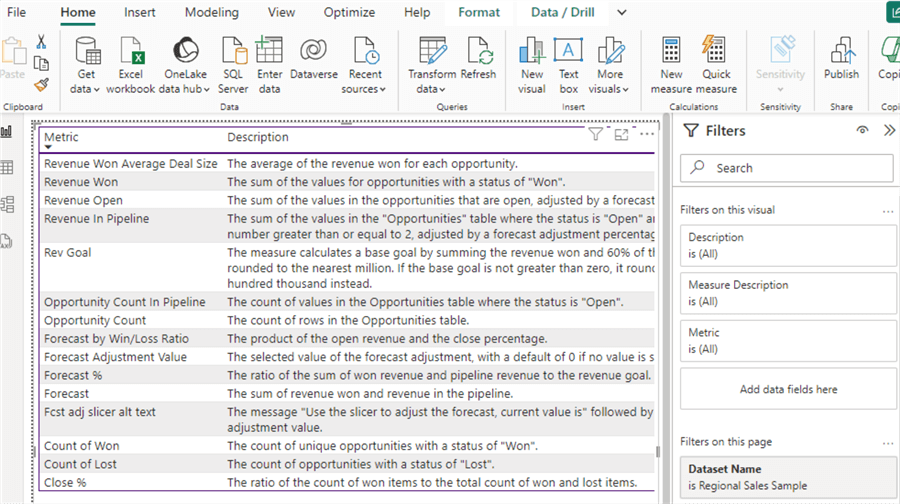
Through this article, I will use a sample PBI report called Regional Sales Sample, which is available in Fabric’s Knowledge Center containing PBI Samples. You can find additional samples here. For the SemPy to access your report, you need to have your report published in a premium capacity workspace on Fabric. With the following code, you can view all the measures within a specified workspace and report dataset.
import pandas as pd

# Set the maximum column width to None to prevent truncation
pd.set_option('display.max_colwidth', None)
fabric.list_measures(workspace="Fabric Sandbox",dataset="Regional Sales Sample")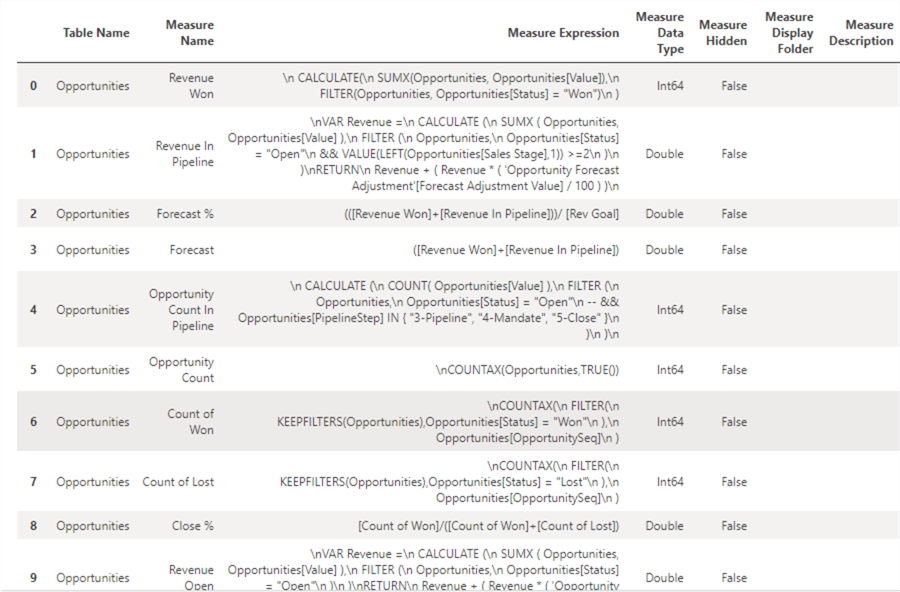
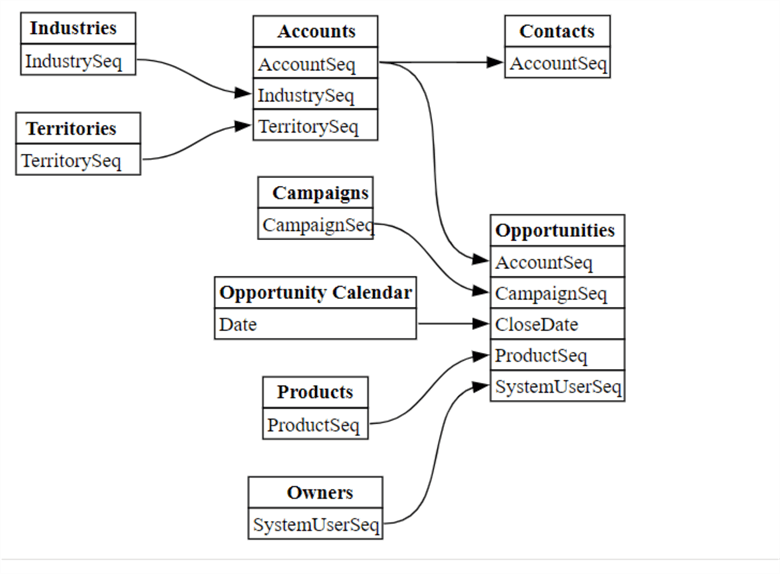
You can also plot and visualize the relationship metadata of a dataset with this code.
from sempy.relationships import plot_relationship_metadata
from sempy.relationships import find_relationships
from sempy.fabric import list_relationship_violations

pd.set_option('display.max_colwidth', None)
relationships = fabric.list_relationships(workspace="Fabric Sandbox",dataset="Regional Sales Sample")

plot_relationship_metadata(relationships)
Below is the visualized result from the above code in your Fabric notebook. This is a powerful visualization that helps with understanding how your dataset is built and how it can possibly be enhanced.
Generate Measure Descriptions with AI and Productionize
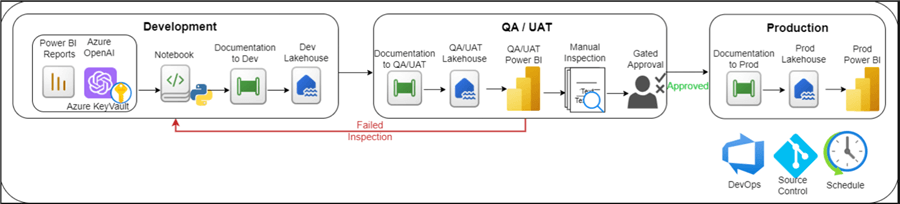
The power of Fabric’s Semantic Link SemPy library is evident. From the lens of productionizing this process, you could develop your solution to extract PBI measure DAX code and generate natural language descriptions using Python in a development workspace and notebook. A pipeline could then be used to store it in a development lakehouse.
With source control, DevOps approval gates, and scheduled pipelines built into the production process, the PBI AI documentation can be promoted to a QA/UAT workspace and lakehouse, where the PBI Developer will manually review the AI-generated descriptions. They will either approve it to a production lakehouse or fail it to return to the AI Engineer for fine-tuning the prompt instead of inserting a different description for certain measures. Finally, once fully approved, the prod lakehouse will contain all relevant measures – AI-generated documentation along with human-generated descriptions. This table can be used in the production PBI report by adding a documentation page at the end of the report sourced from the AI documentation table. The diagram below illustrates this end-to-end process.
Python Code to generate AI descriptions for Power BI measures
Below is Python code to generate AI descriptions for PBI measures in the Regional Sales Sample dataset within the Fabric Sandbox workspace. You will need to specify an OpenAI key, and remember to use Key Vault for storing your secrets as a best practice. The code will first define a function that can be called to explain the DAX code. The prompt context can be expanded based on certain outliers or additional context that needs to be provided. Essentially, we tell the GPT4o model to write a brief description of what each DAX measure is doing. Then it fetches the measures defined by the workspace and dataset. This can be expanded to be more dynamic by referencing a list of reports as needed. Lastly, it generates the AI descriptions for each measure based on the DAX code and displays the results.
import pandas as pd
import sempy.fabric as fabric
import requests
import json
import re
import time

OPENAI_KEY = mssparkutils.credentials.getSecret('[ENTER YOUR AKV URL]','[ENTER YOUR OPENAI SECRET KEY])

# Set the maximum column width to None to prevent truncation
pd.set_option('display.max_colwidth', None)

# Define the explain_dax function
def explain_dax(
    url: str,
    payload: dict,
    measure_expression: str,
    headers: dict,
    remove_comments: bool = True
):
    if remove_comments:
        # Remove in-line and block comments
        measure_expression = re.sub(r"--[^\r\n]*|/\*[\s\S]*?\*/", '', measure_expression)

    context = f"""
    For the following Power BI DAX code, write a brief description of what the code is doing.
    Be concise and start your response with a verb.
    DAX Code:
    {measure_expression}
    """

    payload["messages"] = [
        {
            "role": "user",
            "content": context
        }
    ]

    res = requests.post(url, json=payload, headers=headers)
    _res = json.loads(res.content)

    try:
        choice = _res.get("choices", [])[0]
        return choice["message"]["content"]
    except Exception as e:
        print(f"Error processing response: {e}")
        return "No response received"

# Example usage
url = r"https://dev-pri-ml-azopenai.openai.azure.com/openai/deployments/gpt-4o-2024-05-13/chat/completions?api-version=2023-03-15-preview"
headers = {"Content-Type":"application/json","api-key":f"{OPENAI_KEY}"}
payload = {
    "model": "gpt-4o",
    "messages": []
}

# Fetch and explain measures
measures = fabric.list_measures(workspace="Fabric Sandbox", dataset="Regional Sales Sample")
measures_df = pd.DataFrame(measures)

# Generate AI documentation for each measure expression
ai_documentation = []
for measure_expression in measures_df['Measure Expression']:
    doc = explain_dax(url, payload, measure_expression, headers)
    ai_documentation.append(doc)
    time.sleep(1)  # To avoid hitting rate limits

# Ensure the length of ai_documentation matches the length of measures_df
if len(ai_documentation) < len(measures_df):
    ai_documentation.extend(["No response received"] * (len(measures_df) - len(ai_documentation)))

# Add the AI-generated documentation to the DataFrame
measures_df['AI_Documentation'] = ai_documentation

# Filter the DataFrame to only show the specified columns
filtered_measures_df = measures_df[['Measure Name', 'Measure Expression', 'AI_Documentation', 'Measure Description']]

# Create a DataFrame to display the results
results_df = pd.DataFrame(filtered_measures_df)

# Display the DataFrame
display(filtered_measures_df)
The final result would look similar to the image below. We have a dataset containing the measure’s name, DAX code, AI-generated description, and human-generated measure description if there is any that is needed to either supplement or trump the AI-generated description.
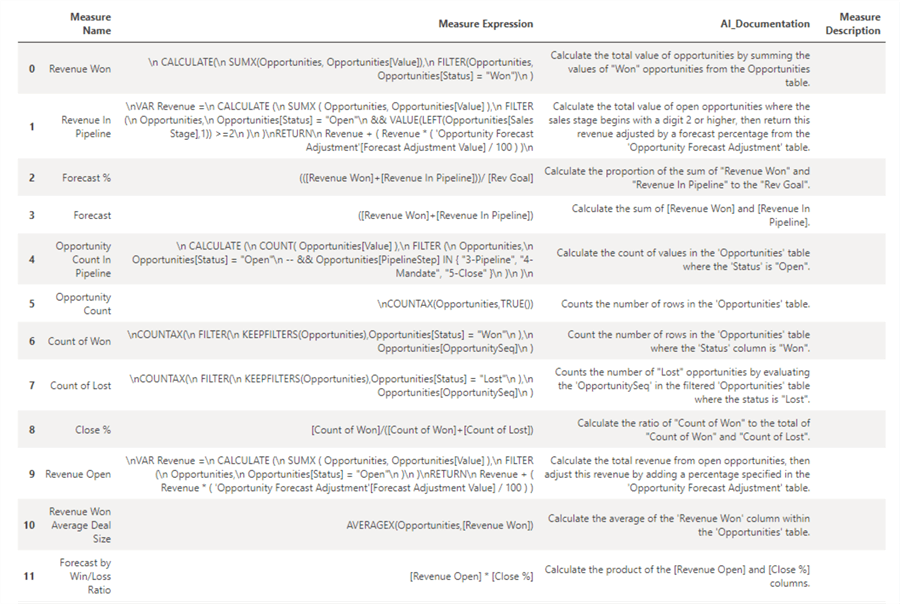
This dataset can then be stored in a lakehouse table and added as a page within the Regional Sales Sample report. With this fully automated process running on a scheduled cadence, you will be able to generate documentation for PBI measures much faster with the help of AI.
Next Steps
- Read more about Semantic Link and other use cases: Fabric Semantic Link and Use Cases
- Learn more about Semantic link and Power BI connectivity – Microsoft Fabric | Microsoft Learn
