Problem
You have a Power BI project that generates real-time reports for an inventory management system that uses SQL Server. You are aware that Power BI performance is heavily influenced by how your data is structured in SQL Server but don’t have a clear understanding of how to optimize your SQL data structure for Power BI. In this article, we look at different ways to structure the data and tables to help improve Power BI query performance.
Solution
There are SQL database schemas optimized for analytical and business intelligence tools like Power BI. These include relational schema, star schema, and snowflake schema.
How you implement these schemas depends on your application’s requirements. You will have to compare the functionality as well as the drawbacks of each option. This article will be using the context of developing an ideal schema for Power BI report optimization for an inventory system in order to improve the query performance in Power BI.
Normalized Database Schema
To understand the concepts in this tutorial and database designs, you must know what normalized and denormalized tables are.
In brief, normalized tables are designed to reduce data duplication by breaking down data into separate tables that are related to each other, usually using table IDs as primary keys. This is how a normalized design for an Inventory system would look:
First, the main quantity table (fact table)
| inventoryID | productID | warehouseID | quantity |
| 1 | 10 | 2 | 100 |
Then, a separate table (dimension table) for the product
| productID | productName | categoryID |
| 10 | Canon printer | 2 |
Then, a separate table (dimension table) for the category
| categoryID | categoryName |
| 10 | PC accessories |
And another separate table for the warehouse
| warehouseID | warehouseName |
| 2 | Pretoria north |
This design makes your data cleaner and storage more efficient, but it will require more joins for queries.
Denormalized Database Design
This database design does the opposite of the normalized design. It consolidates related data into fewer tables. This usually improves read performance and makes queries easier to write, but the design creates a lot of redundant data.
This is how the data from the previous section would be outlined in a denormalized design:
| inventoryID | productName | categoryName | warehouseName | quantity |
| 1 | Canon Printer | PC accessories | Pretoria North | 100 |
Setting up Database
For this article, we will setup a database for Inventory management in SQL Server.
CREATE DATABASE InventoryDB;
GO
USE InventoryDB;
GO
Designing a Relational Schema
A relational schema separates the project’s data into multiple normalized tables. This schema design reduces redundancies and promotes consistency in data, but may require you to perform complex table joins.
Considering this is an inventory management dataset, the relational schema will be something along these lines:
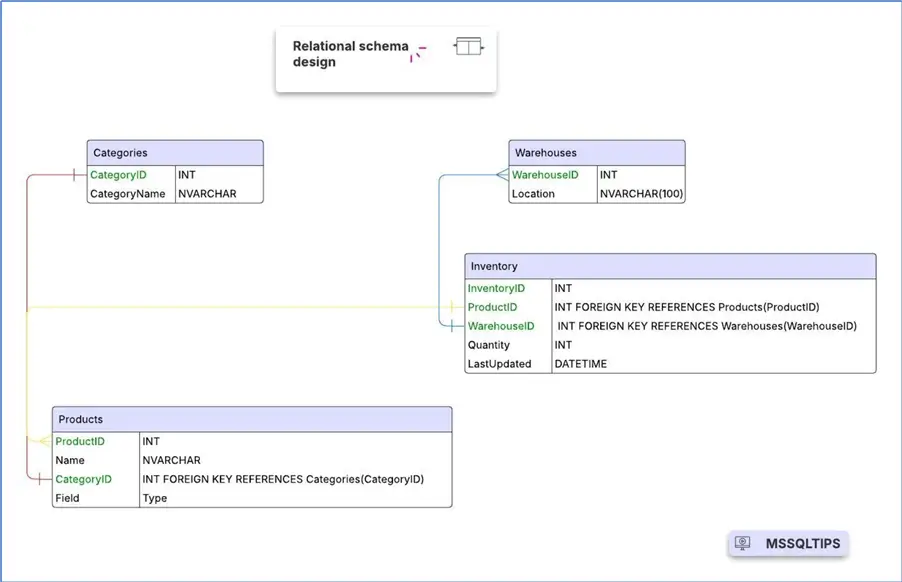
- Products (ProductID, Name, CategoryID)
- Categories (CategoryID, CategoryName)
- Warehouses (WarehouseID, Location)
- Inventory (InventoryID, ProductID, WarehouseID, Quantity, LastUpdated)
Here is T-SQL code you can use in SSMS to create this schema on your SQL Server database:
-- Categories
CREATE TABLE Categories (
   CategoryID INT PRIMARY KEY,
   CategoryName NVARCHAR(100) );

-- Products
CREATE TABLE Products (
   ProductID INT PRIMARY KEY,
   Name NVARCHAR(100),
   CategoryID INT FOREIGN KEY REFERENCES Categories(CategoryID) );

-- Warehouses
CREATE TABLE Warehouses (
   WarehouseID INT PRIMARY KEY,
   Location NVARCHAR(100) );

-- Inventory table
CREATE TABLE Inventory (
   InventoryID INT PRIMARY KEY,
   ProductID INT FOREIGN KEY REFERENCES Products(ProductID),
   WarehouseID INT FOREIGN KEY REFERENCES Warehouses(WarehouseID),
   Quantity INT,
   LastUpdated DATETIME );
Designing a Star Schema
The Star Schema design has a central table named a fact table which will contain all the quantitative data from observations or events and includes foreign keys referencing dimension tables.
Dimension tablescontain descriptive attributes for business entities related to the facts table. These are the things you will be modeling, and each dimension table is connected to the fact table via a primary key.
A star schema is designed to simplify relationships and is built for fast querying in analytical tools. In this instance where you want to create an Inventory system. The star schema tables would look something like this:
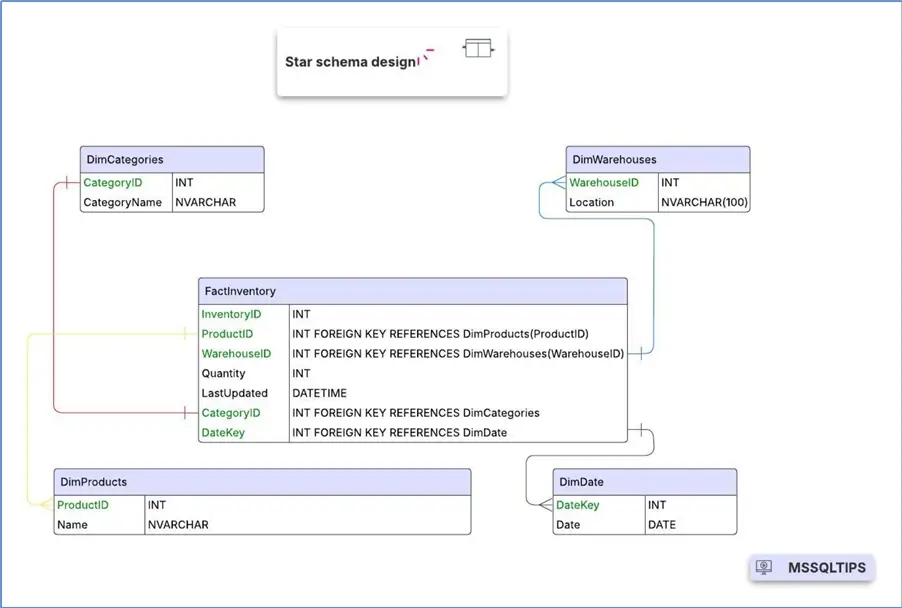
Note that, you will create a date dimension as well. To create a date dimension, you must know the date interval your data exists in and then create a table that breaks down all the dates to make it easier to make business intelligent queries and filters like: “the last 7 days”, “last two weeks” or “last quarter” on your Power BI reports.
Here is the SQL code to create this schema:
-- Dimension tables
CREATE TABLE DimCategory (
   CategoryID INT PRIMARY KEY,
   CategoryName NVARCHAR (100));
CREATE TABLE DimProduct (
   ProductID INT PRIMARY KEY,
   ProductName NVARCHAR (100),
   CategoryID INT FOREIGN KEY REFERENCES DimCategory(CategoryID));
CREATE TABLE DimWarehouse (
   WarehouseID INT PRIMARY KEY,
   Location NVARCHAR (100));

-- Fact Table
CREATE TABLE FactInventory (
   InventoryID INT PRIMARY KEY,
   ProductID INT FOREIGN KEY REFERENCES DimProduct(ProductID),
   WarehouseID INT FOREIGN KEY REFERENCES DimWarehouse(WarehouseID),
   DateKey INT FOREIGN KEY REFERENCES DimDate(DateKey),
   Quantity INT,
   LastUpdated DATETIME);

-- Create Date Dimension
CREATE TABLE DimDate (
   DateKey INT PRIMARY KEY, -- Format: YYYYMMDD
   Date DATE,
   Day INT,
   Month INT,
   MonthName VARCHAR(20),
   Quarter INT,
   Year INT,
   WeekOfYear INT,
   DayOfWeek INT,
   DayOfWeekName VARCHAR(10) );

-- Populate Dates (10 years of data)
DECLARE @StartDate DATE = '2015-01-01';
DECLARE @EndDate DATE = '2030-12-31';

WHILE @StartDate <= @EndDate
BEGIN
   INSERT INTO DimDate ( DateKey, Date, Day, Month, MonthName, Quarter, Year, WeekOfYear, DayOfWeek, DayOfWeekName )
   VALUES ( CONVERT(INT, FORMAT(@StartDate, 'yyyyMMdd')), @StartDate, DAY(@StartDate), MONTH(@StartDate), DATENAME(MONTH, @StartDate), DATEPART(QUARTER, @StartDate), YEAR(@StartDate), DATEPART(WEEK, @StartDate), DATEPART(WEEKDAY, @StartDate), DATENAME(WEEKDAY, @StartDate) );
   SET @StartDate = DATEADD(DAY, 1, @StartDate);
END;
Populating a Star Schema
The star schema might be the best option for optimizing Power BI. You will implement this schema further by populating the tables with demo data using the following SQL code:
INSERT INTO DimCategory (CategoryID, CategoryName)
VALUES
(1, 'Electronics'),
(2, 'Furniture'),
(3, 'Clothing');

INSERT INTO DimProduct (ProductID, ProductName, CategoryID)
VALUES
(101, 'Smartphone', 1),
(102, 'Laptop', 1),
(201, 'Sofa', 2),
(202, 'Desk', 2),
(301, 'Jacket', 3),
(302, 'T-shirt', 3);

INSERT INTO DimWarehouse (WarehouseID, Location)
VALUES
(1, 'Johannesburg'),
(2, 'Cape Town'),
(3, 'Pretoria North');

SET NOCOUNT ON;
DECLARE @i INT = 1;

WHILE @i <= 1000
BEGIN
    INSERT INTO FactInventory (
        InventoryID, ProductID, WarehouseID, Quantity, LastUpdated, DateKey
    )
    VALUES (
        @i,
        (SELECT TOP 1 ProductID FROM DimProduct ORDER BY NEWID()),
        (SELECT TOP 1 WarehouseID FROM DimWarehouse ORDER BY NEWID()),
        ROUND(RAND() * 1000, 0),
        DATEADD(DAY, -ABS(CHECKSUM(NEWID())) % 3650, GETDATE()),
        (SELECT TOP 1 DateKey FROM DimDate ORDER BY NEWID())
    );

    SET @i = @i + 1;
END
Snowflake Schema
The Snowflake Schema is like the Star Schema in terms of having a central fact table that everything passes through, but the main difference is that the Snowflake Schema has normalized dimension tables as opposed to denormalized dimension tables for the Star Schema.
So, the Star Schema typically goes down two levels of data hierarchy while the Snowflake Schema goes to a third level. The purpose of a Snowflake Schema is to normalize the denormalized data in a Star Schema.
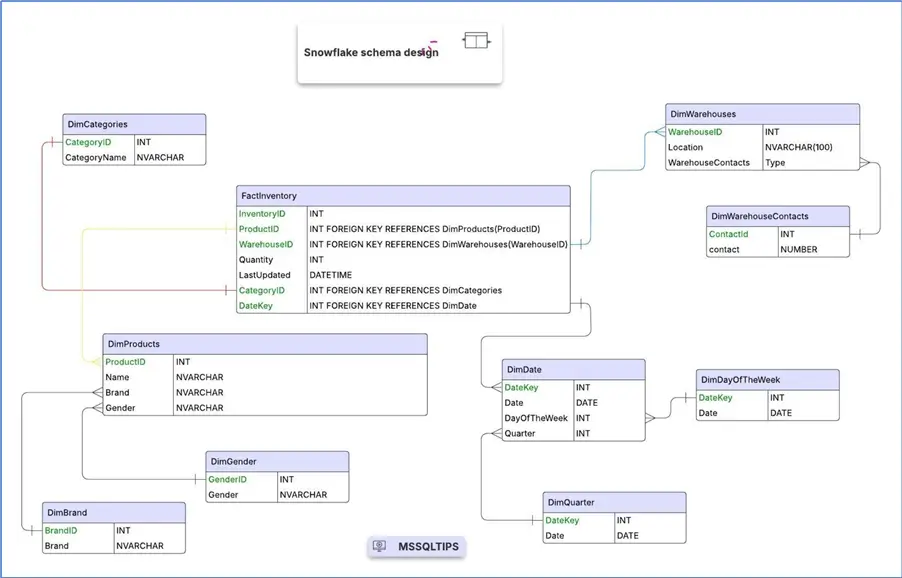
As you can see, the central (fact) table is relatively the same. Dimension tables from the Star Schema are normalized further into tables that break down the data more.
Indexing Tips
Indexes are database structures designed to improve the speed of data retrieval from the database. Like an index for a book, it helps the reader to pinpoint their subject matter much easier without having to browse through every page.
There are three main types of indexes: Clustered, Nonclustered and Columnstore indexes. Clustered indexes are used to sort the table data based on one or more columns; you can only have one clustered index. Nonclustered indexes create separate structures based on other columns to find specific data faster. Columnstore indexes store data column-by-column for compression and speed which can be useful in certain circumstances.
In addition, there is the ability to create a primary key which is a unique key for the table. If you only specify the PRIMARY KEY in the syntax, SQL Server will make this the clustered index.
-- a Clustered Index will automatically be created on primary key
CREATE TABLE DimProduct (
   ProductID INT PRIMARY KEY, -- Clustered index on ProductID
   ProductName NVARCHAR(100),
   CategoryID INT);
Nonclustered indexes are added to an existing table. These are useful for searching and filtering data for specific columns for the WHERE, ORDER_BY and GROUP_BY parts of a query:
-- Creating a nonclustered index on ProductName
CREATE NONCLUSTERED INDEX IX_ProductName
ON DimProduct (ProductName);
Here is an example of creating a columnstore index.
-- Ideal for FactInventory where Power BI reads lots of data
CREATE CLUSTERED COLUMNSTORE INDEX IX_Inventory_Columnstore
ON FactInventory;
Frequently Asked Questions
Normalized database designs store related data across different tables that are linked together with primary and foreign keys. This reduces data duplication and maintains data integrity. The normalization process includes First Normal Form, Second Normal Form and Third Normal Form.
Denormalized database designs consolidate more data into fewer tables. This allows this design to avoid making complex joins when queried. Typically, this results in better performing queries but also duplicate data.
The most popular Power BI schema designs are:
With a Relational Schema, the data is split into multiple normalized tables that are related via referential integrity. This schema is ideal to reduce redundant data and improve data integrity.
With a denormalized schema, data is consolidated into flat tables to simplify queries without the need to perform complex joins. This is ideal for query performance but sacrifices integrity. Usually there is duplicate data.
A Star Schema is designed with a central fact table and related denormalized dimension tables joined by foreign keys.
The Snowflake schema is a derivative of the Star Schema with a central fact table but has normalized dimension tables that are further broken down into smaller dimension tables.
A hybrid design is when any combination of different schemas is built to suit your project requirements.
The database schema determines how Power BI interacts with your database data. The schema dictates how Power BI will retrieve and aggregate data. For example, when implementing a Star or Snowflake Schema, you will create separate dimensional tables for your date entries which will make it much easier for you to implement date related filters in Power BI compared to implementing a relational schema.
For most Power BI or analytical reporting projects, the Star Schema design is the ideal choice. Since it implements a central Fact table with mostly denormalized Dimension tables, the Star Schema enable you to create easier relationships, yields better compression, simplifies Dax calculations and lends itself to clean data with minimal join queries.
The Fact (transaction) table contain numeric values like sales numbers or order amounts. Foreign keys are used to link to dimension tables. So, they provide a numerical measure of attributes described in the dimension tables. The Fact table can have millions or billions of records depending on the data warehouse.
Dimension tables offer context to the numerical data. Items like the salesperson, store, region, product details, etc. The Dimensions contain more descriptive attributes with less records.
A date dimension is a dedicated table with date related attributes like Month, Week Number, and Day of Week. Power BI uses these attributes to execute time intelligence calculations like Rolling averages and Year-to-Date.
The indexes are influenced by the Power BI report’s workload and requirements. Ideally, you want to use clustered index on dimension tables, nonclustered index on frequently filtered columns, and clustered columnstore index on large fact tables.
Yes! In real world cases, different schemas are used for a single project. This approach utilizes the strengths of each schema. For example, you can use a normalized schema for the transactional application, while using a star schema for Power BI reporting on a single project.
Conclusion
There are different database schema designs for different scenarios.
Relational schemas are great for transactional data like real-time records of events in your system (e.g. purchases, inventory changes, etc.) because they are optimized for data integrity and fast write performance, but not for analytics.
Star Schemas are a great option for BI and analytics applications because they are easily joined by flattened dimension tables which help it react fast to read, aggregation and grouping queries.
Snowflake Schemas are like star schemas, but have better dimension management and hierarchy clarity which requires more joins and can make it slower and more complex to query.
These are some basic guidelines of how you might want to structure your data for Power BI reports. Stay tuned for more in-depth articles.
Next Steps
- Learn more about indexing with this SQL Server Index Tutorial Overview.
- Learn more about SQL Create Schema to Organize Objects, Permissions and Management.
- Learn more about snowflake schema by Creating a Snowflake Database Schema and Tables.
- Here is a Power BI Quick Reference Guide

Levi Masonde is a developer passionate about analyzing large datasets and creating useful information from these data. He is proficient in Python, ReactJS, and Power Platform applications. He is responsible for creating applications and managing databases as well as a lifetime student of programming and enjoys learning new technologies and how to utilize and share what he learns.
- MSSQLTips Awards:
Trendsetter (25+ tips) – 2025 | Author of the Year Contender – 2023 | Rookie of the Year Contender – 2022



Hi there,
Looks like the code don’t match the picture where is the code for DimDayOfWeek and DimQuarter?
Thanks,
Oded Dror