Problem
If you run the same query with different parameter values SQL Server may create different query plans for each parameter value. If there are many query plans for a similar query this takes more space in the plan cache. Also, even if the query is the same, the parameter value used might require a different query plan to ensure the best query plan is being used. So, how to you balance the number of query plans for a query and also make sure SQL Server is using the correct query plan? In this article, we look at how SQL Server uses the plan cache and how parameterized SQL queries work.
Solution
When you run a query for the first time, SQL Server generates an execution plan and stores it in the cache. If you rerun the exact same query, SQL Server does not generate a new plan; it uses the existing one. However, this rarely happens, i.e., you do not run the same query repeatedly; queries change and therefore additional query plans get created and added to the plan cache.
For clarity, let’s imagine the first query filters out people who live in ‘Seattle, WA, USA.’ Then, the same query is run again, but this time to find people who live in ‘India.’ SQL Server generates two execution plans, one for ‘India’ and one for ‘Seattle.’ So, what happens if you run your query for China, Brazil, the UK, or anywhere else? SQL Server generates a separate execution plan for each value, resulting in many execution plans being stored in your server cache.
So, what’s the Problem?
Creating an individual execution plan for each value leads to two main problems:
- It causes an increase in CPU usage to compile each query plan.
- It uses more memory for plan caching, which means there’s less available for data caching.
What is an Ad Hoc Query?
An application sends the same query multiple times with different parameters, and SQL Server generates an individual plan for each parameter. In other words, a single query that is not included in a stored procedure and lacks parameterization. This is the concept of ad hoc queries. They cause a bloated plan cache. To mitigate the number of execution plans generated by an application, we need a mechanism to reuse a generated plan for the same queries that have different parameters.
Set Up Test Environment
This demonstration uses SQL Server 2022 and the StackOverflow database. The StackOverflow database is an open-source database from StackOverflow.com. Run the code below in the master database to set the database compatibility level to 160 after restoring.
Use master
GO

Alter Database StackOverflow Set Compatibility_Level = 160
GO
I’m switching to the StackOverflow database and creating a nonclustered index on the Location column in the Users table.
Use StackOverflow
GO

Create Index IX_Location On dbo.Users (Location) With (Data_Compression = Page)
GO
To remove all execution plans from the plan cache, use the command below. You should not use this command in a production environment.
DBCC FREEPROCCACHE
GO
I will turn on STATISTICS IO to display the number of logical reads.
SET STATISTICS IO ON
GO
Simply pressing Ctrl + M to display the actual execution plan.
Run Queries to Generate Query Plans
Let’s take a look at the same query, but use different parameter values. The base query is the following:
Select * From dbo.Users Where Location = First select people who live in ‘Seattle, WA, USA,’ run this query:
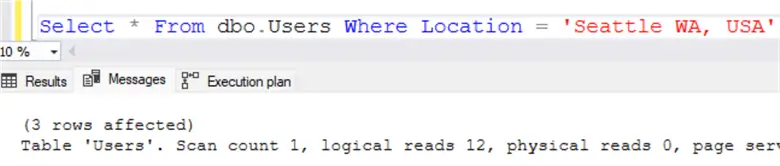
Select * From dbo.Users Where Location = N'Seattle WA, USA'
GO
SQL Server used a nonclustered index seek operation followed by a key lookup.

The number of logical reads is 12 and 3 rows were returned. That’s great.
Run the query again, this time to display information about people who live in India.
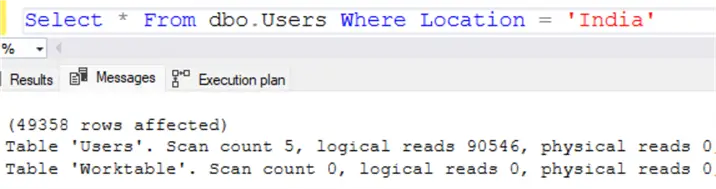
Select * From dbo.Users Where Location = N'India'
GO
SQL Server performed a clustered index scan operation which is different from above.

It did 90K logical reads and returned 49K rows.
I ran the query for the third time, this time for ‘Veneto, Italy.’ Just to see if this gets added to the plan cache.
Select * From dbo.Users Where Location = N'Veneto, Italy'
GO
Check the Plan Cache
By using DMVs as shown below, we can analyze the plan cache:
Select qs.query_hash, qs.query_plan_hash, st.text, qs.execution_count, qp.query_plan
From sys.dm_exec_query_stats qs
Cross Apply sys.dm_exec_sql_text(qs.sql_handle) st
Cross Apply sys.dm_exec_query_plan(qs.plan_handle) qp
Where st.text like '%Users%'
GO
There are three distinct plans stored in the cache:
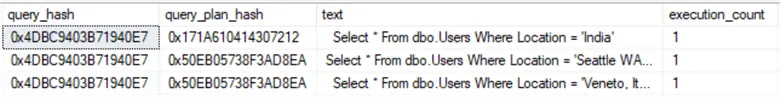
SQL Server generated a separate execution plan for each value: one for ‘India,’ one for ‘Seattle, WA, USA,’ and one for ‘Veneto, Italy.’
Note that the query hashes are identical. If we run our query to show information about other places, SQL Server generates individual plans for each location.
These additional plans cause a “bloated plan cache”.
Database Parameterization Setting
There is a database configuration option that automatically parameterizes SQL statements to improve plan reuse. This can also be used at the query level. It’s called PARAMETERIZATION.
Below, I’m enabling the PARAMETERIZATION option at the database level and running the test again.
ALTER DATABASE CURRENT SET PARAMETERIZATION FORCED WITH NO_WAIT
GO

DBCC FREEPROCCACHE
GO

Select * From dbo.Users Where Location = N'Seattle WA, USA'
GO
Select * From dbo.Users Where Location = N'India'
GO
Select * From dbo.Users Where Location = N'Veneto, Italy'
GO
Let’s analyze the plan cache contents using DMVs:
Select qs.query_hash, qs.query_plan_hash, st.text,
       qs.execution_count, qp.query_plan
From sys.dm_exec_query_stats qs
Cross Apply sys.dm_exec_sql_text(qs.sql_handle) st
Cross Apply sys.dm_exec_query_plan(qs.plan_handle) qp
Where st.text like '%Users%'
GO
There is now only one plan in the plan cache that SQL Server has used three times. It looks like the problem is solved but let’s check closer to make sure.
New Issue – Parameter Sniffing Issue
If we look at the query plans again, we will see that is uses the plan that was generated when we used ‘Seattle WA, USA’. This works great for the two queries that don’t return a lot of data.
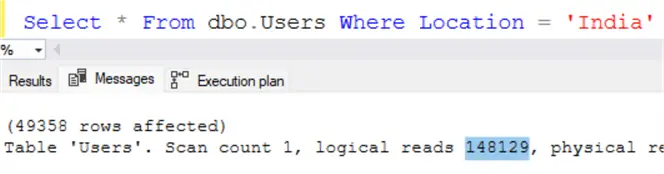
If we look closer for ‘India’ we can see that we now have a lot more reads occurring.
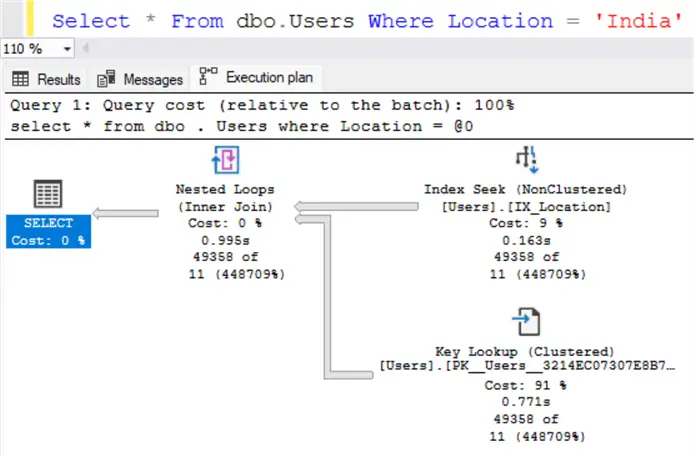
The number of logical reads has increased from 90,000 to over 148,000.
The number of plans in the cache has gone down, but now there’s a new issue: Parameter Sniffing.
What’s the Solution?
I assume we can change the code and wrap it in a stored procedure. The default value for PARAMETERIZATION is Simple.
ALTER DATABASE CURRENT SET PARAMETERIZATION SIMPLE WITH NO_WAIT
GO
I will place the query within a stored procedure:
Create Procedure USP_FindPeopleByLocation
(@Location NVarchar(100))
AS
Select * From dbo.Users Where Location = @Location
GO
Let’s pass ‘Seattle, WA, USA’ as an input parameter value.
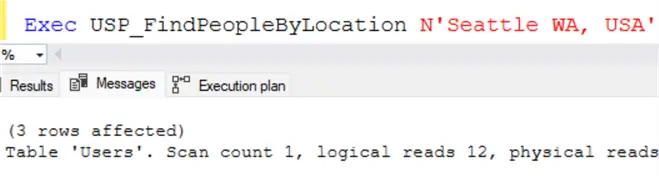
Exec USP_FindPeopleByLocation N'Seattle WA, USA'
GO
SQL Server uses a nonclustered index seek followed by a key lookup operation.

The number of logical reads is 12 and returns the 3 rows.
Next, run the procedure using ‘India’ as an input parameter value.
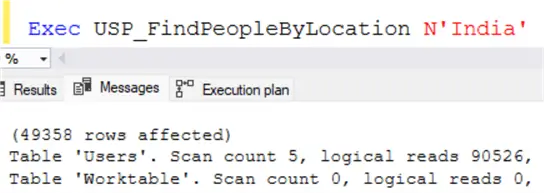
Exec USP_FindPeopleByLocation N'India'
GO
SQL Server used a clustered index scan operation.
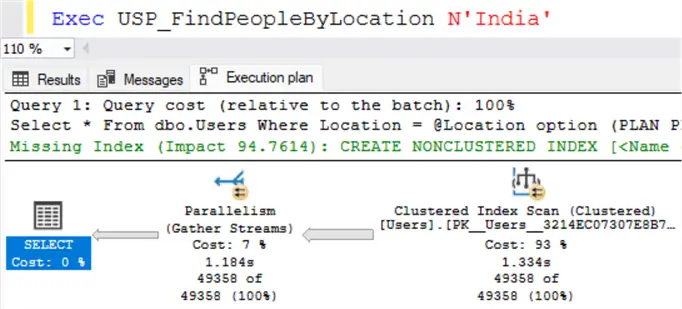
The number of logical reads is approximately 90,000 and returns 49K rows as expected.
Note: Using stored procedures does not resolve the Parameter Sniffing issue. So why did it seem to work in our case? The reason is that SQL Server 2022 introduced a new feature called Parameter Sensitive Plan Optimization (PSPO). The PSPO feature focuses on addressing Parameter Sniffing. It doesn’t completely resolve the issue, only attempts to mitigate its impact.
Finally, I call the stored procedure and pass ‘Veneto, Italy’ as the input parameter value.
Exec USP_FindPeopleByLocation N'Veneto, Italy'
GO
I examine the contents of the plan cache:
Select qs.query_hash, qs.query_plan_hash, st.text,
       qs.execution_count, qp.query_plan
From sys.dm_exec_query_stats qs
Cross Apply sys.dm_exec_sql_text(qs.sql_handle) st
Cross Apply sys.dm_exec_query_plan(qs.plan_handle) qp
Where st.text like '%Users%'
GO
There are two plans in the plan cache. One that returns a lot of rows (India) and the other that only returns a few rows.

Summary
You can use the following simple query to identify which query has many execution plans in the plan cache. If a query has hundreds or thousands of plans in the cache, choose a solution based on your environment to address the bloated plan cache.
Select Top 10 qs.query_hash, Count(qs.query_plan_hash) AS PlanCount
From sys.dm_exec_query_stats qs
Group By qs.query_hash
Order By Count(qs.query_plan_hash) Desc
GO
When an application executes numerous ad hoc queries, the plan cache becomes bloated. To address it, set the PARAMETERIZATION setting to Forced. However, it causes Parameter Sniffing issues. Based on your conditions, you should consider a solution that works best for your environment.
Next Steps
