By: Greg Robidoux | Comments (1) | Related: > Common Runtime Language
Problem
One of the nice things about developing your SQL Server CLR code in Visual Studio is that you get to take advantage of the debugging aspects of the tool. When developing it is always beneficial to use a debugger and step through your code to find any coding problems, but how is this done when writing CLR code for SQL Server?
Solution
In order to take advantage of the debugging aspects for your SQL Server CLR code you need to be using either the Professional or Team Edition of Visual Studio. The following table outlines the edition and which languages you can use the debugger.
| Visual Studio Edition | Visual Basic | C# | C++ | J# | Visual Web Developer |
|---|---|---|---|---|---|
| Express | No | No | No | No | No |
| Standard | No | No | No | No | No |
| Pro/Team | Yes | Yes | Yes | No | No |
(source: SQL Server Books Online)
In addition to having the correct version of Visual Studio and one of the supported languages you also need to make sure the CLR is enabled. Here is a tip that refers to this CLR String Sort Function in SQL Server.
It is important that you know that when you are debugging this will cause all other threads to stop as well, so this is why it is key that you do not try to debug on a production server.
Once you are set you need to enable the debugging for the connection using the "Server Explorer" in Visual Studio as shown below. Server Explorer can be found under the "View" menu item in Visual Studio.
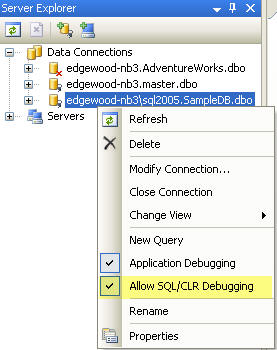
When you enable debugging you will get this message as mentioned above.

Once you have the CLR enabled for SQL Server and the connection has been enabled for debugging you can begin the debug process.
There are three ways you can debug CLR code:
- Stepping into a SQL Server 2005 database object using Server Explorer
- Running a test script using a Visual Studio 2005 SQL Server project
- Running an application that calls a stored procedure
Process 1 - Stepping into an object
If you have already deployed your CLR code to your SQL Server you can browse for the CLR function or SP, right click on it and select "Step Into Function" or "Step Into Stored Procedure" as shown below for the function we are debugging. This is the same function listed in this previous tip CLR String Sort Function in SQL Server.
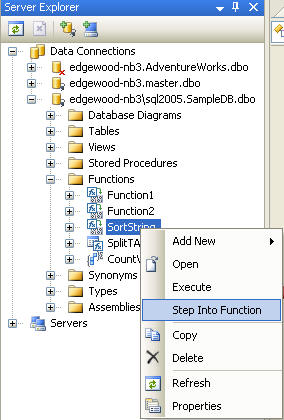
This will execute the function or stored procedure and will pop up a window so you can enter in values for the parameters as shown below.
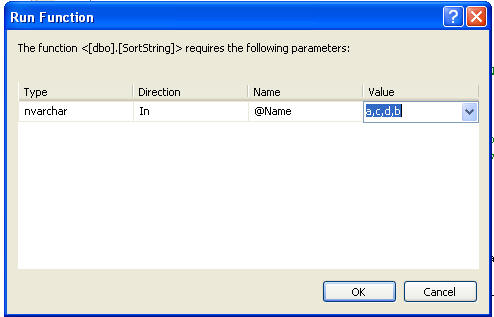
After you enter the value and click "OK" the debugging process will begin. The first place it will stop is at the beginning of the function code whether you use a breakpoint or not as shown below.
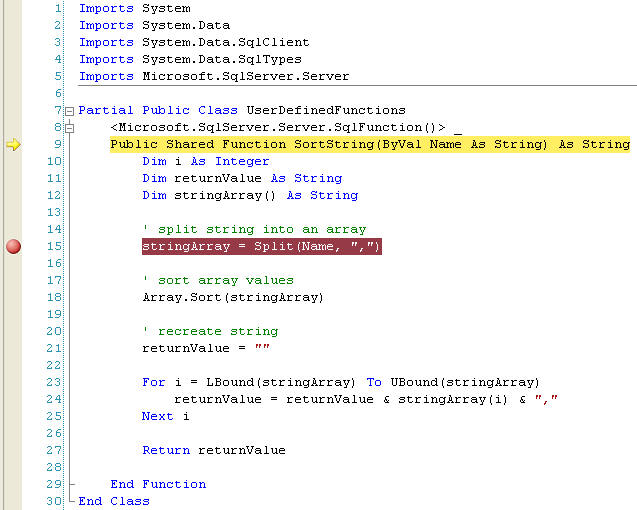
At this point we can step through each line of the code using the debug controls toolbar as shown below or by using the options in the "Debug" menu.
In the Locals window you can see the variable values as they change as shown below. In addition, you can take advantage of other debugging features as well.

Process 2 - Using a test script
Another way is to create a test script and then debug the test script. The test scripts get created in your solution in the "Test Scripts" folder.
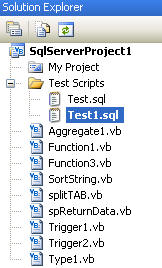
Here is what the code in our Test1.sql script looks like. This is going to run the sortString function with the values shown below.

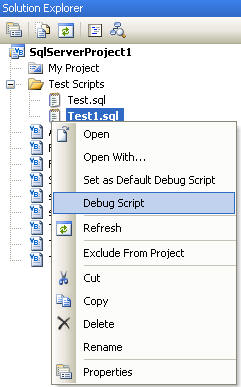
After you have set your breakpoints, to start the debug process right click on the test script and select "Debug Script". One thing to note for this approach is that you have to set breakpoints otherwise the debugger will not stop it will just execute all of the code. This is one difference from Process 1.
Once the debug process starts it will stop at the first breakpoint as shown below.
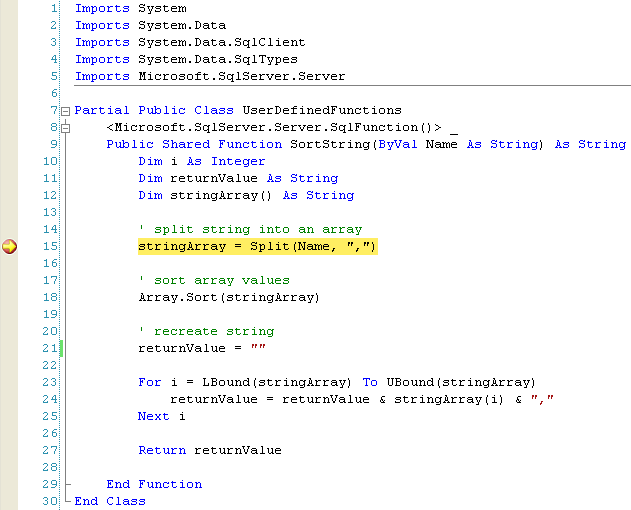
At this point you can step through each line of code and see the values as they change.
Process 3 - Test with an application
In this process you are debugging your application. If the application calls the SQL Server CLR code and you have breakpoints setup you can debug the code.
Next Steps
- Although this is not a comprehensive end to end process for coding and debugging it should hopefully give you enough information to begin debugging your code
- To debug a trigger you can create a test script that does an insert, update or delete against your table and it will allow you to debug your trigger code as long as you have setup breakpoints. Another way this could be done is to debug a stored procedure which in turn fires the CLR trigger.
About the author
 Greg Robidoux is the President and founder of Edgewood Solutions, a technology services company delivering services and solutions for Microsoft SQL Server. He is also one of the co-founders of MSSQLTips.com. Greg has been working with SQL Server since 1999, has authored numerous database-related articles, and delivered several presentations related to SQL Server. Before SQL Server, he worked on many data platforms such as DB2, Oracle, Sybase, and Informix.
This author pledges the content of this article is based on professional experience and not AI generated.
View all my tips


