By: Greg Robidoux | Comments (4) | Related: More > Scripts
Problem
One thing that frustrates me is that sometimes I write these great queries, but often forget to save them or can't remember exactly what the query looked like that I ran five iterations ago. One smart thing to do would be to always save your scripts, but when your in the process of trying a bunch of different things there is always the chance you may loose something. In this tip we look at creating a server side trace for one session and capturing all completed batches that are run, so you can find that great query that you thought you may have lost.
Solution
The first thing that needs to be done is to create two stored procedures, which I created in my master database. These allow you to create a server side trace and also turn off a server side trace. For more information about a server side trace refer to this tip, SQL Server Performance Statistics Using a Server Side Trace.
Starting the Trace
The first stored procedure shown below starts the server side trace, but it also excepts the SPID for the particular session you want to capture. It will create a file name such as "TraceMySession_52_d20090317120912.trc" to keep the trace session unique. This is set to save to the file to the "C:" drive of the server, so you may want to change this to a different directory. The script is also setup to create a 5MB file and then roll over to additional files. Again you can check out the tip mentioned above for more about these settings.
The other thing that we are doing is only capturing the SQL:BatchCompleted events. This way the trace file doesn't get very large. The three data columns that will be captured are TextData, StartTime and SPID.
To create the procedure, copy the code below and execute it. Like I said I created this in the master database, but this could be created in a different database.
CREATE PROCEDURE [dbo].[spTraceMySessionStart] @spid INT
AS

-- Create a Queue
DECLARE @rc INT
DECLARE @TraceID INT
DECLARE @maxfilesize bigint
SET @maxfilesize = 5
DECLARE @filename NVARCHAR(245)
SET @filename = 'C:\TraceMySession_'
   + CONVERT(NVARCHAR(10),@spid)
   + '_d'
   + REPLACE(CONVERT(VARCHAR, GETDATE(),111),'/','')
   + REPLACE(CONVERT(VARCHAR, GETDATE(),108),':','')

EXEC @rc = sp_trace_create @TraceID output, 2, @filename, @maxfilesize, NULL
IF (@rc != 0) GOTO error

-- Set the events
DECLARE @on bit
SET @on = 1
EXEC sp_trace_setevent @TraceID, 12, 1, @on
EXEC sp_trace_setevent @TraceID, 12, 12, @on
EXEC sp_trace_setevent @TraceID, 12, 14, @on

-- Set the Filters
DECLARE @intfilter INT
DECLARE @bigintfilter bigint
EXEC sp_trace_setfilter @TraceID, 12, 1, 0, @spid

-- Set the trace status to start
EXEC sp_trace_setstatus @TraceID, 1

-- display trace id for future references
SELECT TraceID=@TraceID
GOTO finish

error:
SELECT ErrorCode=@rc

finish:
Stopping the Trace
This stored procedure below will stop and close the trace once you are finished. If this is not run the server side trace will continue to run and collect data for any other session that happens to have the same SPID.
This stored procedure excepts one parameter which is TraceID. When you actually run the first stored procedure it will give you the TraceID that was created. This is the value that you pass to this second stored procedure to stop and close the trace.
I also created this in my master database, but this can be created in a different database as well.
CREATE PROCEDURE [dbo].[spTraceMySessionStop] @traceId INT
AS
EXEC sp_trace_setstatus @traceId,0
EXEC sp_trace_setstatus @traceId,2
Let's Try It
So let's say we have the following code that we want to run.
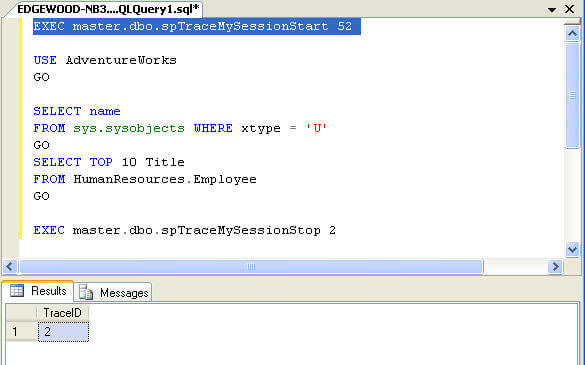
EXEC master.dbo.spTraceMySessionStart 52

USE AdventureWorks
GO

SELECT name
FROM sys.sysobjects WHERE xtype = 'U'
GO
SELECT TOP 10 Title
FROM HumanResources.Employee
GO

EXEC master.dbo.spTraceMySessionStop 2
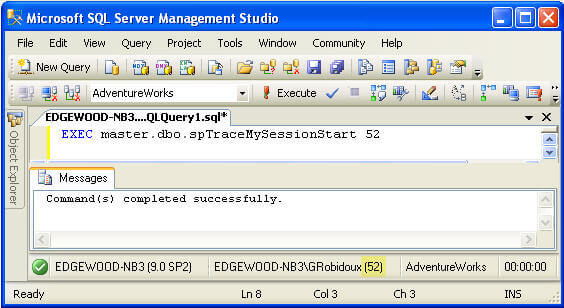
The first thing that we need to do is start the trace which is the first line of my script. I can see my SPID at the bottom of the screen which is 52, which has been highlighted below.
When I run the store procedure, the output shows me the TraceID which is "2". We need to keep this value for later.
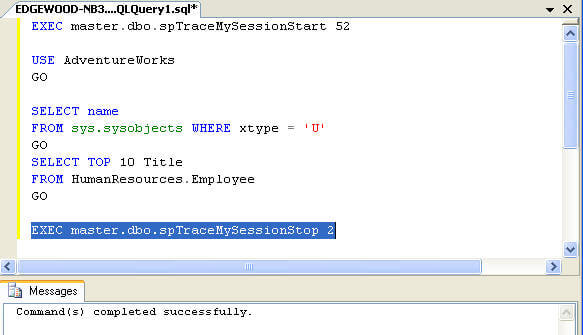
After I have run my other commands and I am done, I can run the last line to stop and close the trace and use the TraceID value of "2" which we got above.
Reviewing What Was Captured
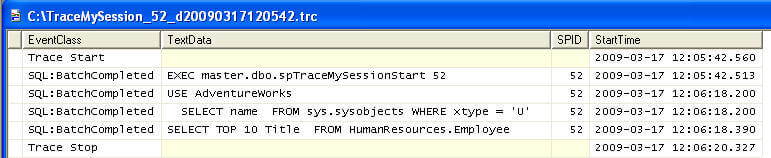
If I open the file that was created using Profiler I can see all of the commands that were run for my session. You could then copy these lines into a query window for reuse.
Another option is to load the file that was created to a SQL Server table or just query the data using SQL Server. The steps for doing this can be found in this tip.
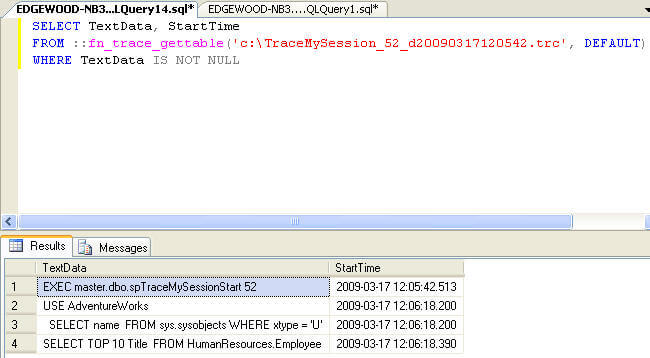
SELECT TEXTData, StartTime
FROM ::fn_trace_gettable('c:\TraceMySession_52_d20090317120542.trc', DEFAULT)
WHERE TEXTData IS NOT NULL
Next Steps
- Hopefully this gives you another tool you can use to capture all of the batches that are run for a session for future reference.
- Try changing this to add other columns or events
- Also change this to capture multiple SPIDs at once
- Refer to this tip for more information on creating a Server Side Trace


About the author
 Greg Robidoux is the President and founder of Edgewood Solutions, a technology services company delivering services and solutions for Microsoft SQL Server. He is also one of the co-founders of MSSQLTips.com. Greg has been working with SQL Server since 1999, has authored numerous database-related articles, and delivered several presentations related to SQL Server. Before SQL Server, he worked on many data platforms such as DB2, Oracle, Sybase, and Informix.
This author pledges the content of this article is based on professional experience and not AI generated.
View all my tips
