By: Nitansh Agarwal | Updated: 2022-12-19 | Comments (26) | Related: 1 | 2 | 3 | 4 | > Locking and Blocking
Problem
In our SQL Server environment, we have frequent locking and blocking across a few different versions of SQL Server. How can I find blocking and blocked SPID's in SQL Server? Is there only one way to find out which spids are blocking? Are there commands I can run against multiple SQL Server versions? Check out this tip to learn more about locking and blocking.
Solution
Whenever a user contacts the DBA team indicating a process looks hung or a process is not proceeding, checking for database blocking makes a great deal of sense. Blocking happens when one database connection holds a lock and a second connection needs a lock on the same obect. This forces the second connection to be blocked until the first connection completes. With this being said, locking is a natural occurrence in SQL Server in order to maintain data integrity. For more information about locking and blocking review these tips: Understanding SQL Server Locking and Understanding SQL Server Blocking.
There are number of ways to find out the details of the system processes IDs (spids) involved in blocking. I have tried to cover some of the options in this tip to include:
- sp_who2 system stored procedure
- sys.dm_exec_requests DMV
- sys.dm_os_waiting_tasks
- SQL Server Management Studio Activity Monitor
- SQL Server Management Studio Reports
- SQL Server Profiler
- SQL Server Extended Events
sp_who2 system stored procedure
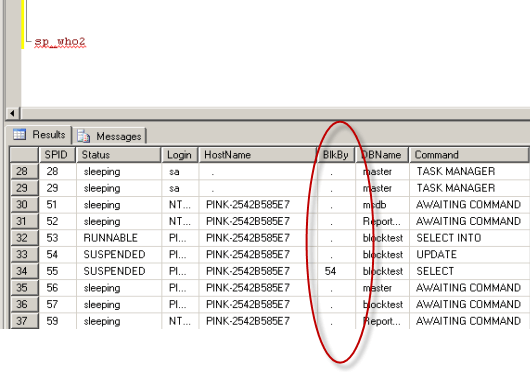
The sp_who2 system stored procedure provides information about the current SQL Server processes with the associated users, application, database, CPU time, etc. The stored procedure can be filtered to return only the active processes by using the 'active' parameter.
Below is sample code and a screen shot showing process 55 is being blocked by process 54.
USE master
GO
EXEC sp_who2
GO
Additional resources:
- SQL Server Command Line Tools To Manage Your Server
- Locking and Blocking Scripts in SQL Server 2000 vs SQL Server 2005
- Killing a SPID and Checking Rollback progress in SQL Server
sys.dm_exec_requests DMV
The sys.dm_exec_requests DMV provides details on all of the processes running in SQL Server. With the WHERE condition listed below, only blocked processes will be returned.
USE master
GO
SELECT *
FROM sys.dm_exec_requests
WHERE blocking_session_id <> 0;
GO
Additional resources:
- How to isolate the current running commands in SQL Server
- Finding a SQL Server process percentage complete with dynamic management views
sys.dm_os_waiting_tasks DMV
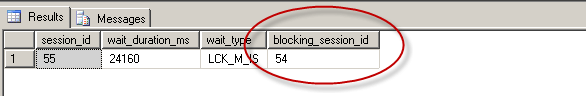
The sys.dm_os_waiting_tasks DMV returns information about the tasks that are waiting on resources. To view the data, users should have SQL Server System Administrator or VIEW SERVER STATE permissions on the instance.
USE master
GO
SELECT session_id, wait_duration_ms, wait_type, blocking_session_id
FROM sys.dm_os_waiting_tasks
WHERE blocking_session_id <> 0
GO
Additional resources:
SQL Server Management Studio Activity Monitor
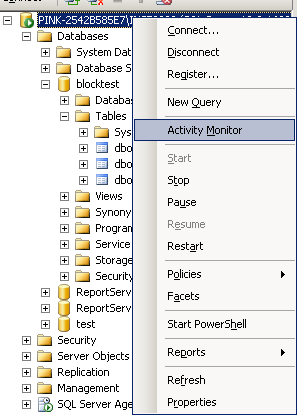
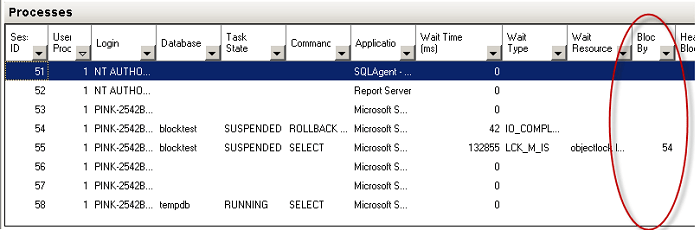
If you are more comfortable using SQL Server Management Studio to review locking and blocking as opposed to querying system objects or executing stored procedures, you are in luck. There are even a few different tools in SQL Server Management Studio you can use. The first option is the Activity Monitor, which can be accessed by navigating to the instance name, right clicking on the instance name and selecting 'Activity Monitor'. To view the Activity Monitor in SQL Server, users should have SQL Server System Administrator or VIEW SERVER STATE permissions on the instance.
Additional resources:
SQL Server Management Studio Reports
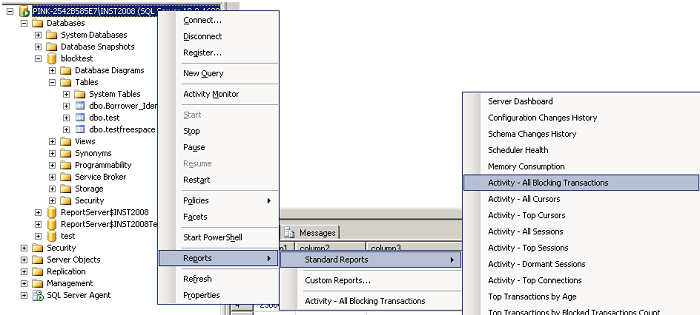
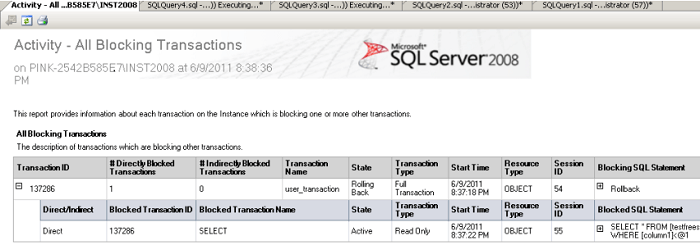
The second option in SQL Server Management Studio to monitor blocking is with the standard reports, which can be accessed by navigating to the instance name, right clicking on the instance name and selecting Reports > Standard Reports > Activity - All Blocking Transactions. Once again, users should have SQL Server System Administrator or VIEW SERVER STATE permissions on the instance.
Additional resources:
SQL Server Profiler
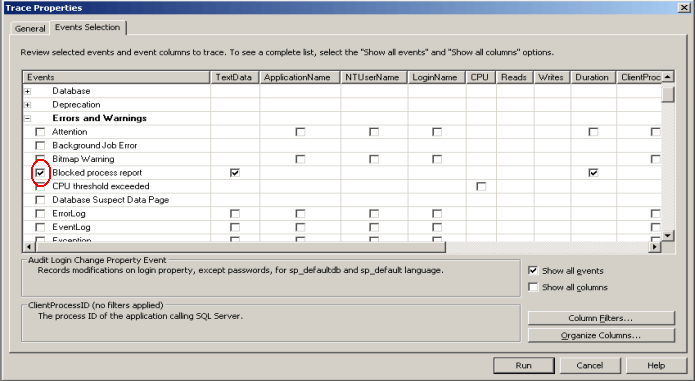
To capture blocking related data on a continuous basis, one option is to run SQL Server Profiler and save the data to a table or file for analysis purposes. Launch Profiler and connect to the SQL Server instance. On the Events Selection tab, click on Show all events. Navigate to the Errors and Warnings section, check the Blocked process report and any columns you want to return and then click Run. In addition, be sure to configure the 'blocked process threshold' before you start Profiler using the code below.
sp_configure 'show advanced options', 1
GO
RECONFIGURE
GO
sp_configure 'blocked process threshold', 20
GO
RECONFIGURE
GO
Additional resources:
- Tip category: Profiler and Trace
- Capturing SQL Server Deadlock Information in XML Format
- Finding and troubleshooting SQL Server deadlocks
- SQL Server Profiler Graphical Deadlock Chain
Extended Events Session
You can do something similar to Profiler using Extended Events. The following screen shows you the event to capture.
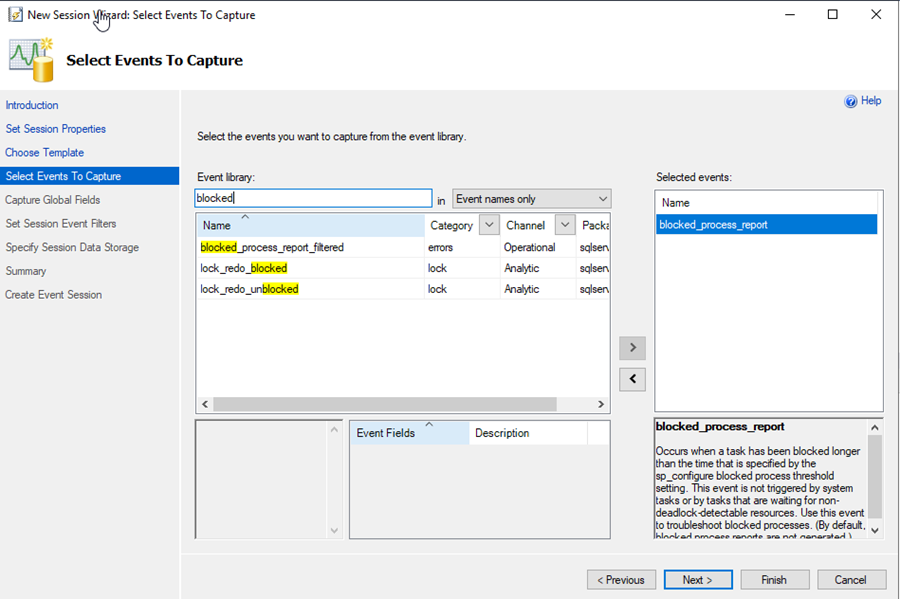
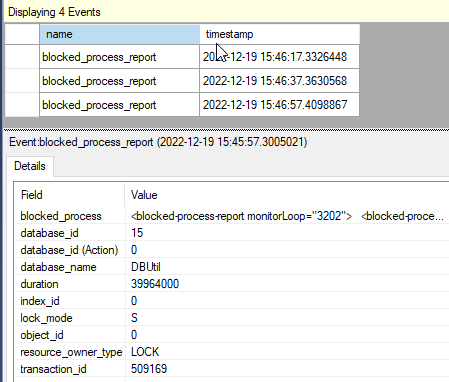
Here is a sample of the output you will get from the blocked_process_report_filtered event.
Next Steps
- If you are faced with a blocking situation, be sure to consider all of your options in the short and long term. To resolve the immediate issue, you may need to KILL some spids, but to resolve the issue you may need to change your database design, change your data access, add NOLOCK hints to particular queries if absolutely necessary, etc.
- Check out these tips to learn more about locking and blocking


About the author
 Nitansh Agarwal is a lead with 4+ years of extensive experience in database administration where he handles large critical databases.
This author pledges the content of this article is based on professional experience and not AI generated.
View all my tips
Article Last Updated: 2022-12-19
