By: Arshad Ali | Comments (8) | Related: > Analysis Services Tutorials
Problem
In my last tip, Understanding BI Semantic Model (BISM) of SQL Server 2012, I talked in detail about the new BISM, its architecture, how it differs from the earlier UDM and how BISM lays down a foundation for the future. In this tip I am going to talk in detail about differences between the multi-dimensional model and tabular model, when to choose one model over the other and go through a step by step guide on creating a tabular model project.
Solution
Analysis Services in SQL Server 2012 can be either deployed in a multi-dimensional model for creating multi-dimensional and data mining projects or tabular model mode for creating a tabular/relational project (note: there is also a third option for PowerPivot for SharePoint as well).
The tabular model is relatively easy to understand and is used by a large group of developers vs. the multi-dimensional model hence it makes sense to embrace the relational/tabular data modeling for broader adoption and to ensure utilization of a customers' existing investments and skills available. This foundation provides both multi-dimensional as well as tabular data modeling capabilities, to offer the best of both worlds and also a choice to the solution designer/developer which is called the BI Semantic Model (BISM).
Tabular Modeling
Tabular model is a new type of analysis services database structure that Analysis Services supports in SQL Server 2012. When we create a project based on the tabular model, SQL Server Data Tool (SSDT) adds a Model.bim file to the project and creates a workspace database on the Analysis Services instance (installed in tabular mode) that we specify. It uses this workspace database as temporary storage for data, while you develop the model by importing data from the underlying data sources and designing objects that organize, enhance, and secure the data.
At this point, some people might think why include tabular modeling now, when should we use a multi-dimensional model vs. a tabular model, so let discuss these items first before we start creating a tabular model project.
Multi-dimensional vs. Tabular...which one to choose
Although there are no straight forward rules/guidelines for choosing one or the other, I have listed below some of the scenarios from my experiences (though this is not a comprehensive list). Please note, some of the scenarios may change in future releases, for example currently Power View works against the tabular model only, but in the future it might work against the multi-dimensional model as well:
Tabular Model
- When your source is based on relational database modeling and has basic (1:N) relationships; one single model can pull data directly from multiple external sources without the need of ETL
- You want to use DAX for scripting; much easier to learn than MDX
- Uses VertiPaq (xVelocity) engine for in-memory column store storage, data is stored in a highly compressed format; which means it does not require pre-calculated aggregates, bitmap indexes etc... In-memory column store storage gives great performance, but that does not mean the tabular model will always be faster than the multi-dimensional model. This reason for this is because the results of DAX queries are never stored within the cache which means that a DAX query will always take the same time to execute whenever it is run whereas the multi-dimensional model keeps the query results in cache and as such the more the cube is used, the better query performance you will get on subsequent query executions.
- No support for Write-back, Actions, Custom Assemblies, Custom Rollups, Custom Drillthrough Actions, Linked objects, or Translations
- You want to use Power View for reporting
- It is faster to develop and less expensive to use in terms of time, resources and skill requirement
- Tabular modeling and DAX language has a less steep learning curve, but complex capabilities may require sophisticated DAX expressions to be written
Multi-dimensional Model
- When your source is based on dimensional modeling, has dimensions and facts, has complex relationships and has a very large volume of data
- You want to use MDX as it is more powerful and has more features (complex calculations, scoping, and named sets etc.) than DAX
- Use MOLAP storage, data stored in compress format; it pre-calculates aggregates and uses bitmap indexes
- Support for Write-back, Actions, Custom Assemblies, Custom Rollups, Custom Drillthrough Actions, Linked objects, Parent-child hierarchy, or Translations
- Your solution requires complex modeling or the dataset is extremely large
- Native support for Parent-child hierarchy or many-many relationships as opposed to tabular model where you need a complex work around
- Dimensional modeling and MDX language create has a steep learning curve, but natively provide more complex capabilities
To summarize, tabular model is simple, keeps data entirely in memory, providing exciting performance potential without any special tuning vs. the multi-dimensional model, but it does not support features such as write-back, complex calculations, named sets, many to many relationships and very large or complex cubes.
Getting Started with Tabular Model Project...
When you click on the New Project in SQL Server Data Tool, you will notice these 5 template options under Analysis Services node as discussed below:
- Analysis Services Multidimensional and Data Mining Project - This template is used for creating project based on a multi-dimensional model. This template is what we have been using in previous versions of Analysis Services. Also this template is used for creating data mining projects as well.
- Import from Server (Multidimensional and Data Mining) - This template is used for importing an already deployed multi-dimensional or data mining project on Analysis Services instance to the project file.
- Analysis Services Tabular Project - This template is used for creating projects based on the new tabular project model. Please note, this type of project can only be deployed on instances installed in tabular mode.
- Import from PowerPivot - This template is used for importing a model from a workbook deployed on PowerPivot for SharePoint instance of Analysis Services. Once imported, the project can be enhanced with additional features of tabular model and can be deployed on an instance installed in tabular mode.
- Import from Server (Tabular) - This template is used for importing an already deployed tabular model project on Analysis Services instance (tabular mode) to the project file.
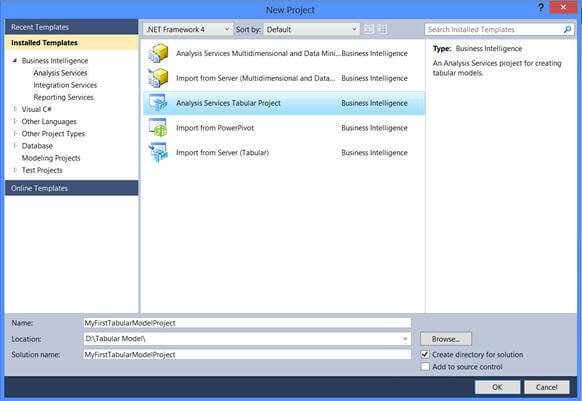
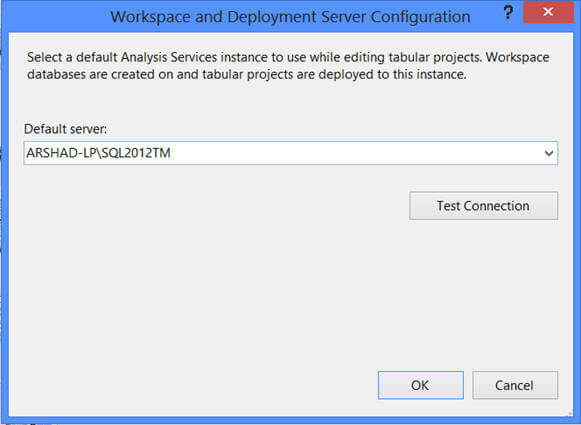
As I wanted to create a new project based on the tabular model, I selected "Analysis Services Tabular Project" template, specified a name and location for the project and when I clicked on OK it brought up another screen as shown below. In this screen, I need to specify an instance of Analysis Services installed in tabular mode and this instance will be used for creating a workspace database for the project.
A workspace database is created for temporary storage for data imported when we develop a model using the SQL Server Data Tool. Whenever we view data in the diagram view or the data view of the model designer, SQL Server Data Tool retrieves the data from the workspace database. We can modify the properties related to the workspace database by right clicking on Model.bim and modifying it in the Properties window.
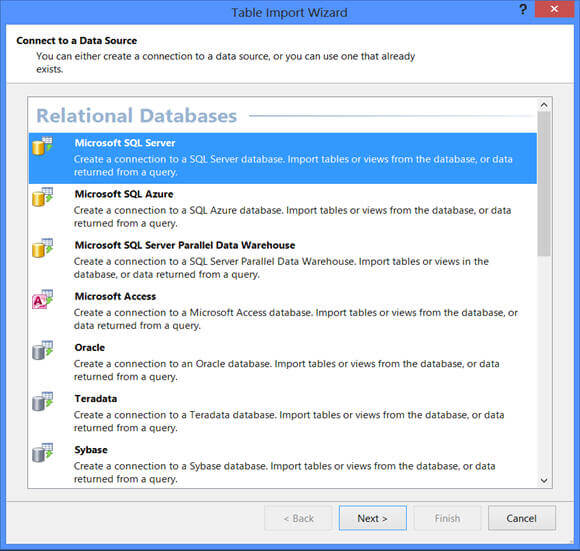
Once a project is created, you will notice one file "Model.bim" created as part of the project creation. Now we need to import the data into the project/model to start designing the project. In order to import data into the project, click on "Import from Data Source" to launch the Table Import Wizard as shown below. As you can see, you can import data from heterogeneous sources into the project.
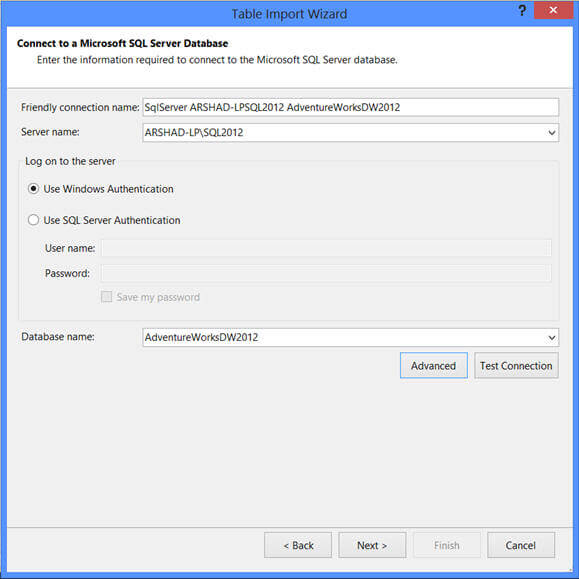
Clicking on Next on the Table Import Wizard, as shown above, will take you to the next screen where you need to specify the information/credentials required for connecting to the data source to pull data from.
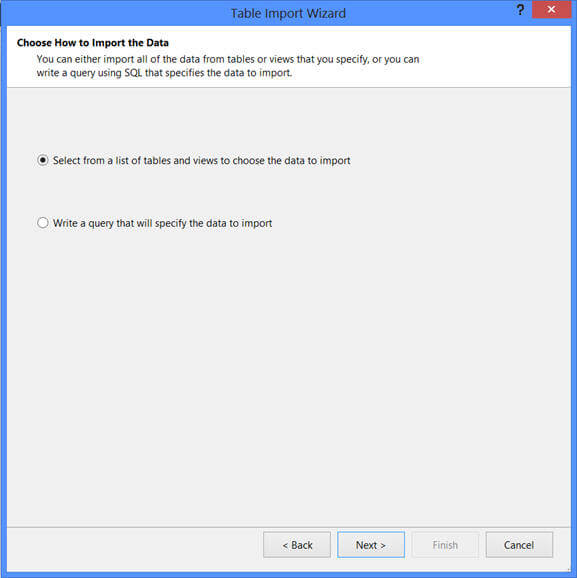
On the next screen of the wizard you need to specify whether you want to pull data directly from tables or views of the data source or write queries for importing data as shown below:
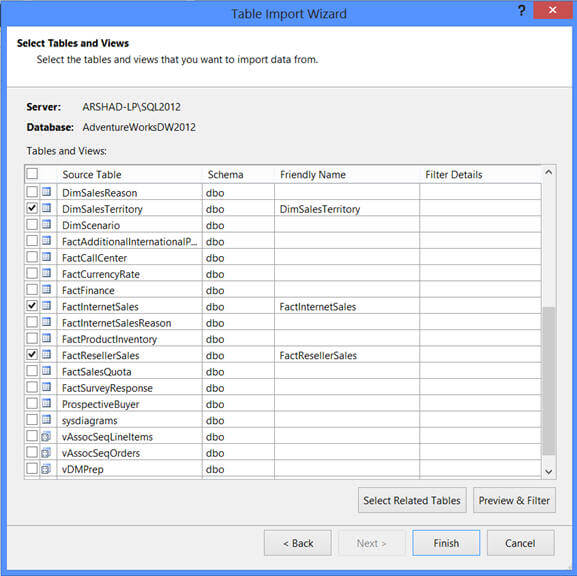
As I selected to pull data directly from data source's tables and views as above, on the next screen I get the list of tables and views available on the source as shown below. There are a couple of options here, you can select a table and click on the "Select Related Tables" button to include all the related tables (based on referential integrity) to import the data.
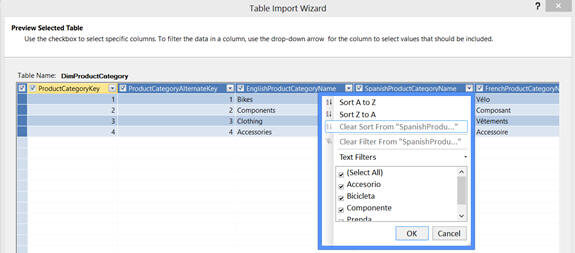
The "Preview & Filter" button on the above screen lets you preview the data for the selected table and also you can specify filter conditions to remove unwanted data during the data import.
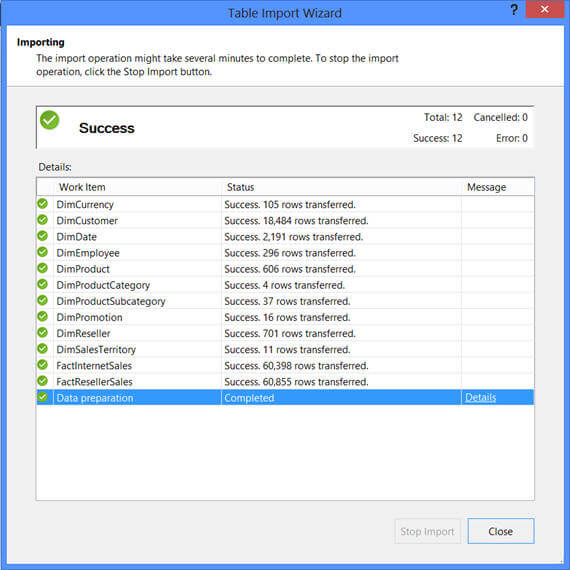
Clicking on the Finish button on the last screen will kick off the data import process and the status of the data import will be shown as in the screen below:
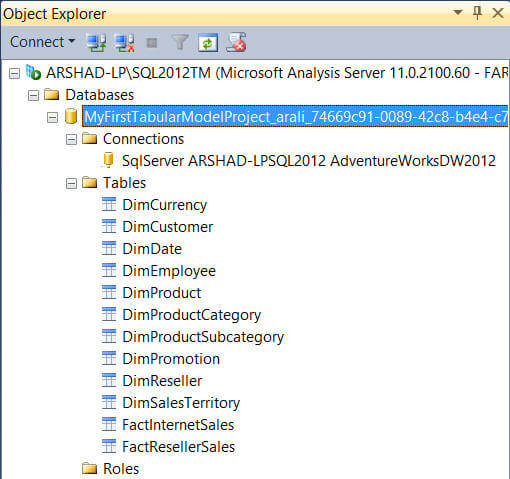
As I said earlier, every project based on a tabular model we create will have a corresponding workspace database on the instance we have specified. In my case you can see the database for the project I created, it lists tables as I have already imported data from the data source.
The tabular model project can be viewed either in Grid view of Diagram view. Double click on the Model.bim file in the Solution Explorer and by default you will see the Grid view of all the tables of the model in a workbook style.
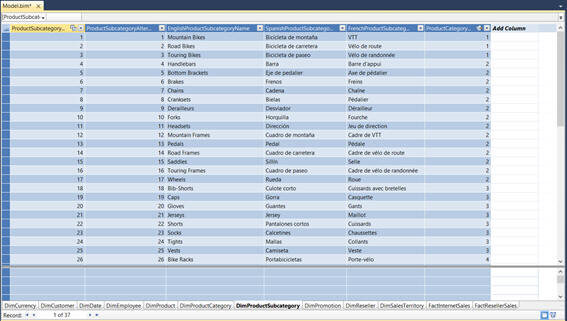
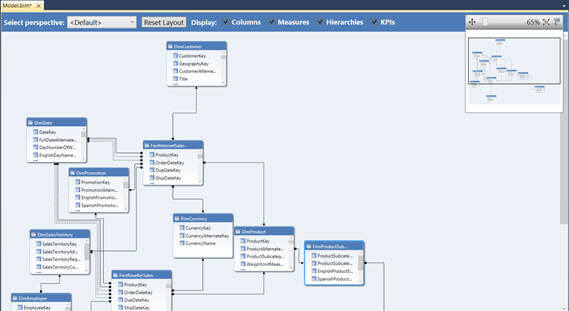
You can click on the tiny icon on the bottom of the Grid view to switch back and forth between Grid view and Diagram view.
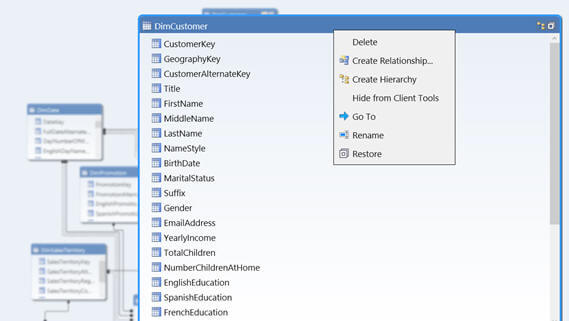
You can select any of the tables in the Grid view and maximize it as shown below. You can right click on any of the tables if you want to create a relationship, hierarchy or if you want to hide the table from appearing in the client tool.
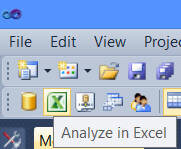
So far so good, we have created a project based on the tabular model, imported data from the data source into the project and so now let's analyze data from this project. In order to do so, you can click on the Excel icon in the tool bar as shown below:
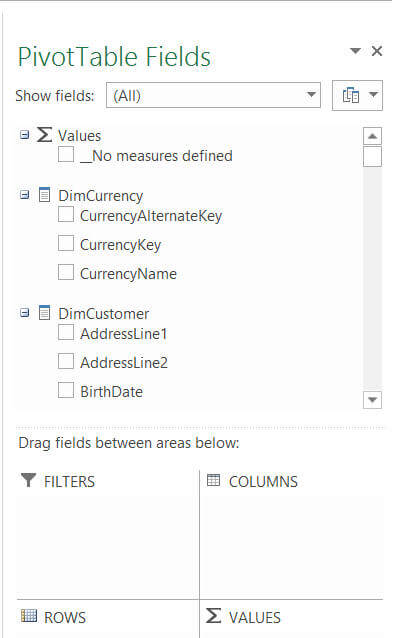
Clicking on the Excel icon will open the project in an Excel PivotTable. But what is this? I can see some dimensions, but no measures. This is because we just imported the data from the data source and have not yet specified any measures, so let's do that now.
What I want to do is create 6 measures, 3 for each Reseller Sale and Internet Sale. In order to do so, I returned back to the Grid view of the project, selected the columns one by one and clicked on the Sum icon in the tool bar for summing up the values (you also have other choices as well like Average, Count, DistinctCount, Max and Min). You can see these measures appearing in the Measure Grid on the bottom of the Grid view; if they don't show up click on the "Show Measure Grid" icon in the tool bar.
And now, since we have created measures, we can analyze the model in the Excel PivotTable and see the measures appearing as shown below:
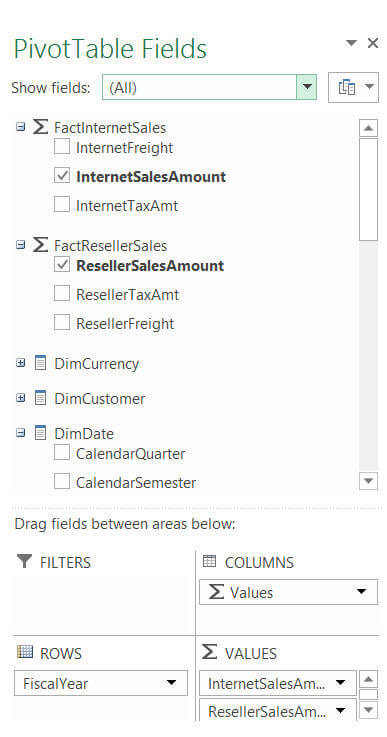
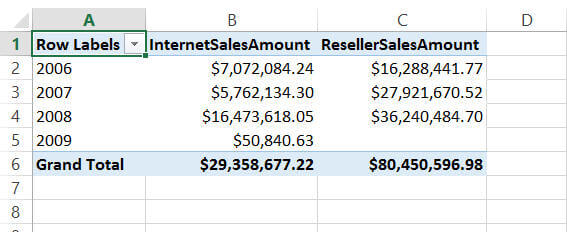
Now we can select whatever measure we want to analyze against whatever dimensions in the PivotTable. For example as you can see below I have included yearly analysis of InternetSalesAmout and ResellerSalesAmount.
If you have prior experience working with PowerPivot, you might be thinking what we did so far is very similar to what we can do in PowerPivot. Well, you are right to some extent. Tabular model is actually a server side version of PowerPivot, but also has many more enterprise features which are not available in PowerPivot such as partitioning, security, management etc...
In the next tip I am going to talk in detail about some of the compelling features of Tabular model and show you how Tabular model differs from PowerPivot.
Next Steps
- Review tip Understanding BI Semantic Model (BISM) of SQL Server 2012
- Review Analysis Services - Roadmap for SQL Server Code Name "Denali" and Beyond
- Review Comparing Tabular and Multidimensional Solutions (SSAS)
- Review SQL Server 2012 tips
- Review my previous tips


About the author
 Arshad Ali is a SQL and BI Developer focusing on Data Warehousing projects for Microsoft.
This author pledges the content of this article is based on professional experience and not AI generated.
View all my tips
