By: Nai Biao Zhou | Comments (7) | Related: 1 | 2 | 3 | 4 | > Database Design
Problem
One technology principle recommended by the Open Group Architecture Framework (TOGAF) is to control technical diversity [1]. To apply this principle, a software development team wants to create a data warehouse with the Microsoft toolset. The team has taken Kimball’s advice [2,3] and considered using the star schema as the data warehouse schema. Furthermore, facts and dimensions have been identified and documented. After team members have pored over Kimball’s other book [4], the team is ready to build a DW/BI system. Due to lack of experience on data modeling, the team wants to know how to manipulate Microsoft tools to create and maintain a star schema data model.
Solution
To practice creating a star schema data model from scratch, we first reviewed some data model concepts and attested that the SQL Server Management Studio (SSMS) has the capacity for data modeling. Then, we created a database through the SSMS, and this allowed us to produce conceptual and logical data models. After looking into the definition of the physical data model, I have made a bold statement that a database project, provided through SQL Server Data Tools (SSDT), could describe a physical data model. Therefore, we generated a physical data model by importing the logical data model, which lives in a database, into a database project in Visual Studio 2017. The database project, containing the object definitions and deployment scripts, fully integrates with source code control software. We committed the database project into the Team Foundation Version Control (TFVC). In the end, through the TFCV, we were able to generate the conceptual and logical model diagrams and an actual database. This guarantees the data model consistency.
The solution was tested with SQL Server Management Studio V17.4 and Microsoft Visual Studio Community 2017 on Windows 10 Home 10.0 <X64>, and Visual Studio Team Services (VSTS) [5] in the cloud. The DBMS is Microsoft SQL Server 2017 Enterprise Edition (64-bit). The transactional database schema was retrieved from the AdventureWorks2017 [6].
Create Data Models
Regarding data models, there are some variations in the way they are defined. We adopted the fundamental concepts and definitions that are introduced in the book [7]. There are three primary types of data models; conceptual, logical, and physical. Most data modeling tools, listed in [8], accept this classification. However, [8] does not clarify that the SSMS support any type of data models. Due to characteristics of star schema, SSMS, like other tools in [8], fully meets star schema data model development requirements.
I would like to point out that some tools in [8] do not support conceptual model. In a data warehousing project, sometimes the conceptual data model and the logical data model are considered as a single deliverable [9]. We usually create a conceptual data model first, then work on a logical data model. After approval of the logical data model, we produce a physical data model. We are going to use dimensions and facts shown in Table 1 to demonstrate the modeling process.
| Dimensions | Facts |
|---|---|
|
(1) Date dimension (2) Individual customer dimension (3) Store dimension (4) Territory dimension (5) Sales order number (degenerate dimension) (6) Employee dimension (7) Product dimension (8) Special offer dimension |
Granularity: by each sales order (1) Sale subtotal (2) Tax amount (3) Shipping cost |
| Granularity: by every product on every order (1) Quantity ordered per product (2) Product subtotal (3) Discount amount |
Table 1 Dimensions and Facts in AdventureWorks Data Warehouse
The Conceptual Data Model
A conceptual data model is used to describe entities and their relationships. High-level business users, such as executive managers, can comprehend the model diagram. Nowadays, computer technologies have been widely used. Non-technical users can understand some technology conventions; for instance, the compound noun, Individual Customer, is written as “Individual_Customer”. On the other hand, technology providers work to remove some limitations on naming. The maximum character length of an object in SQL Server 2017 is 128, and SQL Server also allow space in an object name. “Individual Customer” or “Add a New Individual Customer” is a valid object name in SQL Server. This enables business users and technical experts to share a common, rigorous language. Therefore, entity names used in the conceptual model can be used in other two types of data models.
Let’s declare some naming conventions in this exercise. We add a prefix “dim” and a prefix “fact” to dimension table names and fact table names, respectively; and we append a suffix “key” to the entity identifier’s name. We separate two English words with an underscore; for example, the term “dim_individual_customer” represents an individual customer dimension or an individual customer dimension table, and “individual_customer_key” is the identifier’s name of this entity.
A typical data model contains many entities, along with their relationships. To understand a diagram consisting of all these entities and relationships is beyond human’s capacity to process information. Other data modeling tools, for example, “Toad Data Modeler”, can divide a model into multiple workspaces for easier management. One best practice is to create a workspace for each fact table, which splits a complicated model into manageable chunks. Inspired by these Toad practitioners, we are going to create a database diagram in the SSMS for each fact table. Let’s walk through this process step by step.
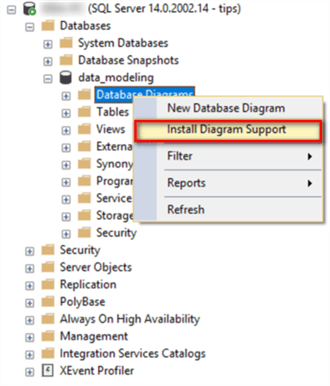
Step 1: Install Diagram Support
Create a new database “data_modeling” through the SSMS and select the menu item “Databases -> data_modeling -> Database Diagrams > Install Diagram Support “. The menu item wouldn’t appear if the diagram support feature were installed.
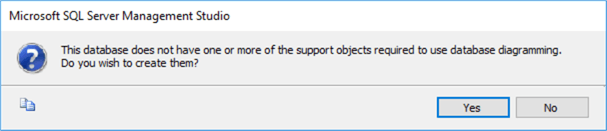
Select the “Yes” in the pop-up window to close the window.
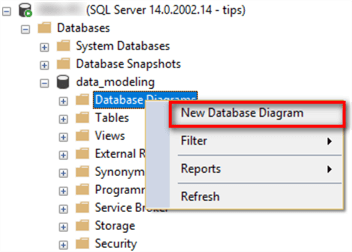
Step 2: Create New Database Diagram
Right-click on the menu item “Database Diagrams” and select the “New Database Diagram” item.
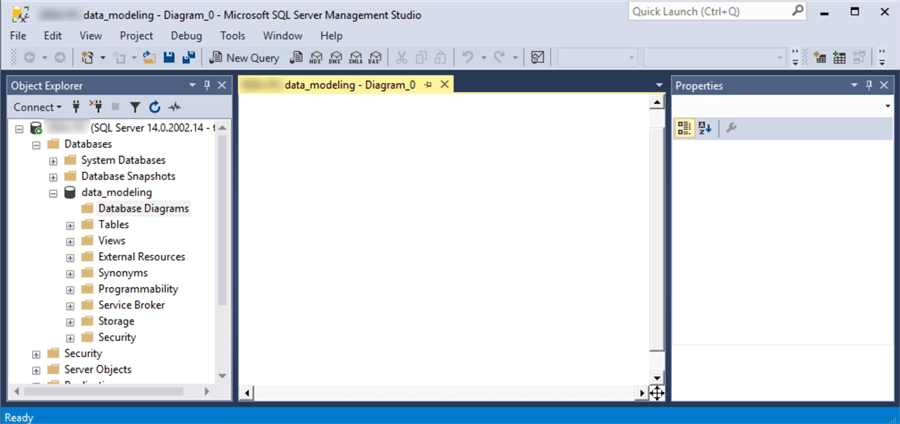
A pop-up window with a title “Add Table” shows up. Click on the “Close” button at the bottom of the new window to close the window. We will use this pop-up window later. If the layout of the SSMS is different from the following screenshot, click on the window’s menu “Window -> Reset Window Layout”.
Step 3: Create User-Defined Data Types
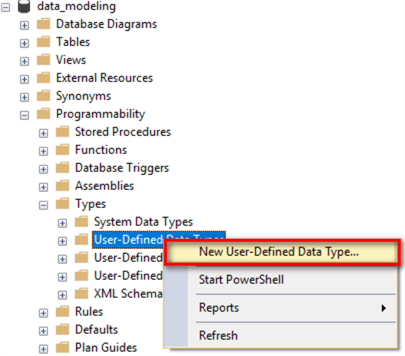
Right-click on the item “Databases -> data_modeling -> Programmability -> Types -> User-Defined Data Types” in the Object Explore panel and select the menu item “New User-Defined Data Type” in the context menu.
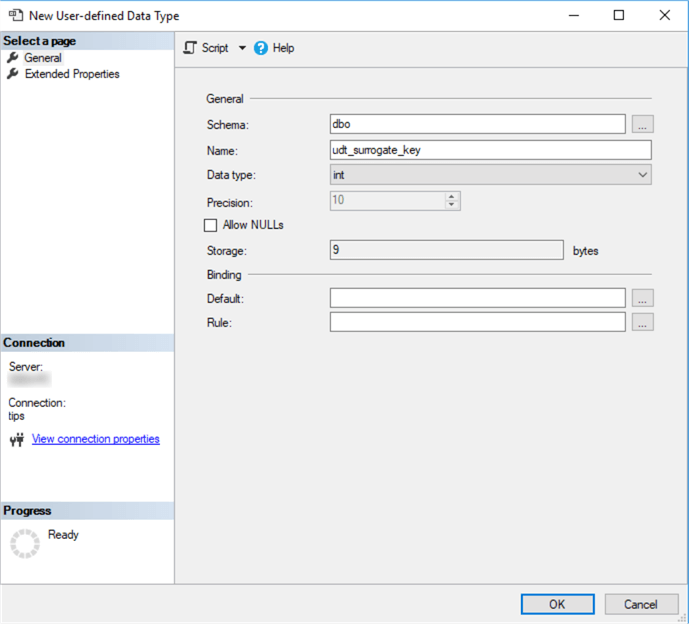
A new window appears. Enter a value “udt_surrogate_key” in the name field and select the data type with “int”. Then, click on the “OK” button to create a new data type. As a matter of fact, it is not important to select proper data type at this step.
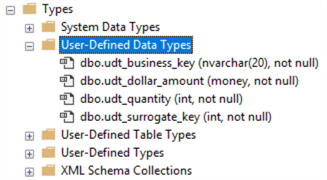
Follow the preceding procedure described in this step, create other user-defined data types.
All changes made to a user-defined data type will be automatically applied to every attribute (or column in the physical data model) that uses the user-defined data type. A conceptual data model does not need to specify a primary key and attributes. To create a connection, a line with arrows, between a fact table and a dimension table in the SSMS diagram panel, we specify a primary key for each dimension entity, and assign foreign keys in the fact entities. User-defined data types are used to describe these keys. The definitions of these user-defined types will be re-visited when creating a physical data model.
Step 4: Create a Dimension Table in SSMS
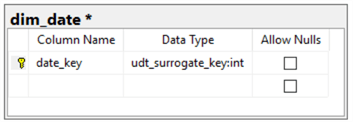
Right-click on an empty space in the middle panel, select the “New Table…” menu item in the context menu. A small pop-up window shows up and enter a value “dim_date” as the table name. Click the “OK” button to close this window and start a new pop-up window. In the new window, enter a value “date_key” as a column name and select the user-defined data type “udt_surrogate_key” as the data type. Then uncheck the “Allow Nulls” checkbox. The symbol “*” beside the table name indicates the table has not been saved since last modification.
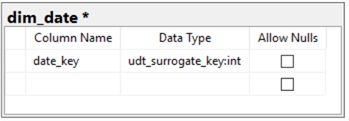
Right-click on trigonal icon beside the text “date_key”, select the “Set Primary Key” menu item in the context menu.
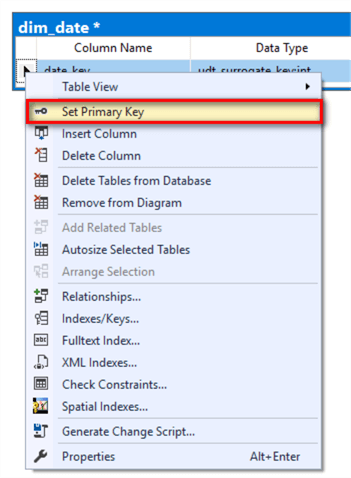
At end of this step, we have created a table “dim_date” with a primary key “date_key”.
Step 5: Save the New Diagram
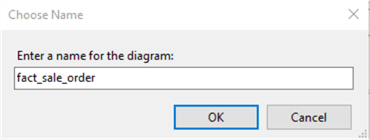
Click on the “Save” button on the window’s toolbar. A pop-up window shows up to ask a name of the diagram. Enter a value “fact_sale_order” as the name for the diagram then click on the “OK” button.
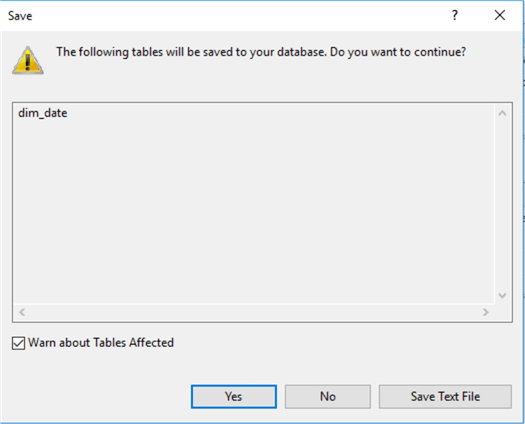
A pop-up warning window appears and click on the “Yes” button to close the window. It is a good habit to save the diagram frequently.
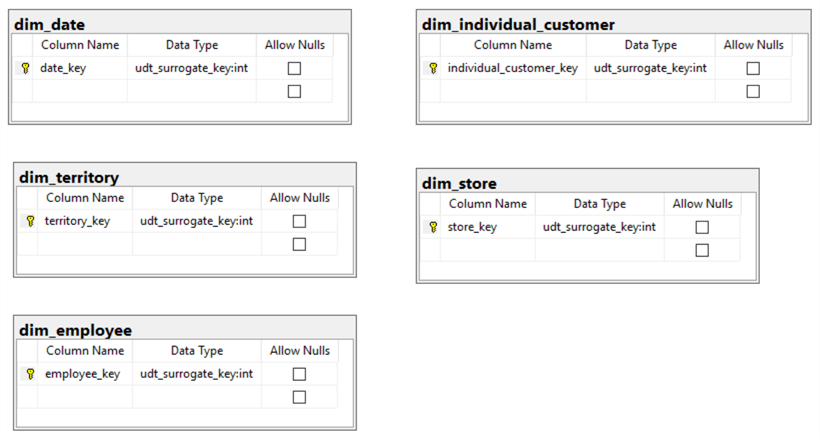
Step 6: Create All Dimension Tables
Repeat Step 5 to create other dimension tables.
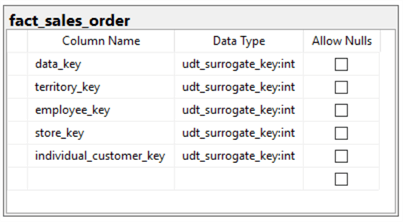
Step 7: Create a Fact Table
Right-click on an empty space in the diagram panel, select the “New Table…” menu item from the context menu, and enter a value “fact_sales_order” as the fact table name in the new pop-up window. Click the window by clicking on the “OK” button. Then the second pop-up window appears. Enter all dimension table keys and select the user-defined data type “udt_surrogate_key” as their data types. Uncheck all “Allow Nulls” checkboxes.
Step 8: Establish Relationship Between Dimension tables and Fact table
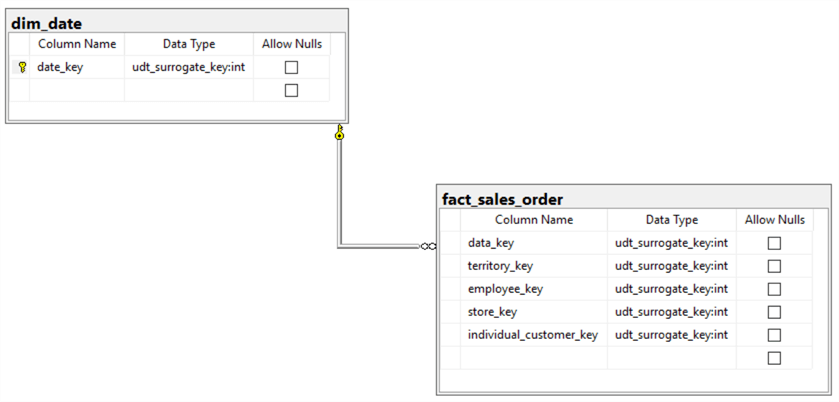
In the diagram panel, drag the key icon in the table “dim_table” over the “date_key” in the table “fact_sales_order”. Two pop-up windows appear immediately. In the first pop-up window presents the relationship name, “FK_fact_sales_order_dim_date”. All the foreign names will use this format. We also can verify if the keys are linked correctly.
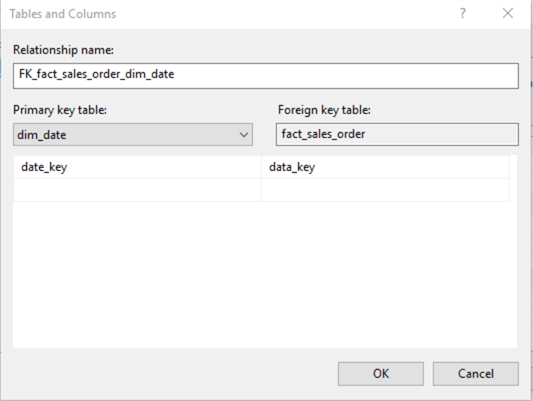
Click the “OK” button to close the first pop-up window. The second window shows more detail information about this relationship, which is not important in this step. Click the “OK” button in the second pop-up window to close the window.
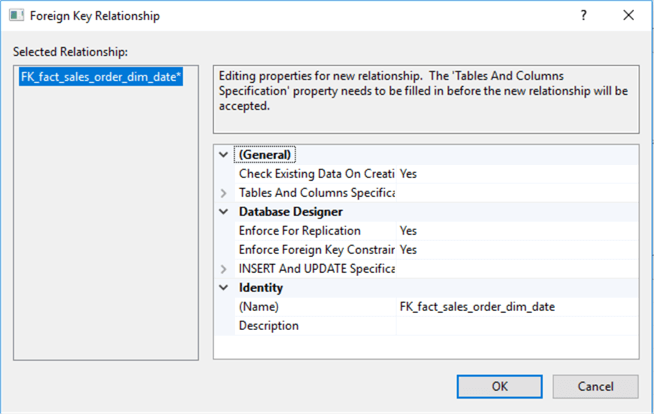
The relationship between the “dim_date” table and “fact_sales_order” table has been established. The following diagram also shows the one-to-many relationship between the dimension a table and a fact table.
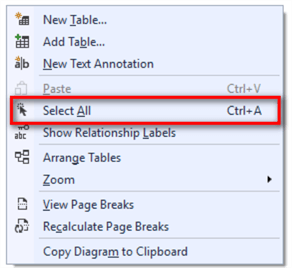
Follow the preceding procedure presented in this step, create relationships between another fact table and all its corresponding dimension tables. Then, right-click on an empty space in the diagram panel and select “Select All” menu item in the context menu.
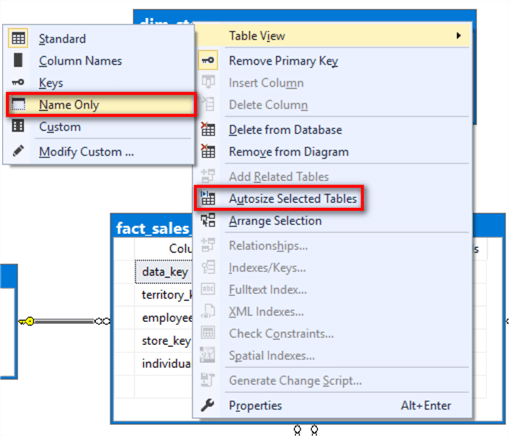
Right-click on one of selected tables; select the “Table View -> Name Only” menu item in the context menu. Select all tables again; right-click on any selected table and select the “Autosize Selected Tables” menu item.
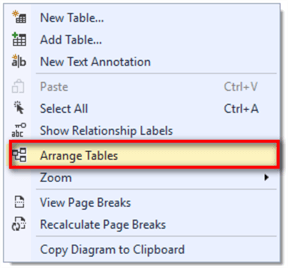
Right-click on an empty space in the diagram panel and select “Arrange Tables” menu item in the pop-up context menu.
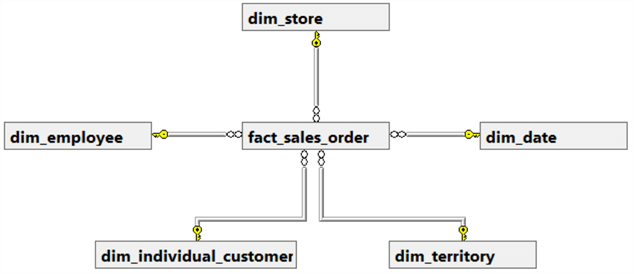
At end of this step, we have obtained a portion of the conceptual data model. Both business users and technical experts can understand this diagram.
Step 9: Create the Other Portion of the Conceptual Data Model
Follow the steps from 2 to 8 in this section, we can obtain another portion of the conceptual data model.
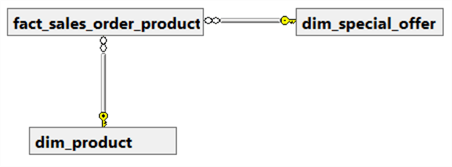
In this section, two data model diagrams have been generated through from step 1 to step 9. By and large, these two diagrams describe the conceptual data model from different aspects. The two diagrams can be used in project planning, technical design documents and management presentations. Furthermore, these two diagrams can guide the logical data model design. No technical terms were used in these diagrams, therefore, all people involved in this project use the same language.
The Logical Data Model
A logical data model specifies all attributes for each entity and identifying relationships among these entities. The logical data model varies from different types of database management systems, such as relational, object-relational, object-oriented, hierarchical, or network. We are going to create a logical data model on a relational database by modifying the conceptual data model. The logical data model is used more frequent in project communication.
I would like to emphasize that all attributes should be defined with user-defined data types. Not only is this required in this exercise, but also this helps to maintain consistency in team development environment. Some user-defined data types have been created in the conceptual data model section. To avoid redundancy, I will skip the procedure to create the user-defined data type in this section.
Step 1: Open Database Diagram
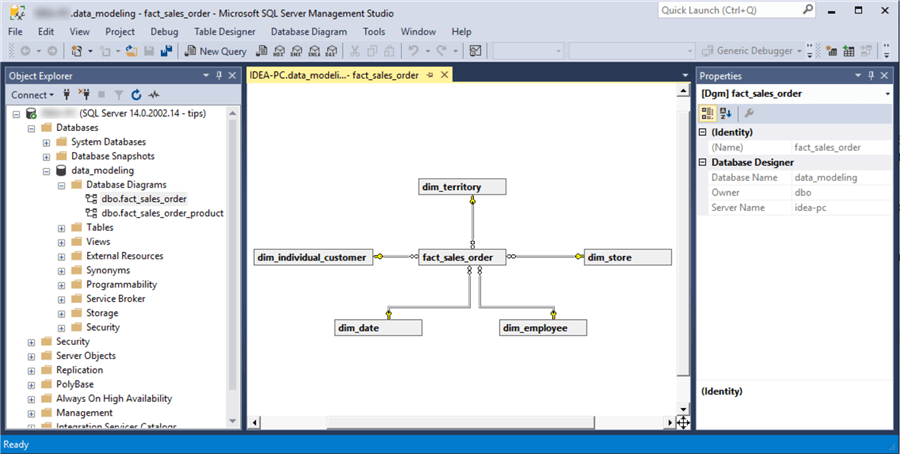
Expend the “data_modeling” database in the Object Explore panel and locate the diagram “fact_sales_order”.
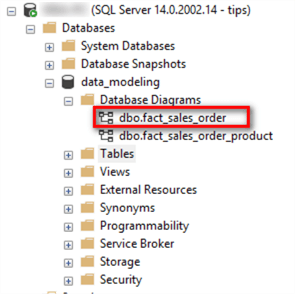
Double-click on the diagram “fact_sales_order” to open the diagram.
Step 2: Specify All Attributes for One Entity
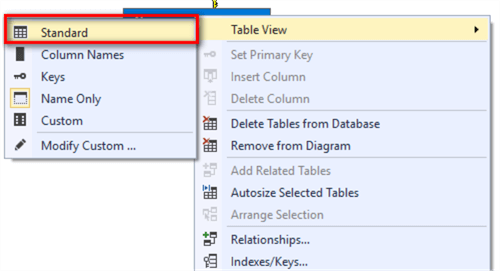
Right-click on the table “dim_employee” in the diagram panel, select “Table View -> Standard” in the pop-up context menu.
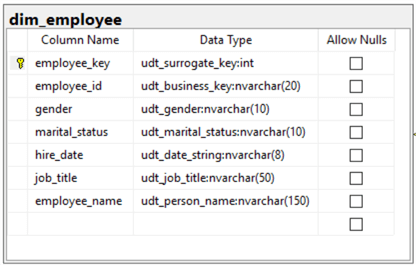
Enter all attributes for the “dim_employee” table.
Step 3: Specify All Attributes for Every Entity
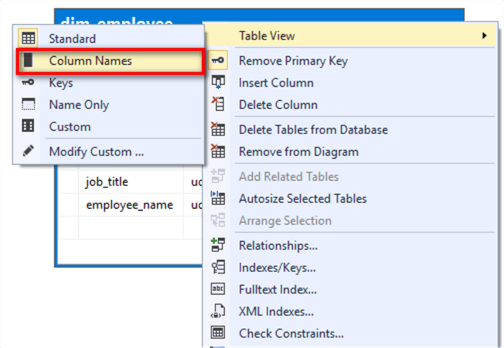
Repeat step 2 until all tables have their attributes. Right-click on an empty space in the diagram panel, and then select “Select All” menu item in the context menu. Right-click on any selected table, select “Table View -> Column Names” in the pop-up context menu.
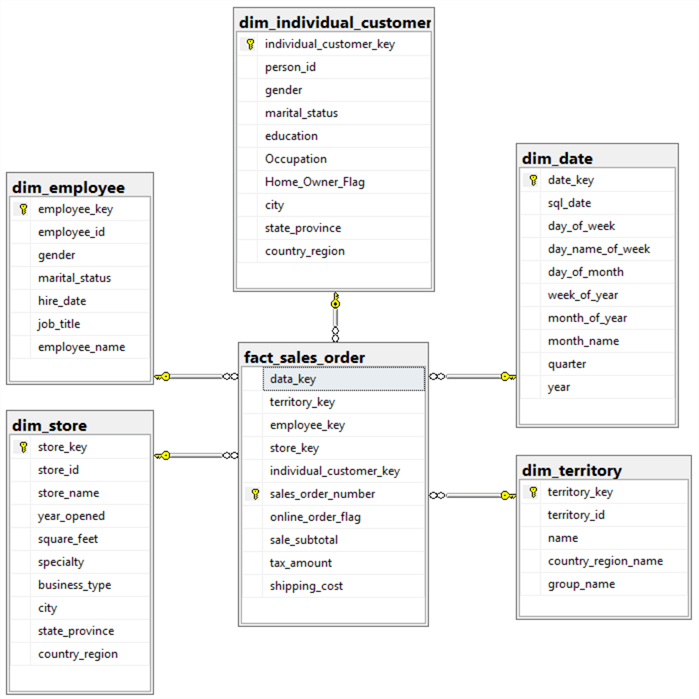
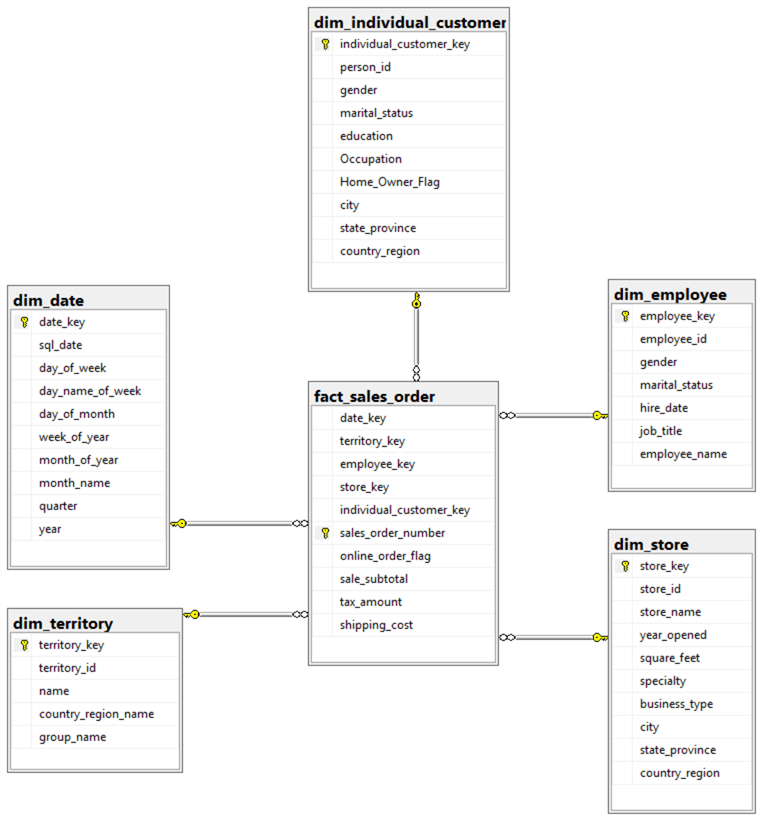
Step 4: Present the Logical Data Model from an Aspect of Sales Order
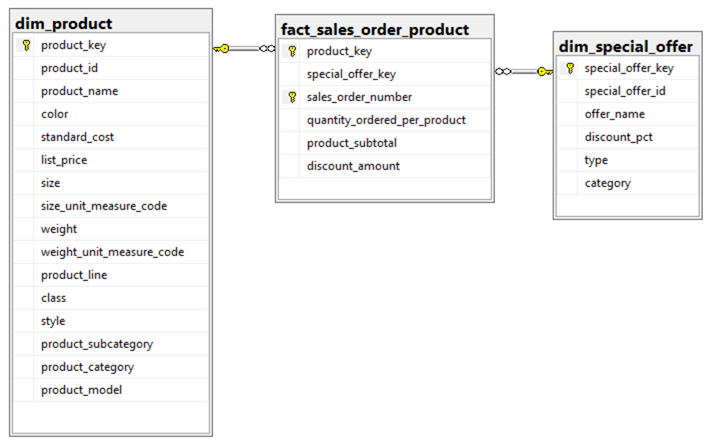
With the option “Column Names” selected in the “Table View” dropdown menu, we have obtained a diagram for logical data model.
Step 5: Produce a Diagram to Show the Logical Data Model from Another Aspect
Follow the instructions from step 1 to step 4; modify the diagram “fact_sales_order_product”. Then, we have obtained another diagram to show the logical data model from the aspect of product in every order.
Unlike other data modeling tools, this approach directly generates logical data model diagrams from the conceptual data model diagrams. We can turn the diagram from one type of model into another type of model by changing selection of “Table View” dropdown menu. This guarantees the consistency between the conceptual data model and the logical data model.
The Physical Data Model
A physical data model is created for a specific database management system, for example, Oracle, IBM DB2, or Microsoft SQL Server. The goal of physical data model is to build an actual, optimized database from the model. Therefore, the physical data model should define all table structures, such as; column lengths, data type, and so on. The physical data model also need to include audit information, for example the batch number that identify the data loading. All modeling tools [8], by and large, can implement the forward engineering process from a logical data model to a physical data model: less design work needs to be performed in this transformation process.
Rather than depict a physical model with diagrams, we consider all relational tables as a physical model [7]. We are going to import the logical model into a database project, which describes the physical data model. The database project not only uses SQL commands to define all database objects but also contains database settings, for example, recovery mode, in the project files.
Step 1: Drop All Foreign Keys
In the logical data model, we specified the foreign keys in the facts tables. But these foreign keys are not required in the physical data model. In order to explain this point precisely, I directly quoted Kimball’s explanation in the 5th chapter of his book [4]:
In practice, data warehouse DBAs often do not create the primary key and foreign key constraints on the fact table. Maintaining these structures is extremely expensive and slows down the data loads. As we describe in Chapter 7, one of the most important jobs of your ETL system is to prevent referential integrity violations — and substituting surrogate keys in the fact table is a nearly foolproof way to do that. Having the database look up foreign keys in every dimension for every incoming fact row is a very expensive check for something that you did just moments before when you looked up the fact table's surrogate keys. Along the same lines, for SQL Server to maintain a multiple-column unique index is obviously expensive. Since SQL Server resolves most queries by using the single-column indexes that you've created on the more selective dimension keys in the fact table, this unique index provides very little value for its cost of maintenance.
Inspired by Aaron Bertrand’ tip, “Drop and Re-Create All Foreign Key Constraints in SQL Server”, I created two stored procedures to drop and re-create all foreign key constraints, respectively.
(a) Drop all foreign keys in the fact tables.
CREATE PROCEDURE [dbo].[sp_fact_foreign_key_drop]
@fact_table_name NVARCHAR(150) = NULL
AS

BEGIN

DECLARE @sql_command NVARCHAR(MAX) = N''

BEGIN TRY

SELECT @sql_command +=N'
ALTER TABLE ' + QUOTENAME(cs.name) + '.' + QUOTENAME(ct.name)
+ ' DROP CONSTRAINT ' + QUOTENAME(fk.name) + ';'
FROM sys.foreign_keys AS fk INNER JOIN sys.tables AS ct
	ON fk.parent_object_id = ct.[object_id]
INNER JOIN sys.schemas AS cs
	ON ct.[schema_id] = cs.[schema_id]
WHERE ct.name = @fact_table_name OR @fact_table_name is NULL ;

EXEC (@sql_command)

END TRY

BEGIN CATCH

DECLARE @ErrorMessage NVARCHAR(4000);

      DECLARE @ErrorSeverity INT;

      DECLARE @ErrorState INT;

      SELECT @ErrorMessage = ERROR_MESSAGE(),
      @ErrorSeverity = ERROR_SEVERITY(),
      @ErrorState = ERROR_STATE();

      RAISERROR (@ErrorMessage, @ErrorSeverity, @ErrorState );

      RETURN 1

END CATCH

RETURN 0

END


-- Re-create all foreign keys in the fact tables.

CREATE PROCEDURE [dbo].[sp_fact_foreign_key_create]

@fact_table_name NVARCHAR(150) = NULL

AS

BEGIN

DECLARE @sql_command NVARCHAR(MAX) = N'';

BEGIN TRY

WITH fact_cte
AS
(
SELECTs.[name] as schemas_name
   ,t.[name] as fact_table_name
   ,c.[name] as column_name
FROM sys.columns c
INNER JOIN sys.tables  t ON c.object_id = t.object_id
INNER JOIN sys.schemas s ON t.schema_id = s.schema_id
WHERE t.[name] LIKE 'fact_%' and c.[name] LIKE '%_key'
),
dim_cte
AS
(
SELECTs.[name] as schemas_name
   ,t.[name] as dim_table_name
   ,c.[name] as column_name
FROM sys.columns c
INNER JOIN sys.tables  t ON c.object_id = t.object_id
INNER JOIN sys.schemas s ON t.schema_id = s.schema_id
WHERE t.[name] LIKE 'dim_%' and c.[name] LIKE '%_key'
)
SELECT @sql_command += N'
ALTER TABLE ' + QUOTENAME(f.schemas_name) + '.' + QUOTENAME(f.fact_table_name)
+ ' ADD CONSTRAINT [FK_' + f.fact_table_name + '_' + d.dim_table_name
+ '] FOREIGN KEY (' +  QUOTENAME(f.column_name) + ') '
+ 'REFERENCES ' + QUOTENAME(d.schemas_name) + '.' + QUOTENAME(d.dim_table_name)
+ '(' + QUOTENAME(d.column_name) +');'
FROM fact_cte f INNER JOIN dim_cte d ON f.column_name = d.column_name
WHERE f.fact_table_name = @fact_table_name OR @fact_table_name is NULL;
EXEC (@sql_command)

END TRY

BEGIN CATCH

 DECLARE @ErrorMessage NVARCHAR(4000);
 DECLARE @ErrorSeverity INT;
 DECLARE @ErrorState INT;
 SELECT @ErrorMessage = ERROR_MESSAGE(),
  @ErrorSeverity = ERROR_SEVERITY(),
  @ErrorState = ERROR_STATE();

 RAISERROR (@ErrorMessage, @ErrorSeverity, @ErrorState );

 RETURN 1

END CATCH

RETURN 0

END
Execute the stored procedure “[dbo].[sp_fact_foreign_key_drop]” to drop all foreign keys from facts tables. A side effect is that the relationships in the diagrams are also removed. To re-create these relationships, we can run the stored procedure “[dbo].[sp_fact_foreign_key_create]”. One limitation of these two stored procedures is that they rely on the naming conventions.
Step 2: Import into a Database Project
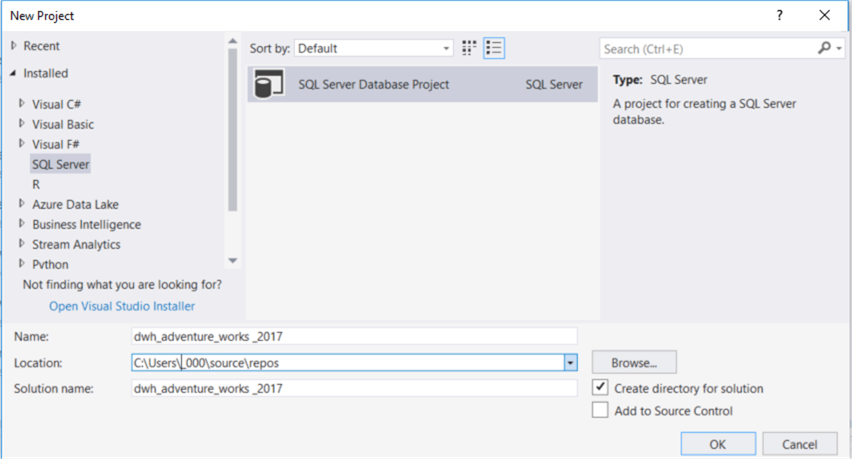
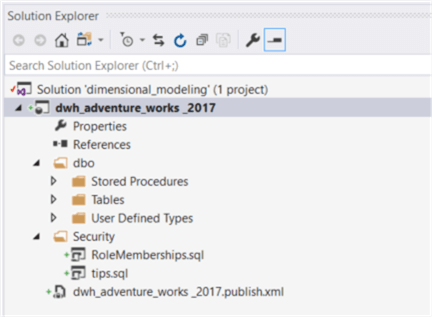
First, create a database project, dwh_adventure_works _2017, through Microsoft Visual Studio.
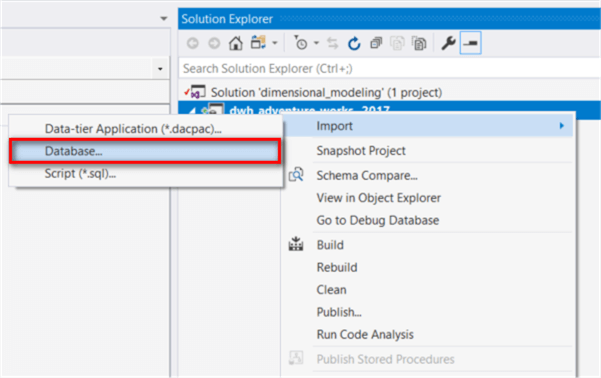
Then, right-click on the project name in the Solution Explorer panel and select “Import -> Database…” menu item from the context menu.
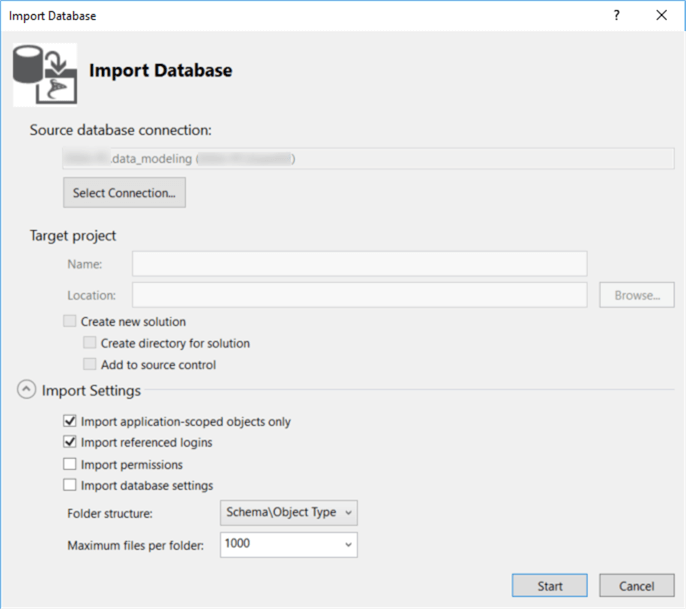
In the pop-up window, click the “Select Connection” button, point the database connection to the “data_modeling” database and use default setting for the other fields. Then click on the “Start” button.
At end of this step, we have created a database project. Some changes may be needed to build and publish the project successfully. A typical issue is the permission issue.
Step 3: Review Table Structures
Review all the object definitions table by table and column by column. During the reviewing process, it is a good opportunity to create a data mapping between the source data column and the target data column. The data mapping will be used by the ETL developers.
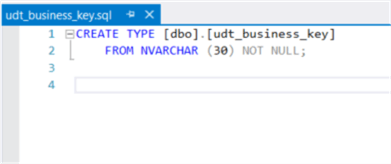
During the logical data model design, we did not pay much attention on the attribute definitions. We must correctly define all these attributes on basis of business requirements and data profiling reports. For example, the data profile results indicate that business key should be 30 characters long. Another example is that we need to apply slowly changing dimension (SCD) technique, such as type 2 dimension, if the business wants to track changes on a certainly column. In this case, we should add some audit columns. We can make these changes in the database project code panel.
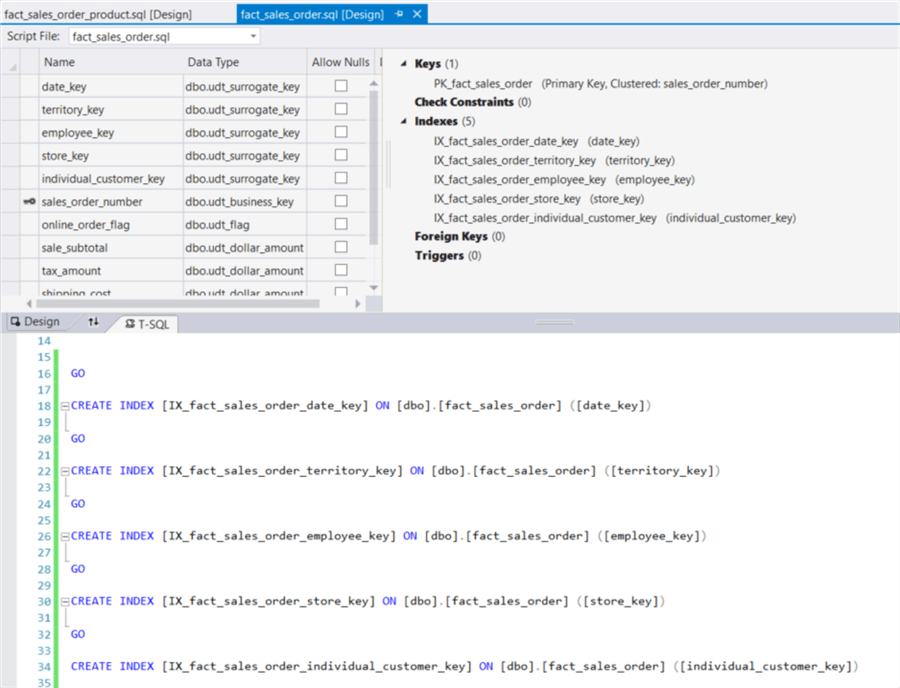
Step 4: Create Indexes on Fact Tables
We can improve the query performance of a data warehouse by an index solution. However, designing an indexing solution for a data warehouse is a complex topic. In this exercise, we will create Nonclustered Rowstore indexes for all foreign key columns in every fact tables. Then DBA should keep eyes open on the database performance and tune the indexing solution to maximize the benefit from indexing. They may remove some indexes or add new indexes.
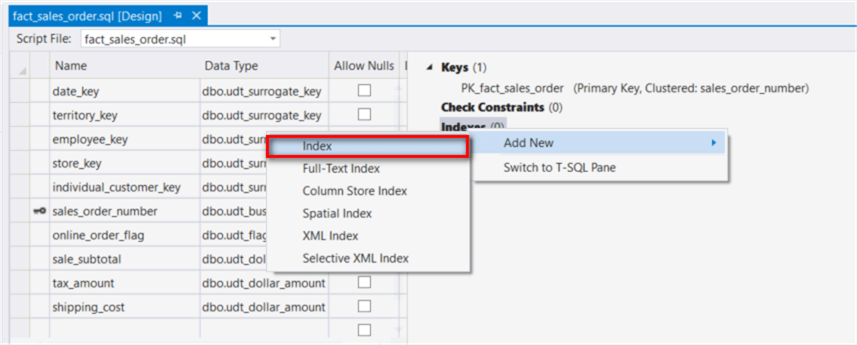
Open the fact table “fact_sales_order” from the database project. In the design panel, right-click on the text “Index”; select menu item “Add New -> Index” from the context menu.
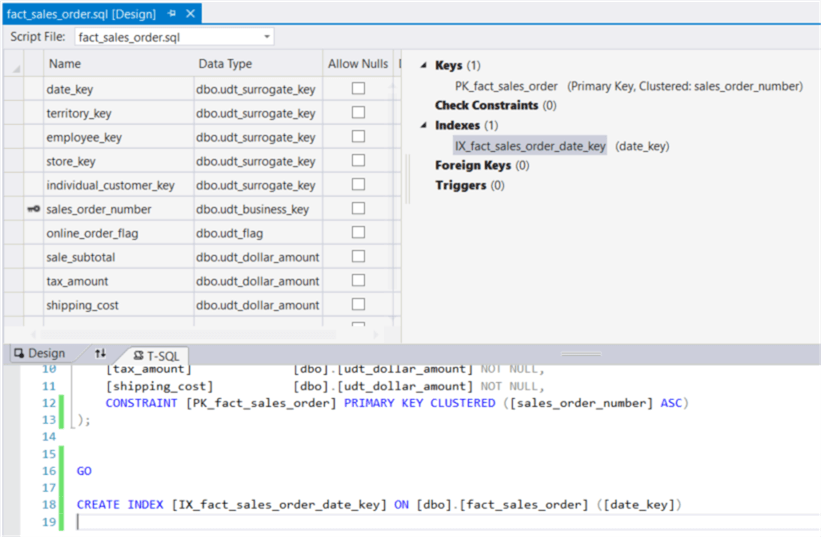
Both the index name and the automatically generated codes contain a placeholder with text “Column”. Change the text “Column” to foreign key name “date_key”. We keep the format of the index name and use this format as an index naming convention.
Apply the same procedure to create indexes for all foreign key columns in all fact tables. Review these auto-generated SQL commands and make sure all these placeholders have been substituted with proper column names.
While adding indexes to the tables can boost the query performance, indexes may have a negative impact on loading of large data sets in the ETL process. One method is to disable these indexes before the loading process and rebuilding these indexes afterwards. Two stored procedures were created to apply this method.
(a) Disable all non-clustered indexes on a table.
CREATE PROCEDURE [dbo].[sp_non_clustered_index_disable]
	@fact_table_name NVARCHAR(150)
AS
BEGIN
	DECLARE @sql_command NVARCHAR(MAX) = N''
	BEGIN TRY
		SELECT @sql_command += N'
			ALTER INDEX ' + QUOTENAME(ix.[name]) + ' ON '
			+ OBJECT_NAME(ID) + ' DISABLE; '
		FROM  sysindexes ix
		WHERE ix.indid > 1 --Nonclustered index(>1)
              AND QUOTENAME(ix.[Name]) like '%IX_fact_%'
              AND OBJECT_NAME(ID) = @fact_table_name
		EXEC (@sql_command)
    END TRY
	BEGIN CATCH
        DECLARE @ErrorMessage NVARCHAR(4000);
        DECLARE @ErrorSeverity INT;
        DECLARE @ErrorState INT;
        SELECT @ErrorMessage = ERROR_MESSAGE(),
                @ErrorSeverity = ERROR_SEVERITY(),
                @ErrorState = ERROR_STATE();
        RAISERROR (@ErrorMessage, @ErrorSeverity, @ErrorState );
        RETURN 1
    END CATCH
    RETURN 0
END
(b) Rebuild all non-clustered indexes on a table
CREATE PROCEDURE [dbo].[sp_non_clustered_index_rebuild]
	@fact_table_name NVARCHAR(150)
AS
BEGIN
	DECLARE @sql_command NVARCHAR(MAX) = N''
	BEGIN TRY
		SELECT @sql_command += N'
			ALTER INDEX ' + QUOTENAME(ix.[name]) + ' ON '
			+ OBJECT_NAME(ID) + ' REBUILD; '
		FROM  sysindexes ix
		WHERE ix.indid > 1 --Nonclustered index(>1)
              AND QUOTENAME(ix.[Name]) like '%IX_fact_%'
              AND OBJECT_NAME(ID) = @fact_table_name
		EXEC (@sql_command)
    END TRY
	BEGIN CATCH
        DECLARE @ErrorMessage NVARCHAR(4000);
        DECLARE @ErrorSeverity INT;
        DECLARE @ErrorState INT;
        SELECT @ErrorMessage = ERROR_MESSAGE(),
                @ErrorSeverity = ERROR_SEVERITY(),
                @ErrorState = ERROR_STATE();
        RAISERROR (@ErrorMessage, @ErrorSeverity, @ErrorState );
        RETURN 1
    END CATCH
    RETURN 0
END
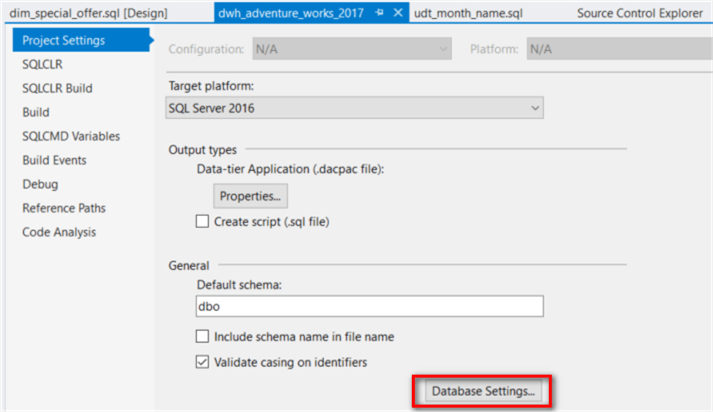
Step 5: Configure Database Setting
Assuming the database should use simple recovery model, we can configure this setting through the database project. Right-click on the project name and select the “Properties” item in the context menu.
Click on the “Database Settings” button and switch to the “Operational” tab in the pop-up window. Then select the option “SIMPLE” in the recovery dropdown box.
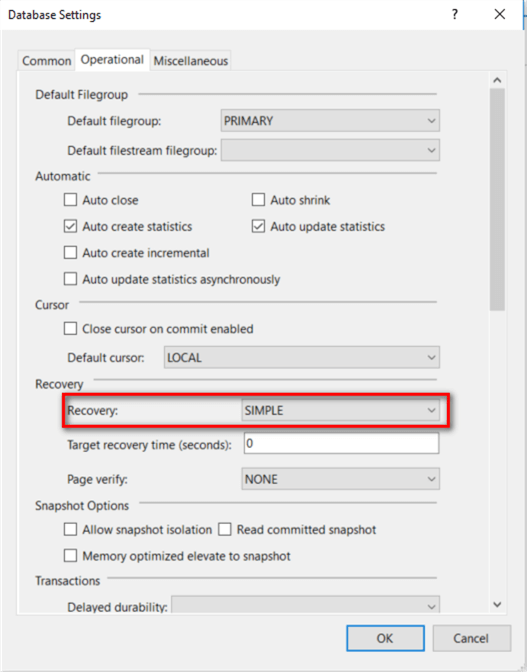
Click the “OK” button in the pop-up window to complete the configuration.
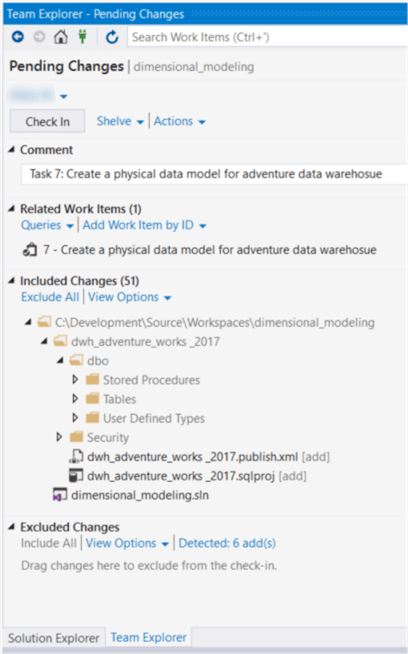
Step 6: Check-in the Database Project into TFVC
In the “Team Explore” panel, switch to the “Pending Changes”; select the associated work item and write a comment for this check-in; then click on the “Check In” button.
Create a Physical Database
One goal of creating a physical data model is to prepare for a deployment package for the DBA role to create a physical database. All data modeling tools in [8] can generate DDL scripts for a target database management system. The Database Publishing Wizard in Visual Studio allows us to deploy a database project to a SQL Server. This tool, like other data modeling tools, can generate a single DDL script file. However, we will use a different approach to deploy the database project.
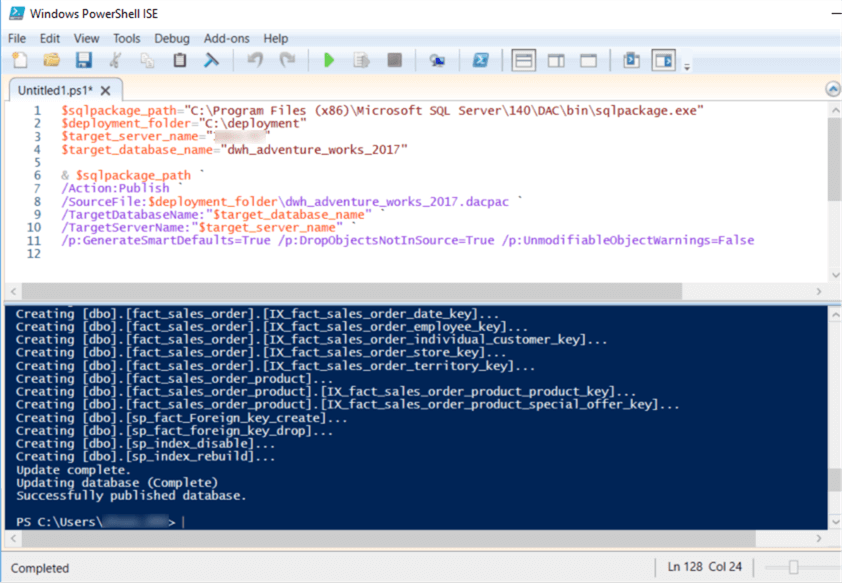
Thinking of automatic deployment, we are going to deploy “dacpac” file, which was generated through the database project, through the command “sqlpackage”. To deploy the database project automatically, use PowerShell to install the “dacpac” file. Here are the PowerShell scripts:
$sqlpackage_path="C:\Program Files (x86)\Microsoft SQL Server\140\DAC\bin\sqlpackage.exe"

$deployment_folder="C:\deployment"

$target_server_name="[your server name]"

$target_database_name="dwh_adventure_works_2017"

$sqlpackage_path /Action:Publish /SourceFile:$deployment_folder\dwh_adventure_works_2017.dacpac /TargetDatabaseName:"$target_database_name" /TargetServerName:"$target_server_name" /p:GenerateSmartDefaults=True /p:DropObjectsNotInSource=True /p:UnmodifiableObjectWarnings=False
The following screenshot illustrates a successful database deployment with confirmation messages:
Maintain the Data Models
Many companies face a typical challenge, constant change. The constant change includes changes in government regulations, customer demands, technologies, business management, etc. Therefore, the information processing changes accordingly. This section discusses how to maintain data models and databases consistency, and how to keep them up-to-date.
Forward Engineering and Reverse Engineering
All those data modeling tools in the table “Features” [8] support forward engineering process and reverse engineering process. Regrettably, the SSMS is not in that list, which implies we cannot perform a conversion between the logical data model and the physical data mode through the SSMS. Due to the characteristics of star schema data model, which only contains fact tables and dimension tables, the data structure is same in all three types of data model. This allow us to only keep a copy of physical data model in TFVC, and we can generate diagrams for the conceptual model and the logical data model from the physical data model. When the physical data model is ready, the forward engineering process and reverse engineering process in the SSMS is just to switch the selection of “Table View” options in the context menu of the diagram panel.
Let’s follow a step-by-step approach to generate a diagram of logical data model from the TFVC.
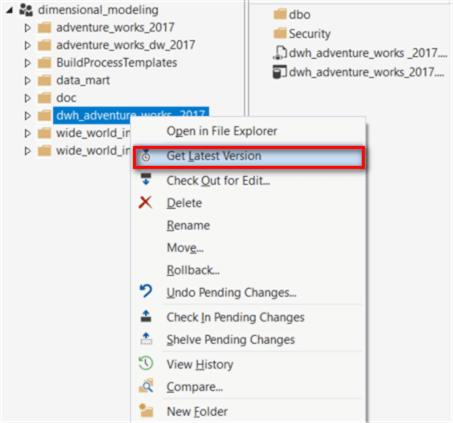
Step 1: Retrieve the Latest Version From TFVC
Right-click on the project folder name in the “Source Control Explore” panel, and select the “Get Last Version” menu item. This brings a copy of the latest version to the local workstation. Then double-click on the project name to open the project.
Step 2: Publish the Database Project to the Development Environment
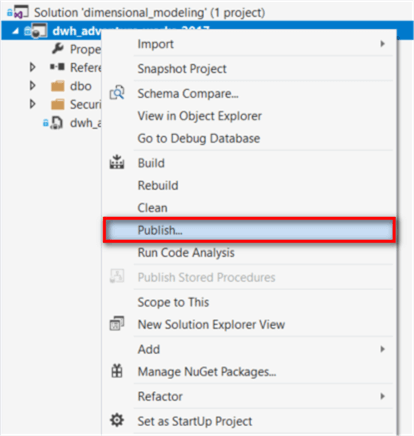
Right-click on the project name in the “Source Explore” panel and select “Publish” menu item from the context menu.
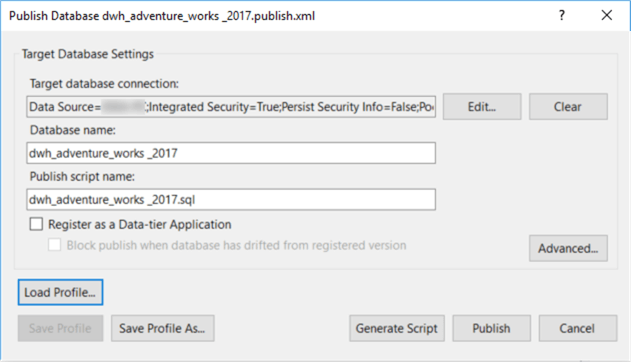
In a pop-up window, configure the target database setting, then click on the “Publish” button.
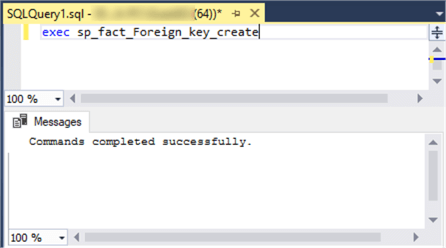
Step 3: Generate all Foreign Keys
Connect the database through the SSMS. Run the stored procedure to generate all foreign keys.
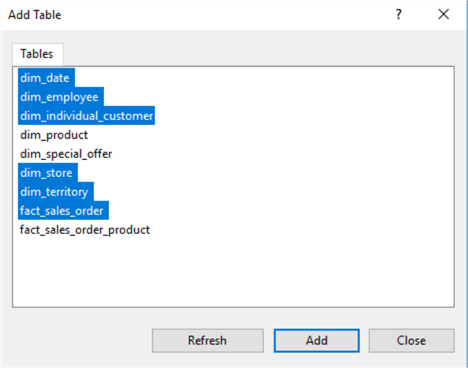
Step 4: Produce a Diagram
If we created a new database, we first should Install diagram support. Then, right-click on the “Database Diagram”, and select “New Database Diagram” menu item. In the pop-up window, select all tables that the diagram needs. Then click on the “Add” button. Since the foreign key names in the fact table are corresponding to the dimension table names, this an effortless task to pick up all relevant dimension tables for a fact table.
Follow the instructions given in the “the Logical Data Model” section, we have obtained a diagram to represent one aspect of the logical data model.
Since the database, conceptual data model diagrams, logical data model diagrams and the physical data model (i.e. the database project) come from the same code base in one repository, they all reflect the most recent updates. If these data models are stored in different files, likely they will be out-of-sync.
Data Model Consistency
Due to the constant change, a data model is evolving. There are three types of typical changes: emergency fix on the database in a production environment, bug fix and enhancement. SSMS, SSDT and TFVC work together to guarantee data model consistency. Firstly, I don’t recommend any changes are deployed to a production environment without passing QA testing. Today, continuous delivery and continuous integration shorten the deployment cycle and ensure that the code base is always in a deployable state.
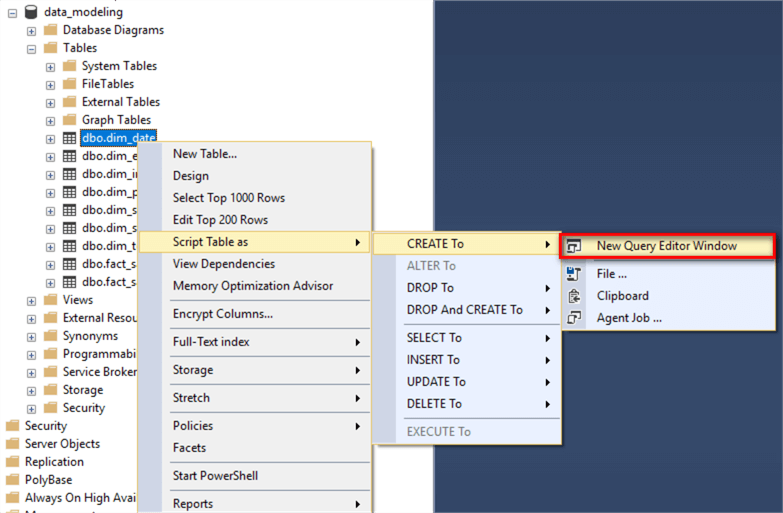
Regarding a bug fix, we can make changes on the database project directly, then commit changes into the TFVC. When working on enhancement, specially adding new fact tables, it is preferable to create a diagram in the SSMS, and then the copy object definitions into the database project. The following diagram illustrates a way to generate SQL scripts from a table in the SSMS.
When we need to verify if the database and the physical data model (i.e. the database project) are in-sync, we can compare the database schema between these two. Here is the step-by-step process to compare schema between the database project and the target database:
Step 1:
Open the database project and right-click on the project name in the “Solution Explore” panel.
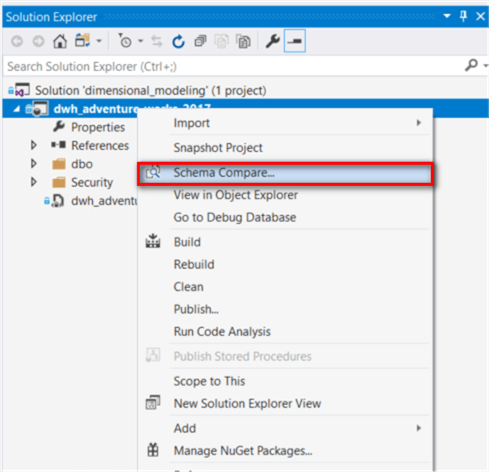
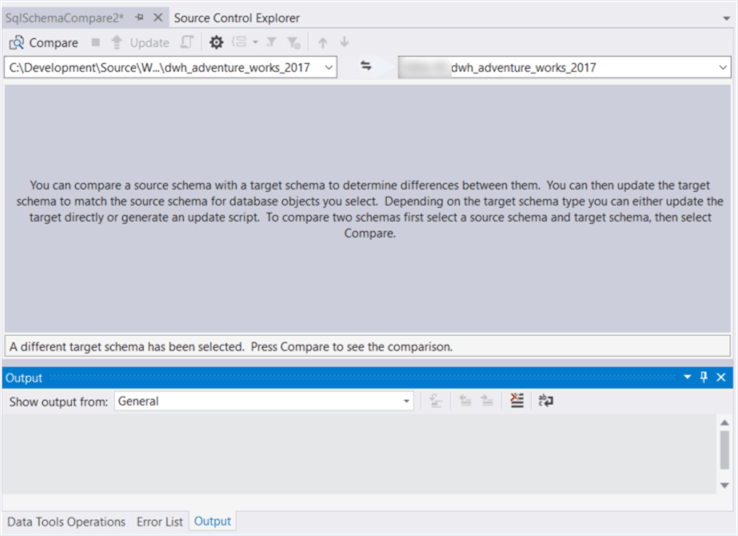
Step 2:
Select “Schema Compare…” item in the context menu, and then select the target database on the right dropdown list. Click on the “Compare” button.
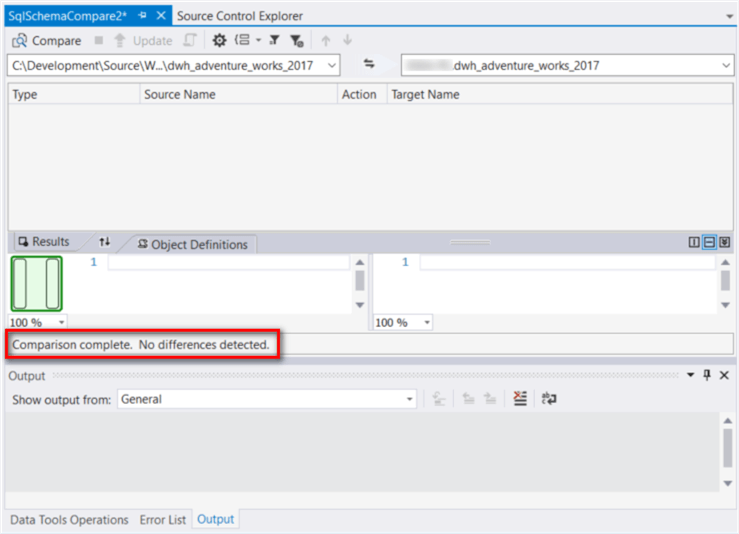
In the end, we have obtained the comparison results shown in the following screenshot. The confirmation message indicates that the comparison has completed, and no difference has been detected. If any difference were identified, we should verify which one doesn’t have the latest version, then we should make changes accordingly.
Summary
In this exercise, we have walked through a novel approach that uses Microsoft toolset to create a star schema data model. This approach does not intend to compete with any data modeling tools, but it serves as an alternative solution for some developers. I used the database project to describe a physical data model from which we could produce the conceptual data model diagrams and the logical data model diagrams. The physical data model is stored in TFVC that provides a single version of the truth about the data model.
This approach is for software developers who are familiar with Microsoft software development environment and who accept a new task to build a data warehouse on Microsoft business intelligence stack. The other readers may find this tip useful as an explanation of how to use the SSMS and the SSDT and what a data model is all about.
References
[1] Architecture Principles. Retrieved from http://pubs.opengroup.org/architecture/togaf8-doc/arch/chap29.html
[2] Kimball R., & Ross M. (2013). The Data Warehouse Toolkit: The Definitive Guide to Dimensional Modeling (3th Edition). Indianapolis, IN: Willey.
[3] Ross M., Thornthwaite W., Becker B., Mundy J. & Kimball R. (2008). The Data Warehouse Lifecycle Toolkit (2th Edition). Indianapolis, IN: Willey.
[4] Kimball R., Thornthwaite W., & Mundy J. (2011). The Microsoft® Data Warehouse Toolkit: With SQL Server 2008 R2 and the Microsoft® Business Intelligence Toolset (2rd Edition). Indianapolis, IN: Willey.
[5] Visual Studio Team Services. Retrieved from https://visualstudio.microsoft.com/team-services
[6] AdventureWorks sample databases. Retrieved from https://github.com/Microsoft/sql-server-samples/releases[7] Oppel A. J. (2009). Data Modeling A Beginner’s Guide. New York, NY: McGraw-Hill.
[8] Comparison of data modeling tools. Retrieved from https://en.wikipedia.org/wiki/Comparison_of_data_modeling_tools
[9] Data Modeling - Conceptual, Logical, And Physical Data Models. Retrieved from https://www.1keydata.com/datawarehousing/data-modeling-levels.html
Next Steps
- The webpage [9] clearly illustrates the difference among the three types of data modeling, conceptual data model, logical data model, and physical data model. For more explanations about the data model, I recommend Oppel’s book [7].
- Check out these related tips:
- Publish the database using SSDT
- Define a publish profile for SSDT
- Using Advanced Publish Settings for Visual Studio Database Project
- Explore the Role of Normal Forms in Dimensional Modeling
- Use consistent SQL Server Naming Conventions
- SQL Server Data Type Consistency
- SQL Server 2016 Management Studio Enhancements
- Getting Started with SQL Server Database Diagrams


About the author
 Nai Biao Zhou is a Senior Software Developer with 20+ years of experience in software development, specializing in Data Warehousing, Business Intelligence, Data Mining and solution architecture design.
This author pledges the content of this article is based on professional experience and not AI generated.
View all my tips
