By: Ray Barley
OverviewThe Toolbox contains a number of Report Items that you drag and drop onto the design surface when creating a report. The Table provides the traditional report layout where you render data in a fixed number of columns and a variable number of rows. In this section we will use the Table to define the same report layout that we used earlier in the Report Wizard section.
Explanation
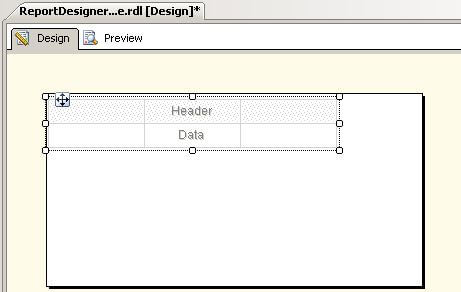
To add a Table to the design surface, simply click Table in the Toolbox then drag and drop it onto the design surface. The design surface should look like this:
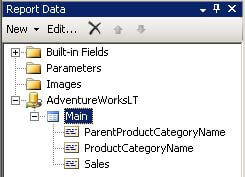
Recall from our previous step where we created a Dataset; the Report Data is shown below:
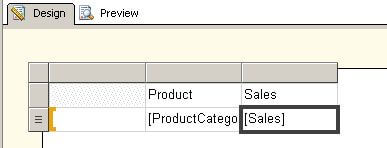
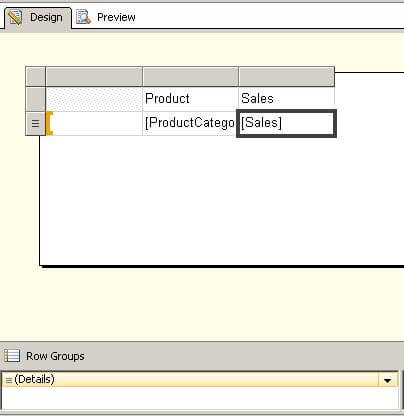
Drag and drop the ProductCategoryName and Sales fields (one at a time) onto a column of the Data row of our Table as shown below:
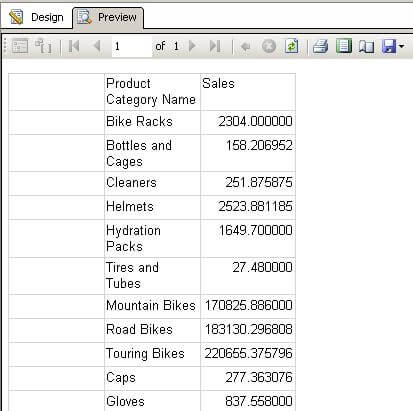
Click the Preview tab to render the report; a portion of the rendered report is shown below:
Click on the Design tab and focus on the Row Groups at the bottom as shown below:
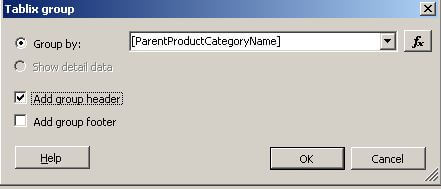
We want our report to show the ParentProductCategory broken down by the ProductCategory. Click the arrow on the (Details) line shown above then click Add Group, Parent Group; fill in the Tablix group dialog as shown below:
The Table now looks like this:
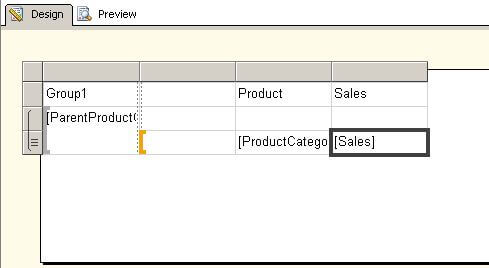
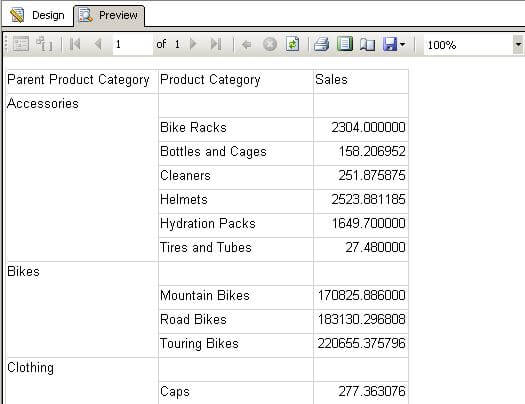
Right click on the gray border above the empty column and select Delete Columns from the menu. Click on the Group1 cell and change the text to Parent Product Category. Click and drag the gray border above the column headings to make them a little wider. Click the Preview tab to render the report:
At this point we are almost done; we need to add Parent Product Category totals, drilldown capability to show/hide the Product Category details, a grand total, and some general cosmetic cleanup. Click on the Designer tab to continue.
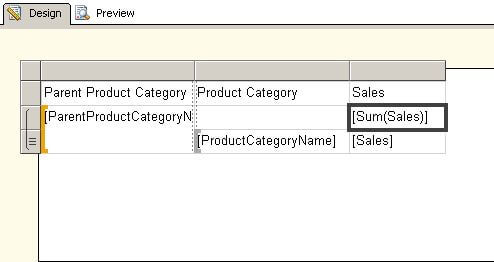
To add the Parent Product Category totals, hover the mouse over the empty cell in the Sales column on the ParentProductCategoryName row; a little icon will appear; click the icon and select Sales from the popup menu. You will see the expression [Sum(Sales)] as shown below:
To add the drilldown capability, right click on the gray border on the bottom row in the designer and select Row Visibility from the popup menu. Fill in the Row Visibility dialog as shown below:
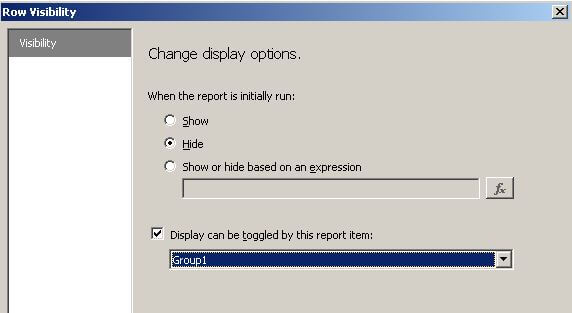
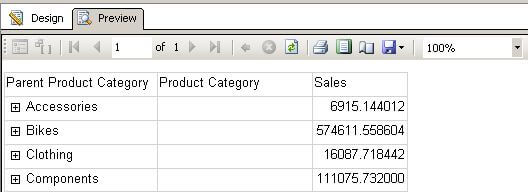
The above settings will initially hide the Product Category details and add the plus sign icon next to the Parent Product Category to toggle the drilldown. The name Group1 was assigned when we added the Parent Product category group. Click the Preview tab to render the report:
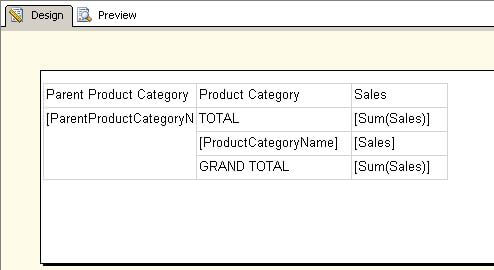
Click the Design tab then click the arrow on the Details line inside the Row Groups area; select Add Total, After from the popup menu. You will now see a row after the detail row; edit the blank cells on the total lines to specify a description as shown below:
Finally for the cosmetic changes, drag and drop a text box above the table and provide a heading for the report. Click in the Sales cells and specify C0 (i.e. Currency with no decimals) as the Format property in the Properties window (click View the Properties on the top-level menu if you don't see the Properties window). Click Preview to see the completed report:
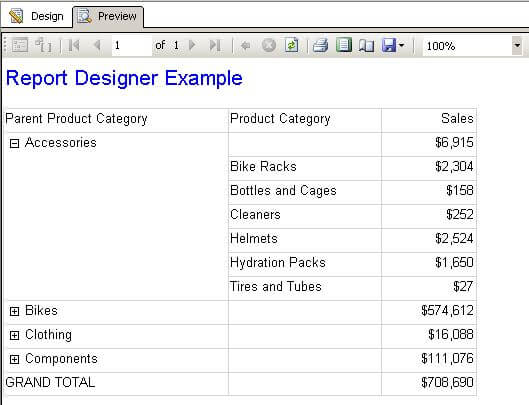
This completes the section on creating a report from scratch. We are now ready to continue on to the next section to discuss the options for deploying reports.
