Overview
The first step in creating a report is to add a new report to our project.
Explanation
In the earlier section on Projects and Solutions, we created a blank solution and added a Report Server project to the solution. In the previous section, we added a new report by stepping through the Report Wizard. The BIDS Solution Explorer shows our Reports project along with the Shared Data Source and ReportWizardExample that we created in the previous section:

Right click on the Reports node then select Add, New Item which will display the Add New Item – Reports dialog; fill in the dialog as shown below:

Click the Add button to add a new report to your project. Your new report will be displayed in the Report Designer. Let’s spend a minute to review the Report Designer before we continue with our task of creating a new report from scratch.
There are three parts of the Report Designer that you will be using:
- Design Surface – palette where you lay out your report
- Report Data – allows you to define Data Sources, Datasets, Parameters, and Images; allows you to access a group of built-in fields like Report Name, Page Number, etc. You will drag and drop items from this area onto the design surface.
- Toolbox – contains the Report Items that you drag and drop onto the design surface; e.g., Table, Matrix, Rectangle, List, etc.
Whenever you add a report to your project or open a report, the design surface will be displayed. After adding a report, you will see the following blank design surface:

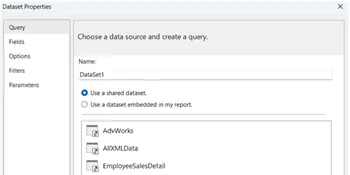
You can display the Report Data and Toolbox areas by selecting them from the top-level View menu if they aren’t shown. The Report Data and Toolbox are used a lot, so I like to position them to the left of the designer. The Report Data area is shown below:

In the screenshot above, Report Data and the Toolbox share the same area of the screen; click on the tab at the bottom to switch between them. The Toolbox contains the following elements that you will drag and drop onto the design surface:

Note in the heading of Report Data and the Toolbox, there is a push pin icon. Clicking this toggles between showing the tab and hiding it by putting a button that you can hover over to display the tab.
You can customize what you see in the report designer, as well as position it however you like. Click on the Report Data or Toolbox heading, and you can drag it around and position it.
At this point, let’s continue on to the next section and create a Shared Data Source.

Ray is a Principal Architect at IT Resource Partners focused on SQL Server and Business Intelligence. He is a Microsoft Certified Solutions Expert (MCSE) in Business Intelligence, a MSSQLTips.com BI Expert and Ambassador. He is also a co-author of the book: SharePoint 2010 Business Intelligence Unleashed.
- MSSQLTips Awards: Champion (100+ tips)