Problem
As a database administrator (DBA) I want a tool to effectively monitor and manage all my database servers regardless of platform. I heard of dbWatch and want to know more about it. What are the main features in the interface?
Solution
In this article I will step through the main modules in dbWatch and provide a description of each to give you a sense of how dbWatch can save you significant time monitoring and managing your database environment.
Keep in mind dbWatch is a database management, monitoring and performance tuning tool where you can directly perform database administration tasks across all database platforms like running backups, killing spids, troubleshooting a piece of code and more. The goal of dbWatch is to be the only tool for DBAs to do their job on a daily basis.
What is dbWatch?
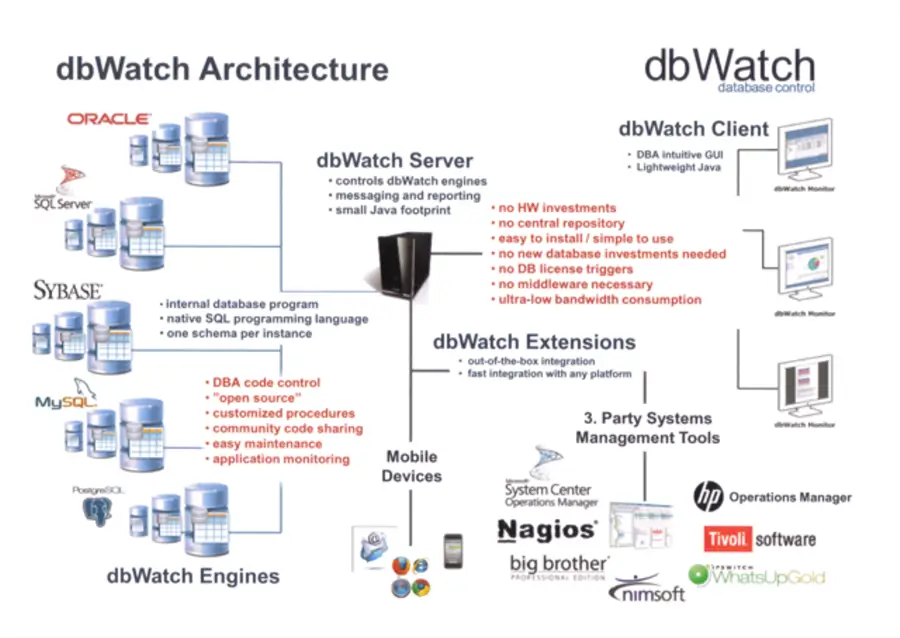
dbWatch is a multi-platform database server management, monitoring and performance tuning tool. The tool can be used to manage and monitor the following database platforms:
- Microsoft SQL Server
- Oracle
- PostgreSQL
- MySQL
- MariaDB
- Sybase ASE
- MongoDB
dbWatch supports the following Cloud platforms:
- Microsoft Azure
- Amazon RDS
- Amazon EC2
Learn more about the dbWatch supported platforms: Platforms Supported.
Monitoring Module
First in the dbWatch interface is the Monitoring module which is the default interface when opening dbWatch. For database administrators this interface provides a quick glance of the health of your database server environment and the ability to drill into issues. This is important especially when managing a large set of servers by quickly reviewing the status of your environment and allowing you to quickly respond and correct issues.
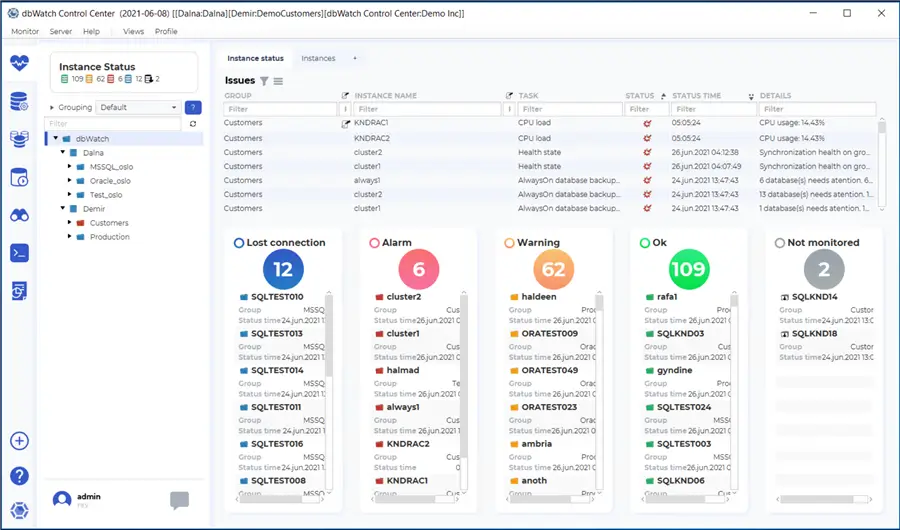
The Monitoring module is accessed via the heart shape icon on the top left navigation bar. The dashboard has 2 panes. The left pane shows “Instance Status” and expandable list of monitored Servers. The “Instance Status” box shows a quick view of the color-coded status of the database servers with the associated count. The Server list box is an expandable tree to see the individual servers in each group.
The right pane has 2 tabs. The first tab, “Instance Status” is a dashboard listing of issues that include: Lost connection, Alarms, Warning, Ok, and Not Monitored. Under each are the servers in that status. The second tab, “Instances”, shows a list of all servers ordered by the different statuses. From this list you can double click on the Server to drill into the details collected for that Server and you can quickly get to the underlying issues.
Management Module
Second is one of the most important interfaces in dbWatch. The Management Module is where you spend most of your time. Think of the Management Module as the interface to find and fix database problems. Whether the issue is related to troubleshooting, correcting problematic code, investigating an error, restoring a database, improving performance, etc.
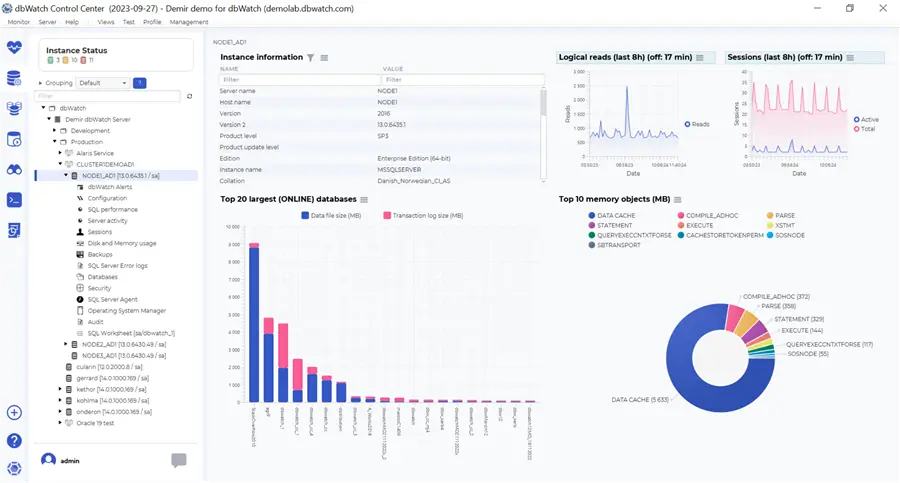
Starting off, the Management module provides a complete server level view. When clicking on a server in the left pane, the dashboard will display the details about:
- The Instance
- Top 20 largest databases
- Logical Reads
- Sessions charts
- Top 10 Memory Objects
By expanding the Server in the left pane, a list of platform dependent server details is provided by category from which you can see all server details. These details include:
- Alerts
- Configuration
- SQL Performance
- Session Events
- Session Activity
- Server Activity
- Disk
- Memory
- Backup
- Error Logs
- Operating system
Each of these tree options will allow you to drill into more details to further troubleshoot and correct the issues directly in dbWatch without having to open a database platform specific tool. You can complete all daily DBA operations directly in dbWatch.
Many of these display a dashboard with charts in the window on the right. Some of these items let you perform tasks, like executing a database backup. There is also a SQL Worksheet Item that you can click on and from that you can run queries on the server.
As a DBA, the Management module delivers an impressive level of details about your server with a click to resolve the issue directly in dbWatch. It also allows you to manage numerous database platforms and servers from a single tool.
Farm Module
As we transition from the Management Module to the Farm Module, let’s compare the feature set. The Management Module focus is narrow and deep. That being said, a single server with all associated metrics. Conversely, the Farm Module is wide, but slim. With the Farm Module, DBAs will see one or a few metrics such as disk or memory utilization, across your entire environment, which could be hundreds or thousands of instances in a single result set. This could be considered a bird’s eye view of your database farm enabling you to work more proactively. Because you can query across the environment, you can catch systems issues before they start generating warnings and alarms as they near thresholds.
In general, the Farm module is intended for large environments or for environments with numerous servers managed the same way such as by platform, application, configuration, etc. Since these groups of servers are managed the same way, you can focus on the few instances that are out of norm as compared to the rest of the environment. From there, you can correct the same issue across the group of servers which is a significant time savings for DBAs. As an example, there is one organization with 1700 database instances with the same configuration that are managed by only 2 DBAs with dbWatch.
Farm Module Interface
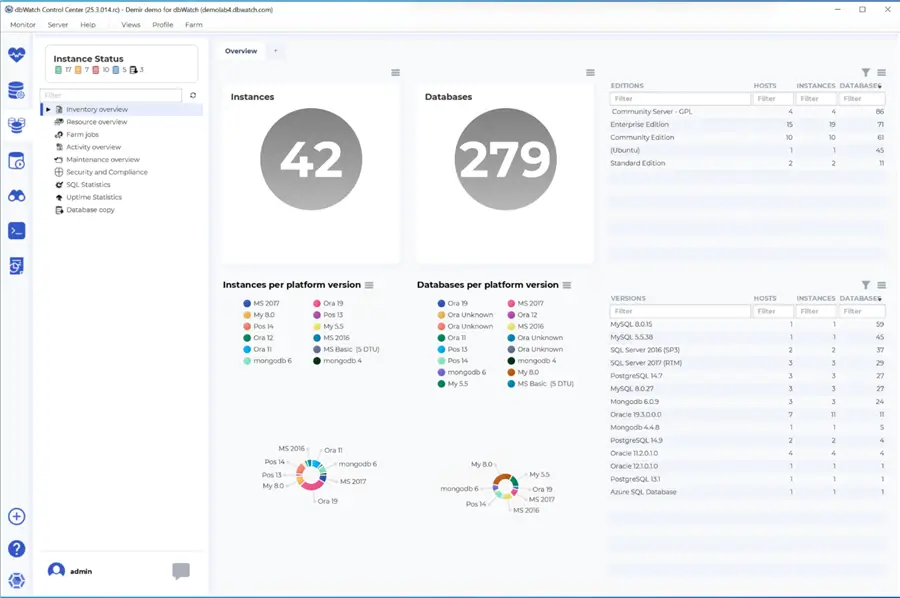
The Farm Module combines details about all the database servers in your farm. It starts with an Inventory dashboard that provides counts of instances and databases across the Farm. There are roll ups of servers by edition, version and platforms. Other views including: Resources overview, Farm Jobs, Activity, Maintenance, Security and Compliance, SQL Statistics and Database Copy Jobs.
These dashboards help database administrators navigate directly to issues and work them to resolution.
Farm Module Inventory
As a database administrator, this dashboard provides an inventory of the database farm you are responsible for. Additionally, you can drill into alerts and see the recommended actions to resolve the issues.
- Inventory Overview – This dashboard includes data rolled up into various meaningful groups for a quick glance of statistics across your server including count per platform, version, and editions which are important factors for DBAs and IT management. This can help with licensing cost management or server version upgrade management.
- Resource Overview – This dashboard focuses on disk and memory usage per platform. This gives DBAs the server footprint per platform.
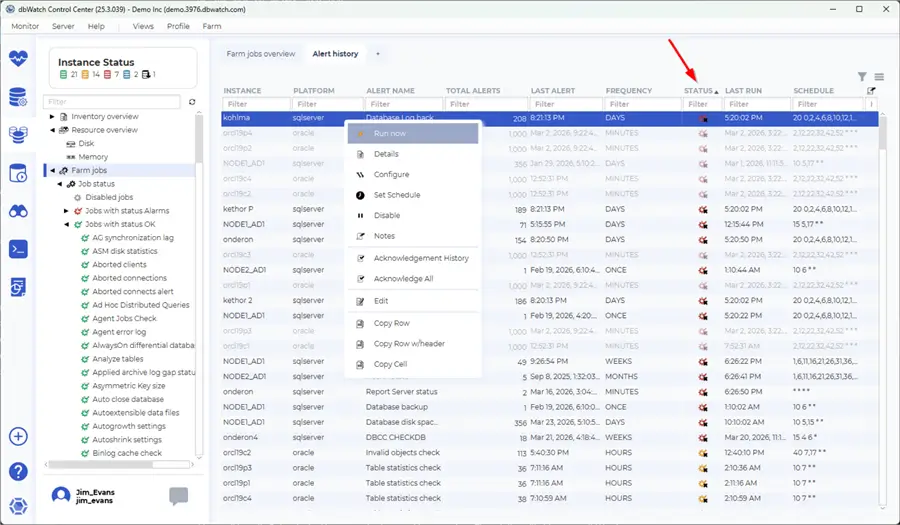
- Farm Jobs – As shown below, the Farm Jobs dashboard has two tabs. First is the Farm jobs overview with a summary of Job statuses. These are the dbWatch Jobs monitoring your servers, not SQL Server Agent Jobs. Example jobs include: SQL Statistics, Lock Statistics, Server Uptime, Aborted Clients, etc. The second tab is Alert History listing alerts and their status. You can sort by alert status, moving the failed status alert to the top of the page. From here you can right click the server with the failed alert and dig into more details.
Worksheet Module
Next is the Worksheet Module, which can be used to run SQL queries against a server \ instance or to run queries across multiple instances with a single result set. Code that can be run includes system stored procedures, custom SQL code, configuration settings, values in a table and more.
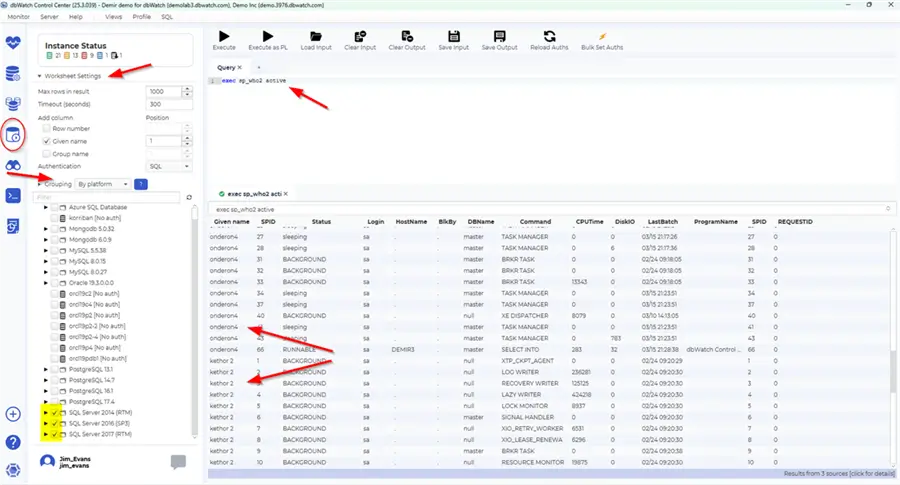
To access the module, use the left windows to modify the worksheet settings: set row counts, include Instance names or grouping logic for the query output. Under the Settings is a hierarchal list of supported Instances. In this pane you can use check boxes to select a single server or control a group of servers to run your query against. In the picture below I set row count to 1000, set Grouping to ‘By Platform’ and selected all my Microsoft SQL Platforms. Then in the right pane, I show running sp_who2 against all Microsoft SQL Severs. The results are combined and presented in a grid.
This is a powerful tool that can be used by database administrators to gather information across multiple servers and even run updates across multiple servers. Work with caution if updating across multiple servers. Test with one server first to ensure the results are accurate. Also be sure to use the appropriate Account. Note the option to “Set Bulk Authentication” across the Server instances selected. To learn more about using the Worksheets visit this link: SQL Worksheet.
Auto Discovery Module
The worst time to find out about an undiscovered database instance is when a failure occurs and there are no backups to bring the system online. The impetus for the Auto Discovery Module is to ensure there are no unknown database instances in your environment that are not being properly managed.
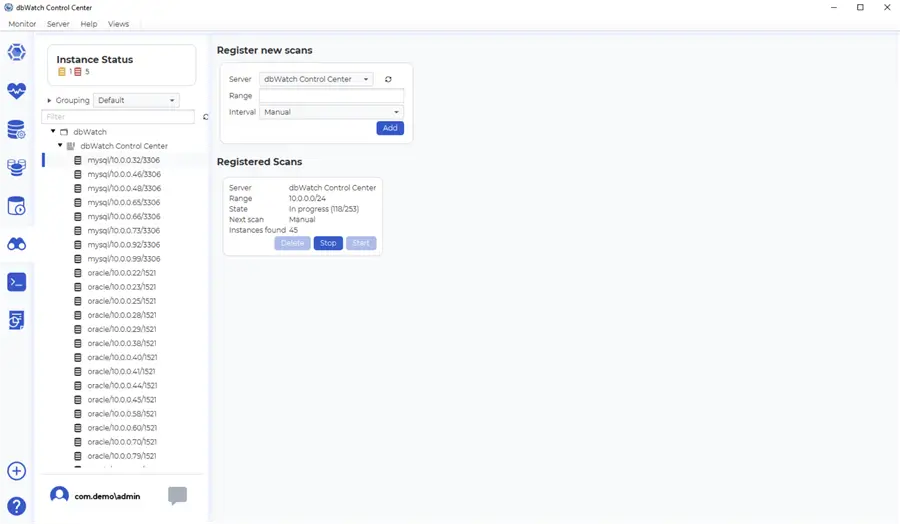
In the Auto Discovery Module, scans can be setup for servers not yet configured in dbWatch. The left pane shows discovered database Instances. In the right window you can create new scheduled scans for given IP ranges. Existing scans can be edited, manually run or you can see the status in currently running.
As a database administrator it is not unconceivable that servers get installed that you do not know of. The Auto Discovery module helps you find servers not monitored and helps you to maintain and monitor 100% of your company’s database server inventory. Learn more about Autodiscover Instances in dbWatch.
FDL Console
Next is the FDL Console, which is the foundation for dbWatch’s data collection and dashboards. FDL stands for Farm Data Language, which was created by dbWatch as a markup language to manage database instances and query data across the entire environment. This includes data extraction from source systems then loading to the dbWatch data warehouse in a high-performance manner. The FDL code is actually executed behind the scenes in the dbWatch dashboard to collect and display applicable data in an efficient manner without causing performance spikes on the source systems.
FDL Language
FDL is a powerful language allowing you to query across data points with custom procedures, 35+ built-in functions (AVG, SUM, MIN, MAX, etc.) and the ability to create custom functions written in JavaScript. In terms of the scale and performance, one dbWatch customer has built a custom dashboard that regularly accesses 275,000 databases in real time all via FDL.
To take things to the next level, the FDL Console can be used to create custom scripts using the Farm Data Language to query the information stored in the dbWatch farm and merge the data for reporting, custom dashboards, data integrations and data exports. FDL can save significant time accessing and consolidating data that was previously not possible or very difficult to access in the matter of a few hours. If you run into an issue, dbWatch support can assist as well.
FDL Dashboard
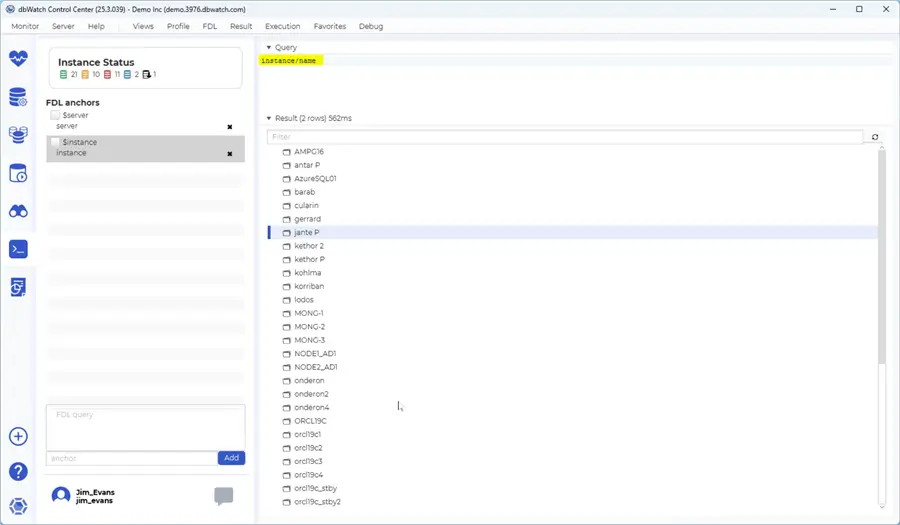
Referring to the picture below you can see the FDL Console has 3 main windows. The left is the Anchors; the top right is where you write queries and the bottom right is where you see the results. You can see I ran the basic query “instance\name” and my results are the list of server names in dbWatch. The dbWatch help has a nice section on the FDL.
I recommend after familiarizing yourself with the other features of dbWatch to review the FDL section from the dbWatch help page linked below. Then test out all the examples provided. This is a good way to experiment and start learning FDL. You get hands on experience and will start to understand FDL and how you can use it to handle advanced tasks in dbWatch.
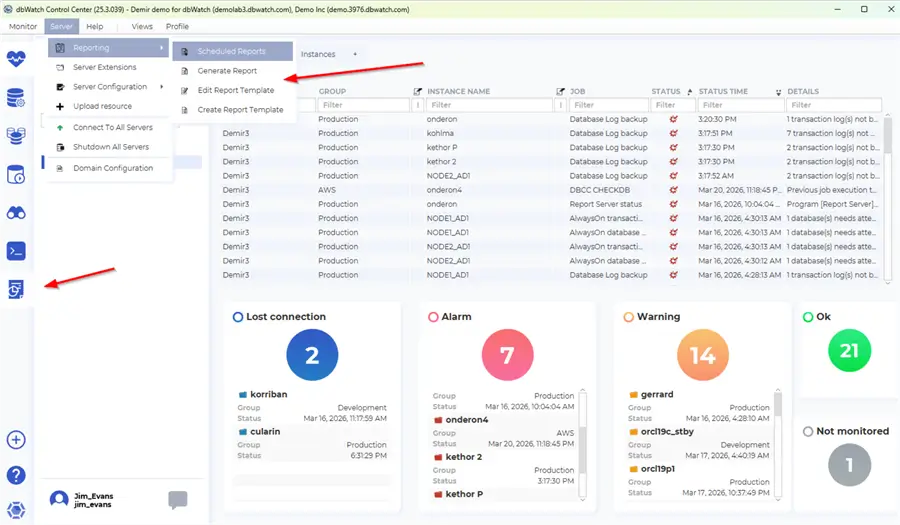
Reporting Console
The final section I will cover is the Reporting Console with many predefined reports based on the types of servers selected. You can use the top menu under Server, Reporting to Schedule Reports, Generate Reports, Edit Report Templates and Create Report Templates. You can also launch the Report Console by clicking on the Report icon in the left navigation menu.
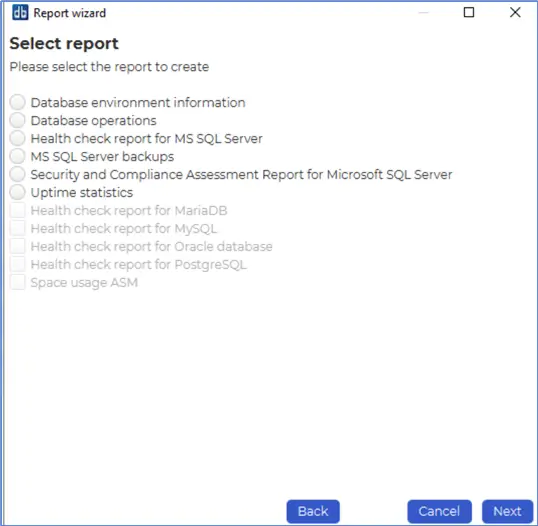
The Report Console will navigate through a set of screens to help you narrow down the servers for which you want to run reports. These include selecting the domain, the server folders, setting dates, selecting the reports from those available for the servers selected, setting report configurations such as output format (PDF, HTML), and a final screen to confirm your selection. The report will be generated and confirmed, and then the report will open. The PDF version displays an impressive multiple page report. HTML reports provide a browser based hyperlinked report.
Further, reports can be scheduled on a regular basis for delivery to DBAs or stakeholders. In addition, many of the dbWatch reports can be considered templates and customized based on your needs. This includes adding or removing sections based on SQL queries or FDL logic, merging data sets as well as update logos, headings, input parameters and more.
As a database administrator, the Report Console can generate a nice selection of reports as well as create report templates. The PDF version is easiest to share with stakeholders interested in how your servers are performing. This is a nice feature that DBAs can use to share how well they are performing their job and adding value to the organization.
This screen shows some of the reports available, with bolded named reports related to the server platforms selected.
Summary
dbWatch pulls all the main tasks a DBA needs into one place and gives you a clean, organized view of your entire database environment. Whether you’re working with Microsoft SQL Server, Oracle, PostgreSQL, MySQL, MariaDB, Sybase ASE, and MongoDB, or cloud platforms, dbWatch provides a clear picture of server health, lets you drill into details quickly, and gives you the ability to manage and run tasks across multiple servers. dbWatch combines monitoring, management, inventory, worksheets, auto-discovery, reporting, and even advanced FDL scripting making it a solid all-around solution for keeping your environment under control. For a database administrator, this means less time chasing issues and more time staying ahead of problems while keeping the whole server farm running smoothly.
Next Steps
- Visit the dbWatch page and request a Demo: Database Monitoring Tool – dbWatch.
- Register for a Free 90-day trial: Register – dbWatch.
- Visit the dbWatch WIKI page to learn more.

Jim Evans is an IT professional who has worked with SQL Server since 1995. He has a passion for SQL Servers and working with the people who utilize it. As a C++ programmer early in his career he was mentored to learn T-SQL with optimizing for performance always a goal. He has supported many corporate business units and application, taken part in designing many databases, managed DBAs, BI Developer and Data Management teams. He is always up for a challenge, embraces new features and functionalities as they are rolled out and enjoys sharing his knowledge. When not working on SQL Server he has spends time coaching youth sports, coaching in a disability softball league and volunteering with Black Dagger Military Hunt Club providing outdoor activities for veterans.
- MSSQLTips Awards: Trendsetter (25+ tips) – 2022 | Author Contender – 2021 | Rookie Contender – 2019