Problem
We have a large SQL Server environment across numerous locations that have grown tremendously over the years. However, our small team of database administrators has difficulty gaining insight into the SQL Server performance tuning issues in our environment beyond just simple CPU, memory, and disk utilization. The days of logging into every instance for monitoring are no longer realistic. We need to transition our team from single instance management and monitoring to managing the overall environment and addressing our most pressing needs to support the organization. How can we move from managing the trees to managing the forest in an efficient and automated manner with a small team with dbWatch Control Center?
Solution
As SQL Server environments continue to grow, so does the management and performance complexity. In the past, DBAs had a handful of critical production instances and supporting development and testing instances. As SQL Server has grown in popularity, DBAs are now challenged with managing hundreds to thousands of SQL Server instances in multiple physical locations and the cloud. To be productive (and not be fire-fighting constantly), DBAs have tried to build scripts in T-SQL and PowerShell as well as take advantage of some features in SQL Server Management Studio. Unfortunately, those scripts are difficult to maintain, lack insight into the overall environmental needs, and can compete with addressing core business needs.
Example: Understanding if a SQL Server instance is over-allocated, starved, or not in use can be difficult to determine in some circumstances and also costly to the organization. The over-allocated instance could be tying up expensive CPU, memory, and storage that another SQL Server could use to improve application performance. This reallocation of resources could reduce wait times in the call center, cutting the average cost of hold times and increasing client satisfaction ratings. Without environmental consistency and insight into the overall environment, this is difficult to optimize the environment. This is the time to move from managing individual SQL Server instances to the overall environment.
SQL Server Performance Tuning with dbWatch
One solution that is transforming how SQL Server DBAs work is dbWatch. dbWatch has introduced dbWatch Control Center, an automation tool, managing individual SQL Server instances and the overall SQL Server Farm in one application. Much of these can be accomplished with a few lines of code, exclusive to dbWatch, called Farm Data Language to support:
- Monitoring
- Management
- Dashboards
- Incident Workflows
- Automation
- Reporting
- Security and Access Control
- Integration
dbWatch’s Control Center is best suited for large complex IT environments such as Managed Service Providers (MSPs), health care, government, and large enterprises with SQL Server, Oracle, and MySQL databases with require optimization. Let’s see dbWatch in action.
Farm Views of a SQL Server Environment
dbWatch is built on a distributed architecture using Jobs to gather performance tuning and management data across the SQL Server farm. In the interface below, there are three ways to access the data: Summarized Job Status, Farm Jobs or Instance Status.
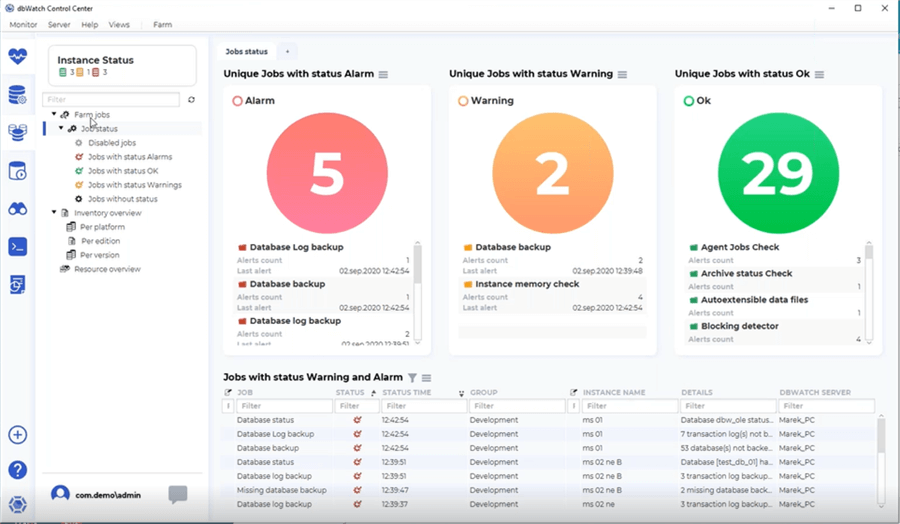
First, the Summarized Job Status in the center of the interface gathers data from each of the jobs and organizes the data as an Alarm, Warning, or OK. DBAs get an overview of job statuses to prioritize pressing issues and monitor logs, backups, and database performance.
Second, the Farm Jobs in the left pane of the interface above enables you to drill into each job status to determine the issue and begin working towards a resolution.
Third, the Instance Status on the top left of the interface organizes and includes color coding as OK (green), Warning (orange) or Alarm (red). This enables you to drill into each instance and begin troubleshooting as shown below.

dbWatch Farm Jobs Example
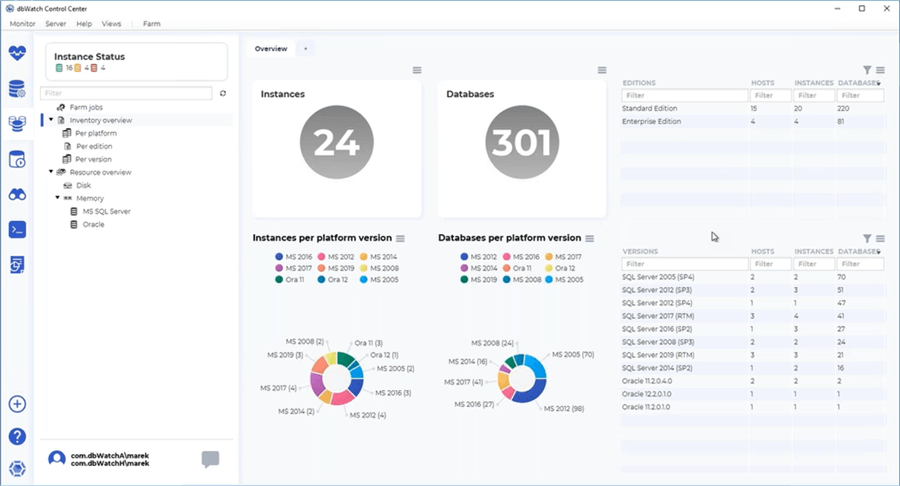
Beyond SQL Server performance tuning and management troubleshooting, the dbWatch Farm Jobs provide insight into the number of instances and databases as well as SQL Server version and edition. This informative interface provides a global view of the environment and can easily help to identify future upgrade needs.
dbWatch’s Farm view is not limited to high-level system performance metrics. The interface enables you to dig into performance metrics from SQL queries including:
- CPU
- Memory
- Disk
- Waits
- File IO
- DML
- Logical Reads
- Page Life Expectancy
- Query Optimization
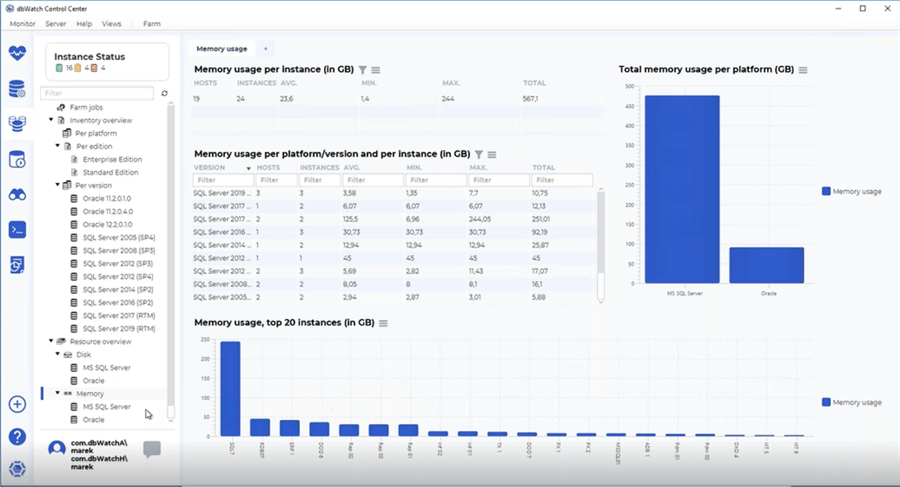
These interfaces display metrics relative to the entire environment to understand allocation, resource usage, min, max, average and counter-specific data. Below is an example of memory usage across the SQL Server farm.
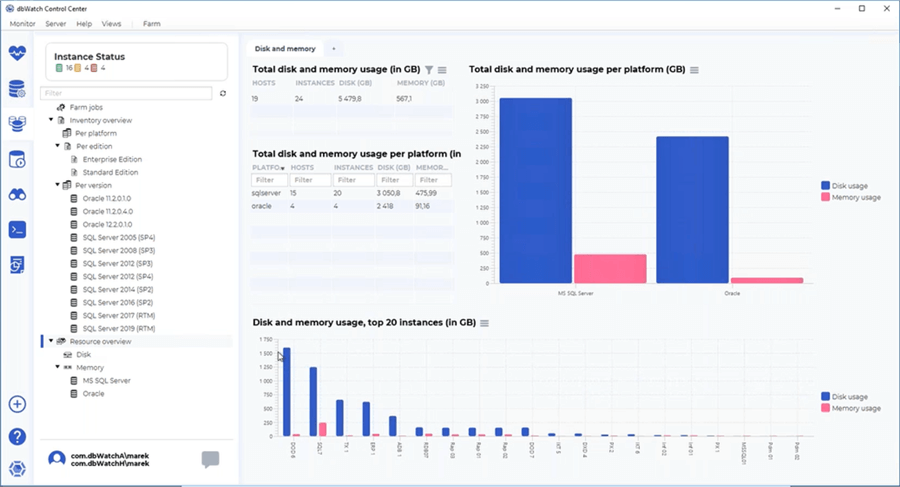
Data can also be consolidated across metrics to understand allocation and usage as shown below with disk and memory usage per platform. In the example shown, a bar chart displays the top 20 instances. This feature can be customized by adding another variable such as disk usage to gain further insight into resource utilization.
dbWatch’s Farm View provides a comprehensive view of your SQL Server environment to understand hardware resource utilization, gain insight into performance metrics and usage patterns across the environment as well as prioritize hardware resources and allocate DBA time to the most pressing needs. We have just scratched the surface of what is available with the SQL Server Farms View. dbWatch is a large enterprise application with the flexibility to provide insight into numerous SQL Server editions in addition to Oracle and MySQL, all in one interface.
dbWatch Problem Resolution
dbWatch seamlessly moves from the overall SQL Server Farm metrics to detailed instance metrics to enable SQL Server DBAs to make informed management and monitoring decisions. dbWatch’s instance-level interface has similarities with Microsoft SQL Server Management Studio (SSMS) including the ability to browse objects, correct issues with a point-and-click interface and also run SQL queries. But with all of the tool’s features, it can be considered an all-in-one tool for management and monitoring including query performance. The dbWatch interface is feature-rich with numerous graphics to help pinpoint performance bottlenecks and drill into the database engine to resolve these issues including:
- dbWatch Alerts
- Configuration
- Performance – Including indexing, latency, and query performance
- Sessions
- Disk and Memory Usage
- Backups
- SQL Server Error Logs
- Databases
- Security
- SQL Server Agent
- Operating System Manager
- Audit
- SQL Worksheet
Granular SQL Server Performance Tuning Data
Each of these high-level items expands with a list of numerous child options for more granular troubleshooting, analysis, and correction of bottlenecks. Much of this subsequent data is not available directly in SSMS; it would be necessary to build, maintain and run queries across numerous SQL Server editions. This is another area where dbWatch improves the productivity of DBAs by giving them access to data in an intuitive interface.

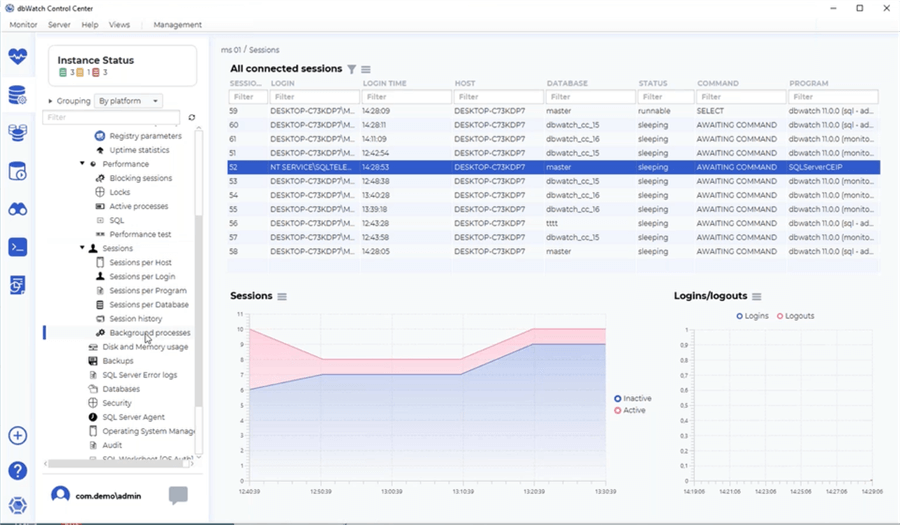
Session Data Example
Below is one example of the granularity and flexibility of the dbWatch instance interface. Session data is broken down in numerous ways (Sessions per Host, Sessions per Login, Sessions per Program, Sessions per Database, Session history, and Background processes) to assist with troubleshooting an active incident. Directly on the interface you can also right-click on a SPID and end the session if blocking or deadlocks are occurring.
Disk Space Usage Example
Below is another example of dbWatch instance-level metrics for disk and memory usage. This is a completely different interface compared to the session interface. This interface includes disk space usage by external files, transaction log files, data files, and free space in addition to memory metrics related to host memory usage and top memory usage in SQL Server. This is just a simple example to show how each interface is contextual and is simple to ascertain value.

Once again, this description is just the tip of the iceberg in terms of features to help troubleshoot and correct SQL Server performance and management issues. Together, there are 50+ interfaces at an instance level with a tremendous amount of information that is consolidated and organized. This data is not just raw counters for SQL performance tuning. Informative graphics are included to quickly paint a picture with meaningful data to take action on the performance problems. Rather than SQL Server Professionals building and maintaining queries, with dbWatch they can easily manage, monitor, and tune their environment and meet core business needs all from the comfort of a single application.
Farm Data Language
dbWatch’s Control Center is years in the making. At the core of this release is the Farm Data Language which enables much of the functionality of the SQL Server Farm and Instance level views. dbWatch built the Farm Data Language which is a query and path-based language to query across all relational database platforms (SQL Server, Oracle database, MySQL) and versions (SQL Server 2022, 2019, 2017, etc.), logical operators (join, merging, parameters, variables, calculations, regex, wildcards, etc.) and functions (sum, count, average, etc.) to display in visuals (tabular, graphs, etc.) with a very fast response time.
To use the Farm Data Language, start by specifying an instance. Next, specify the entities or values for your query such as “activity_phyiscal_reads” or “activity_cpu_count”. From there, specify the task such as “Locks held and statistics” or “table and index statistics”. To add logic, you can specify operators when querying the SQL databases.
Here is one simple syntax example for the session count and disk usage for a particular instance:
instance->i/name{"Database instance"}/$i/total_session_count{"Session count"}/$i/disk_usage{"Disk usage"}In the example above, we’re tabularizing the instances and displaying their instance name, total session count and disk usage. name{} serves as the column header so as total_session_count{} and disk_usage{}. Inside it the column headers read “Database instance” denoting the given instance name. This also applies to “Session count” and “Disk usage” which are the corresponding aggregated data for each database instance for the number of sessions and disk memory consumption, respectively. As you have noticed, /$i/ is the delimiter and the variable i set on the first line of the code. This can be read that we set lowercase i as data will be aggregated per instance-level.
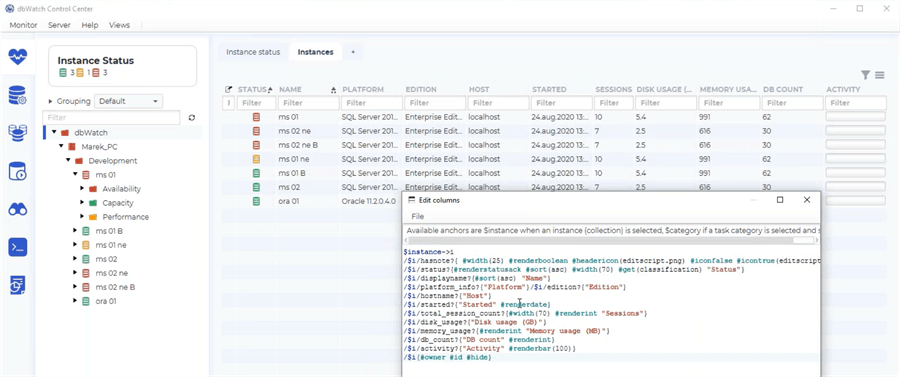
Review Farm Data Language Code
As you browse objects in dbWatch, you can also view all of the Farm Data Language code being issued as shown below:
The Farm Data Language is enabling organizations to efficiently access real-time data from numerous instances running on varying platforms with little impact on the source systems. This language also enables DBAs to build custom jobs to best manage and monitor their unique environments.
dbWatch Summary
We have just covered the tip of the iceberg for performance data with dbWatch:
- Farm Views
- Monitoring
- Management
- Resolving SQL Server Issues
- Dashboards
- Instance Views
- Farm Data Language
dbWatch Control Center is feature rich and each of these topics can be explored on a much deeper level.
Beyond the items covered in this article, dbWatch also includes unique features related to:
- Database Maintenance
- Reporting
- Incident Workflows
- Replication Monitoring
- Automation
- Execution Plans
- SQL Worksheet
- Reporting
- Web Server
- Security and Access Control
- Integration\Extensions
- Command Line Interface
- Linux Support
- DevOps
dbWatch is a robust application to streamline management and monitoring for large database environments (SQL Server, Oracle database, MySQL, etc.). This is accomplished by bringing standardization, consistency, automation, and efficiency to the environment. The product enables DBAs to begin managing their overall environment, with the ability to seamlessly drill into an individual SQL Server instance to troubleshoot and resolve high-performance issues.
Next Steps
How do I get started with dbWatch Control Center?
- Identify your SQL Server monitoring and management needs
- Enterprise view
- Prioritized issues
- Issue resolution at the instance level
- Multi-platform and multi-edition support
- No impact on source systems
- Query interface
- Discuss the needs and options with your team
- Reach out to dbWatch for a personalized demo by emailing – info@dbwatch.com
- Download a trial edition of dbWatch Control Center
- Work through a proof of concept in your environment
- Contact Support with any Questions
- Demonstrate the value of dbWatch Control Center
- Determine new insights your team will have into your database environment
- Calculate the time savings for your team
- Discuss the next steps with your team
MSSQLTips.com Product Spotlight sponsored by dbWatch makers of dbWatch Control Center.

Jeremy Kadlec is a Founder, Editor and Author at MSSQLTips.com with more than 300 contributions and 25+ years of SQL Server experience. Jeremy leads a team of more than 300 authors helping millions of SQL Server professionals around the globe every second of the day for the last 20 years. He is also the CTO @ Edgewood Solutions and a six-time SQL Server MVP based on his community contributions. Jeremy brings 25+ years of SQL Server DBA and Developer knowledge to the community and holds a bachelor’s degree from SSU and master’s degree from UMBC.


Faiz,
Yes – dbWatch supports Oracle and additional database platforms.
Check it out here – https://www.dbwatch.com/download-dbwatch-controlcenter
HTH.
Thank you,
Jeremy Kadlec
Does this also work with Oracle ?