Problem
I need to administer a large number of databases and database servers with a relatively small team. We need to be able to manage rollouts, patching, maintenance plans, best practice settings, scheduled tasks, monitoring, alerting and performance issues. Is there a software solution to help me automate some of these tasks? Will it help improve the efficiency of my DBA group? Let’s take a look at what dbWatch Control Center has to offer for database management.
Solution
It is important to be able to roll out a new DBMS server and have all the proper settings and maintenance plans put into place. Without that, the server may not perform well or may not be properly backed up.
- A server must remain properly patched or it could be vulnerable to malware or hacking attacks.
- Scheduled tasks sometimes fail and need to be handled in a timely fashion to keep workflows moving.
- When a server is having performance issues that can have a very direct and negative impact on business. The DBA needs to have visibility into performance metrics to detect and solve such problems.
A good DBA knows all of this and can take action for each item mentioned above. The problem is, how to complete these tasks in the most effective and efficient way. Many tasks need to be completed by the DBA, but there are only so many hours in the day.
SQL Server ships with a few tools that can help in these areas. However, they fall short pretty quickly in most environments. The SQL Server Agent can send an email when a job fails. However, its ability to alert is limited to that one method. There are no built-in warnings for settings that don’t meet best practices, backups that aren’t happening, or missing patches.
SQL Server Management Studio (SSMS) offers Activity Monitor to see current database activity. However, it doesn’t offer any activity history, let that be an hour ago, a day ago, or a week ago. If the DBA can’t catch a performance issue right away, the data needed to solve the issue may be lost forever.
This is where a tool like dbWatch becomes so beneficial for database management.
dbWatch Control Center Overview
dbWatch will make you a much more efficient DBA. With its automation capabilities, you’ll be able to roll out new instances to meet best practices in just a few clicks. You’ll be able to find and fix performance issues or failed tasks in a matter of moments. Keeping up with patching will no longer be a challenge.
dbWatch Control Center is the only tool on the market that can truly bring a DBA’s entire estate into a very responsive and easy-to-use “single pane of glass”. In fact, dbWatch boasts of one customer that has 270,000 databases across 1,300 DBMS instances managed by 2 DBAs. A feat only possible due to the efficiencies and automation opportunities delivered by dbWatch Control Center.
All my DBMS platforms in one tool
dbWatch Control Center allows the DBA the ability to monitor all their DBMS instances from a single dashboard. It can monitor SQL Server, Oracle, MySQL, Postgres, MariaDB, and other database servers simultaneously. These servers can be on-premises, in the cloud, physical or virtual. dbWatch is also cluster aware.
Check out this dbWatch Control Center dashboard that shows a single dashboard with 19 instances of SQL Server and Oracle databases which are a combination of on-premises, Azure and AWS.
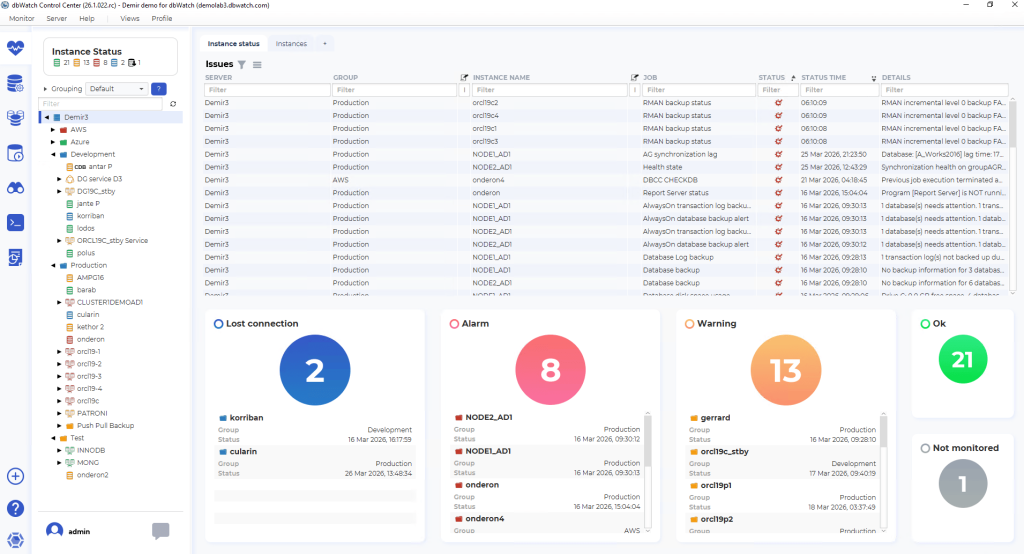
Putting all those servers on one screen can seem very daunting. dbWatch has a database management plan for that too! The target servers can be grouped, sorted, and filtered. This makes it easy to find just the ones you want to see.

All my locations, clouds, and customers in one tool
For many, their DBMS estate encompasses different data centers or cloud providers. If that estate is being monitored by a central DBA group, then the security of the data that is passed around becomes paramount. With dbWatch Control Center, these different server locations can be combined into a single tool. The connections between dbWatch Control Center and those target instances are protected using advanced encryption to ensure security. It is important to note that the data is never shared between the target instances. This makes dbWatch Control Center a fantastic solution for managed service providers (MSPs). They need to monitor many target DBMS instances that can span several clouds, locations, or domains at one time.
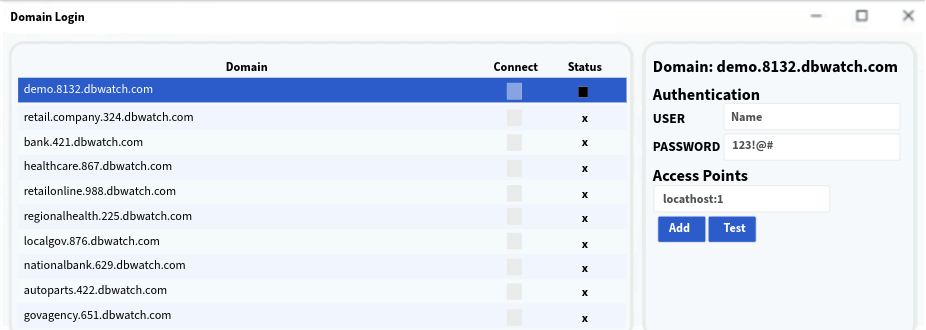
This screenshot shows how different domains can be accessed within the dbWatch framework.
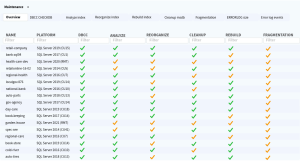
Imagine having one dashboard created automatically right out of the box, to alert any SQL Server maintenance problem across the entire estate no matter the location, version, or platform.
Automate tasks to save time
dbWatch Control Center has a feature called automated maintenance. With this feature, you can automate maintenance and modify settings like max memory to match historical trends and current usage patterns. In larger environments, this can be very useful in reducing the effort needed by the DBA group to keep up with constantly changing workloads.
Another way to save time for database management is with templates. dbWatch Control Center is delivered with several customizable templates that can be applied to a target instance. This feature allows for a very quick rollout of new instances. Just point dbWatch Control Center at a new instance and choose a template. dbWatch Control Center sets all the best practice settings and maintenance plans. This includes backups, statistics updates, index defragmentation, consistency checks, etc. that match your needs. This feature is very useful when a new group of servers is installed for a project as it can be applied to many servers at once.

dbWatch Best Practices Templates
As a DBA who specializes in Microsoft SQL Server, I really love this feature. Every once in a while, I get asked to look at a different DBMS for one reason or another, but I know so little about Postgres or Oracle. With dbWatch Control Center, I can just choose a default template for that type of instance — written by an expert in that DBMS — and know that I’m meeting database management best practices.
This image shows that best practices are installed with managed jobs.

Find new instances and get them enrolled using Auto Discovery!
Speaking of new instances, other products require an additional product license to help keep your DBMS instance inventory up to date. Not so with dbWatch Control Center as this feature is included at no additional charge. Let it scan the network to look for new instances of which the DBA might not yet be aware. If you find one, apply a template!

Make this product work for you with customization
The dbWatch Control Center application is written using a custom language called Farm Data Language (FDL), called so because it can query your entire farm. FDL allows the application to run code written in the native language for any database it monitors and put it all together on one screen, dashboard, or report. It is also open and available to be customized or copied as a base for a new screen, dashboards, reports, or monitoring points.
FDL Example
This is a default counter as defined by dbWatch Control Center for SQL Server instances. It’s incredibly simple to understand and implement.

If you don’t like it, you can change it. Maybe you want to exclude a specific database from a check. That’s not a problem, go ahead and change it in this settings file and FDL will call your customized performance counter. Keeping with the efficiency theme, this can be done directly from dbWatch Control Center. You don’t have to leave dbWatch Control Center and open this file in a separate text editor.
If you need a new monitoring point, go ahead and make it. You could see how active a particular installation of OLTP software is by counting a metric such as invoices created today or how busy a DMS is by counting the number of documents checked out.
To implement, just copy and paste an existing metric, provide the query you need dbWatch Control Center to run, and you’re on your way. That metric will now be available to be included on screens within the applications or on reports. If it is something you think other dbWatch Control Center users might want as well, let the development team know. They just might include it in a future release!
Job Editor
If XML isn’t your thing there is a designer that will allow you to modify the existing metrics or save them as a brand-new metric.

For this type of job, the editor is limited to code supported by the platform.
Run queries right from the monitoring and maintenance platform
Continuing the theme of database management efficiency, how many times has a job failed for a reason such as a string or binary data would be truncated? The DBA must now figure out who entered something like a name or an address that is too long. With most tools that means that the DBA has to leave their management tool to investigate. Not so with dbWatch Control Center. There is a built-in query tool to quickly do a diagnosis. This feature is a huge time saver.
Similar to the Registered Server / Central Management Server feature in SSMS, dbWatch can also run queries against multiple target servers at once. But with dbWatch, the feature is even more powerful as it can execute a query even if the target servers are totally different platforms! There are several output options so there is sure to be one that works for you.
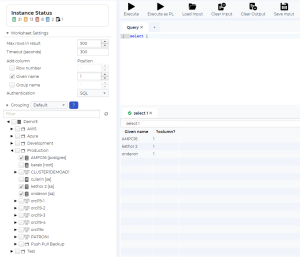
This screenshot shows the database management feature in action. The query being run is incredibly simplistic so the real excitement is everywhere else on the screen. Where SSMS will add the server name to the output as the first column of a multi-server query, dbWatch Control Center can add that optionally — and place it anywhere in the result set — along with an optional row number or group name. This is seen on the top left of the screenshot. The bottom left shows how target instances can be selected. On the top right is the query being executed and on the bottom right is the output.
Find slow queries and correlate them to performance moments
Unfortunately, performance issues aren’t always straight forward. They can stem from different causes, so it’s useful that dbWatch can look at performance from multiple angles. The issue could be a query consuming too many resources, a block from other queries, or a user or process may place a heavy load on the database. In each case, the result is the same for end users: slower performance.
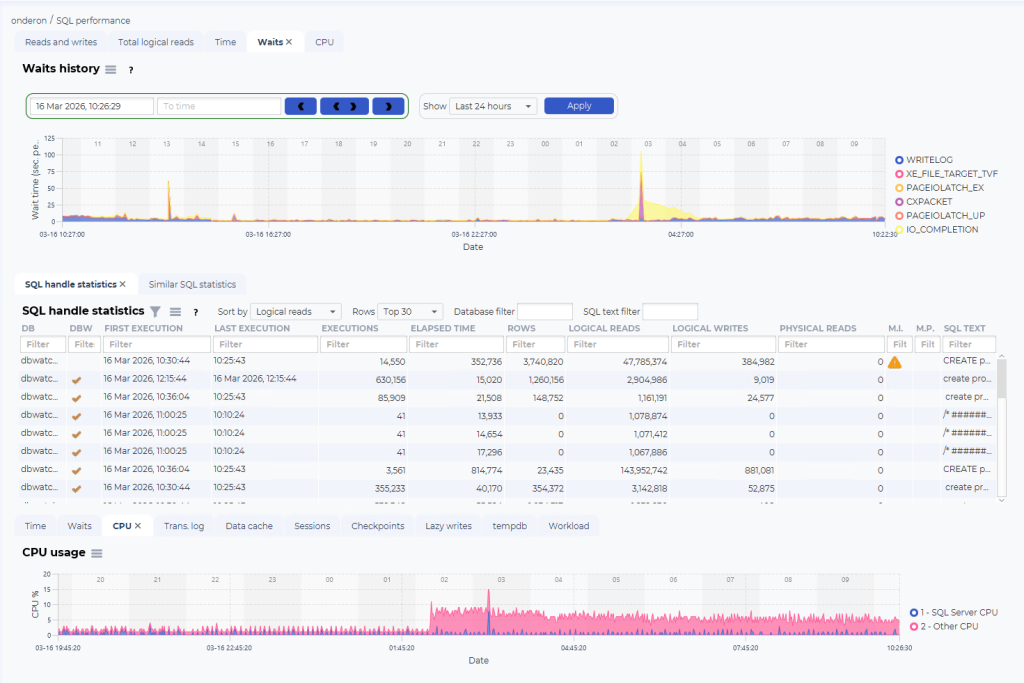
The views shown here help users analyze query performance by highlighting peaks in key metrics and linking them to periods of degradation.
From within Performance Tuning, users can drill down. The screenshots in this section show only part of the available functionality, but they illustrate how users can review performance history and investigate query impact in detail.
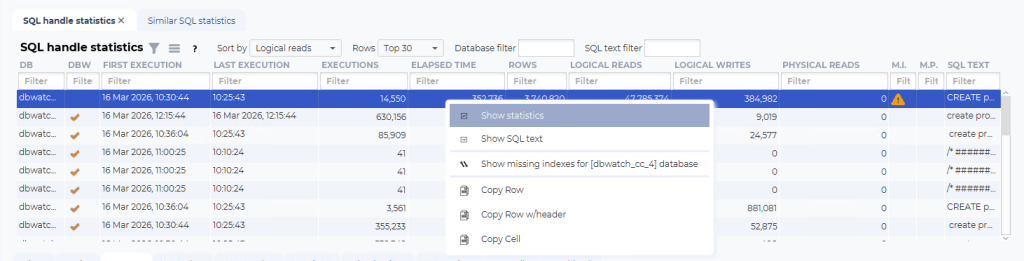
The screenshot below shows how you can drill into the SQL handle statistics for a specific statement and explore its performance in more detail. The overview tab shows key metrics at a glance, while the other tabs let you analyze the data from different angles. By clicking and dragging in the top chart, you can focus on a specific period and immediately see the handles and statistics for that window. From there, it becomes easier to spot missing indexes, identify statements with multiple query plans, open and review those plans, and understand their performance impact.
Using a right click, you can dig into the SQL handle statistics of a specific statement.
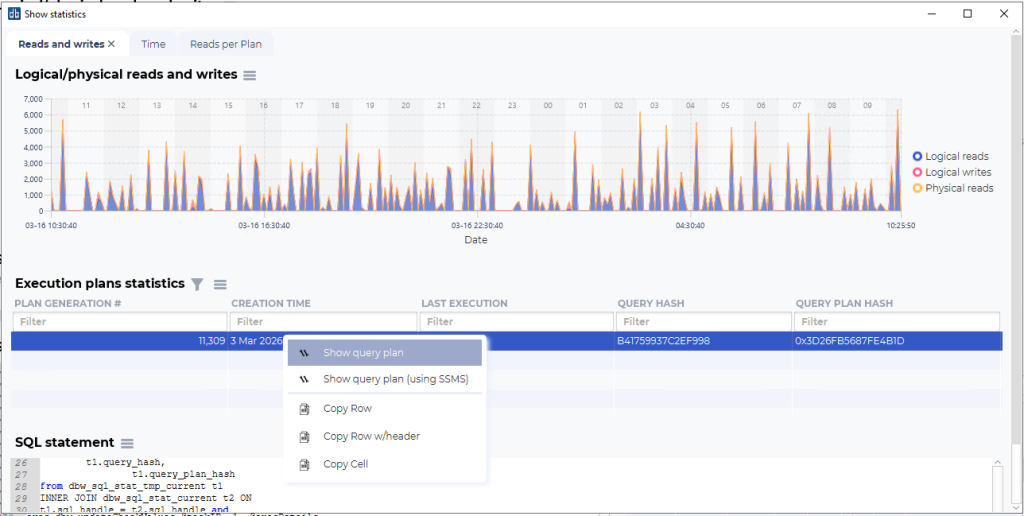
Below, you can see what happens when you dive into a flagged query. You can see statistics and dive into looking at the different query plans.
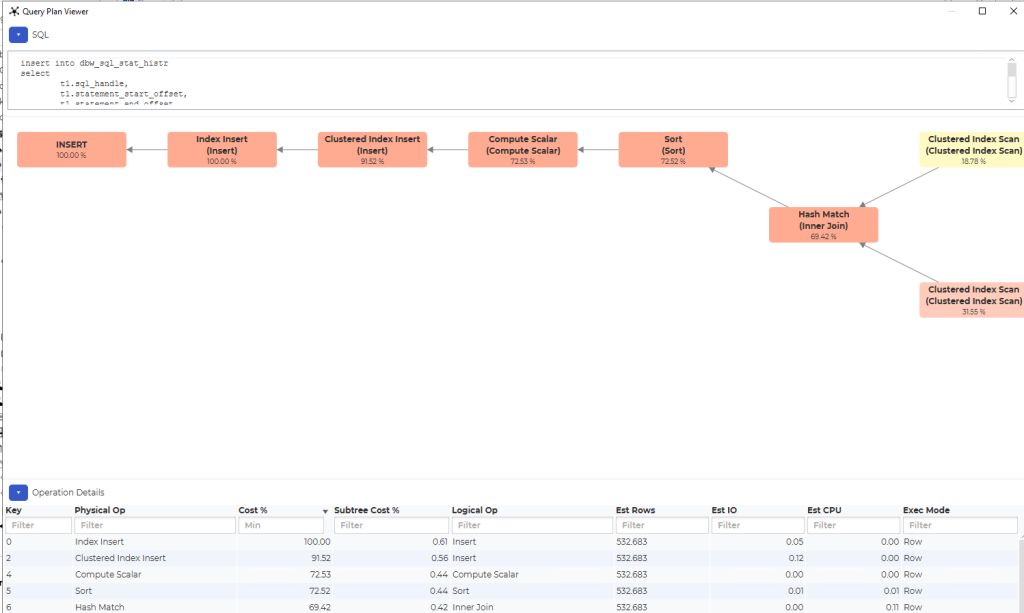
Finally, here’s a screenshot of a query plan, with highlights what has the most performance impact on the query. Its color coded for their impact, showing red, yellow, blue and green. Although this test environment is showing more red, with high impact points.
Keep up to date on patches
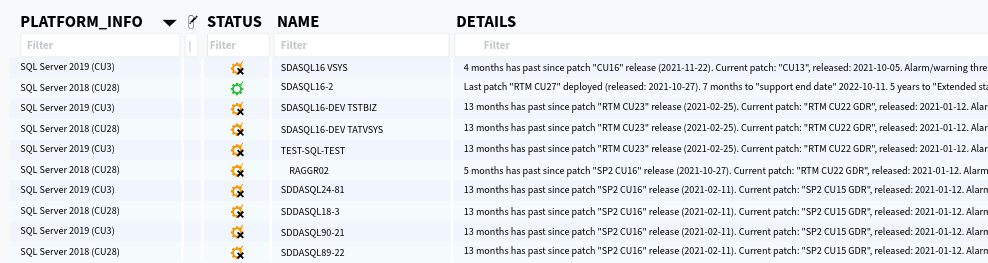
Patching SQL Servers is a very important step in keeping your environment secure. For SQL Server, Microsoft releases new patches on a regular basis. Since every firm has different policies on when these patches should be applied it can be challenging to keep track of each new update and when you are ready to install. This gets exponentially harder as the environment grows to include many versions of SQL Server and other DBMS. Luckily, dbWatch Control Center is prepared for this. It keeps a list of patches along with the date of their release. Simply set the timeline for when you are expected to install the patches (2 weeks after release, 6 weeks after release, etc.) and have dbWatch warn you as the expected install date approaches — or if the date gets missed.
Dedicated support staff
dbWatch Control Center is a tool written by data professionals and for data professionals. When you use the tool and talk to the staff it shows. They want to make you more efficient.
The management team at dbWatch believes that if a DBA needs assistance with their product that they probably want to talk to someone that knows the problems a DBA faces, someone that speaks the DBA vernacular. If you reach out to dbWatch for support, your request is not going to a call center, but rather it will be answered by a DBA with 10 or more years of database management experience in the field.
In addition, their support team is geographically dispersed meaning support can be reached at most hours of the day for most parts of the world rather than being limited to the working hours of one or two time zones.
Their development staff is equally as impressive. That group is fanatic about their product. They boast that they can turn around a bugfix or feature request in a matter of a few weeks — a timeline unheard of in the industry.
Free Trial and Pricing
You truly have to see dbWatch Control Center in action to understand how responsive the intuitive the screens are or how well it works right out of the box. To help with this, dbWatch offers a full version trial for six months to monitor five database instances for free. A credit card is NOT required to download, install, and try the software.
Next Steps
What this article describes is just scratching the surface of what dbWatch Control Center can do. Give it a try and see what dbWatch can do for you.
MSSQLTips.com Product Spotlight sponsored by dbWatch, makers of dbWatch Control Center.

Eric has been a SQL Server DBA and Architect in the legal, software, transportation, and insurance industries for over 10 years. Currently he is the Sr Data Architect for Squire Patton Boggs, a leading provider of legal services with 47 offices in 20 countries.
Eric is a 2018-2019 Idera Ace and has co-authored 2 Idera Whitepapers.
He has been a presenter at PASS Summit, IT/DevConnections, SQLSaturdays, the in.sight transportation conference, and the Ohio North SQL Server User’s Group.
- MSSQLTips Awards: Author of the Year Contender – 2021, 2022 | Trendsetter (25+ tips) – 2021