Problem
Dave’s a typical overworked DBA who monitors more SQL Servers than there are hours in a day. He starts today by opening an email from a furious but important client. The message details last night’s awful performance for an application his team supports. His first thought is that everyone blames the database when performance issues crop up. This email is one of many from the client. He’ll deal with them later, like always. But how long can he keep ignoring database performance problems? Dave and other hardworking DBAs need a cost-effective performance monitoring solution.
Solution
Can you look back last week, or even last night, and see what caused the slowdown on your SQL Server and know how to fix it? Don’t chalk up lousy performance as only a user problem. If you’re responsible for databases that are the backbone of applications, it’s your problem, too. I’ll show you a SQL performance monitoring tool that might save your job. At the least, it allows you to make better decisions when performance issues crop up. I’m talking about the SQL Server Performance Pack available in dbWatch.
What is dbWatch?
As a kid, I collected Swiss army knives. I am not sure why, but they fascinated me. My prized one had over 50 functions, including a ruler and writing pen. With my trusty knife, I was ready for anything. dbWatch is a Swiss army knife for DBAs. It’s an all-in-one instance-level monitoring tool. In real-time, you can track backups, uptime, disk space, and one of my favorite things, performance, for every instance in your farm. In this article, I will present three performance monitoring tools available in dbWatch:
- SQL Performance Dashboard
- Session Performance Dashboard
- Real-time Reporting
SQL Server Performance Dashboard
The SQL Performance Pack is the latest addition to the dbWatch Control Center. This add-on enables you to check real-time activity and review historical trends. Once you install the SQL Performance Pack, give it a few hours to gather meaningful data. Every five minutes, the dbWatch jobs collect performance data and store it in a database. This data is not coming from the Query Store.
Once dbWatch gathers enough data, you’ll be ready. Do you need to see which statements caused your database to slow down this morning or last night? No problem. To get started, navigate to the SQL Performance dashboard under the server node to review.
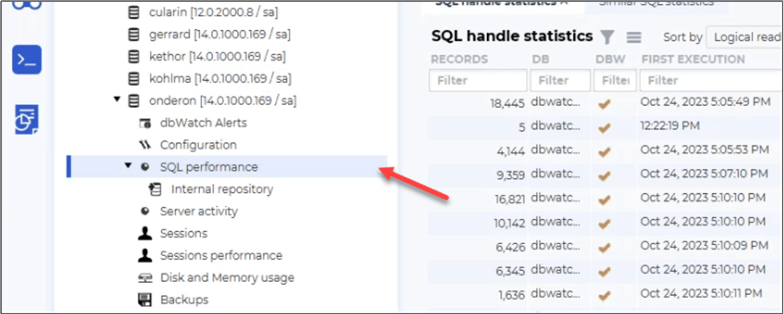
With dbWatch enabled on every SQL Server instance, you’re a few clicks away from checking the health of your entire SQL farm. Some performance markers you have access to include:
- Logical/physical reads and writes. How many pages does SQL read or write, and is the count higher than usual?
- Elapsed query execution time. Which statements take the longest time to complete?
- Wait statistics. Review the highest SQL wait stats (i.e., LATCH_EX, CXPACKET, etc.).
- CPU usage. Find out which statements or sessions cause the CPU to spike.
- Transaction log usage. Detailed history of KBs flushed per minute.
- Data cache activity. Up-to-date stats on memory usage.
- Sessions. How many sessions are active, and is the count higher than usual?
- Lazy writer and checkpoint statistics. Analyze your checkpoint and lazy writer execution patterns.
- Tempdb usage. Review how much space Tempdb consumes.
Now, let’s take a closer look at two of the performance markers from above.
Logical/Physical Reads and Writes
If someone asked how to help increase the SQL Server performance of a query, some might say, “Reduce the number of physical or logical page reads.” Yet, at their core, most performance problems arise from excessive physical or logical page reads. One feature of the dbWatch performance pack is the insights into the number of page reads and writes.

Let’s customize the timeframe to focus on. Ask yourself: Was the issue an hour ago or something that happened over the weekend? Once you choose a timeframe, finding spikes in read/write activity is easy. In the screenshot above, notice the spike in logical reads.
After identifying the spikes, drill down further to review the individual statements running at the time set above. There’s also an option to filter out any query activity caused by dbWatch (DBW).
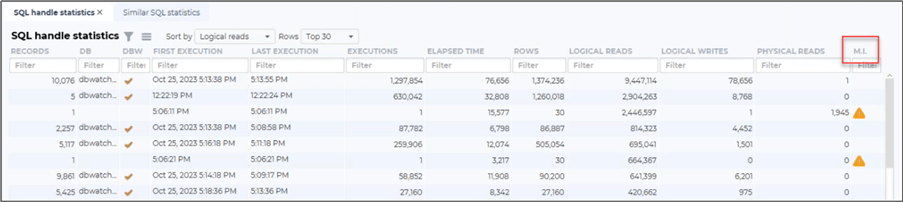
For the individual statistics above, you can sort by:
- Count of executions.
- Total elapsed time.
- Count of rows returned.
- Logical reads, logical writes, and physical reads.
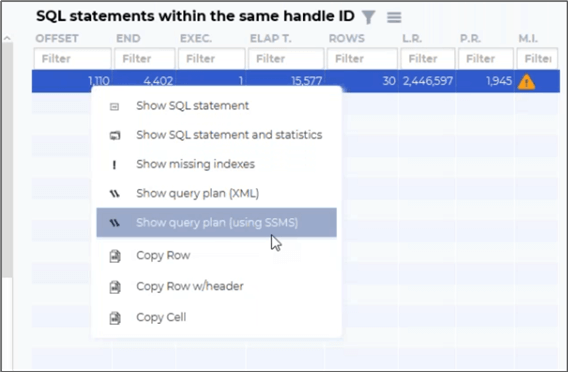
The rows drop-down allows you to change the results set size and keep the list small to focus on. The filter highlighted in the screenshot above (M.I.) shows if a missing index hint exists. If reducing page reads allows queries to run faster, then indexes provide the roadmap for the optimizer. I don’t advise following all missing index recommendations, but sometimes, they can be spot on. Finally, you can open the query plan in everyone’s favorite, SQL Server Management Studio.
Individual SQL Handle Statistics
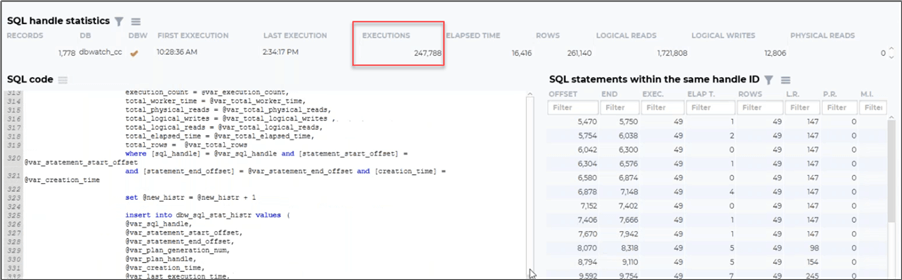
Statement statistics are great, but what about queries with lots of statements? If you’ve seen or written a multi-hundred-line stored procedure, you know they can be hard to troubleshoot. With dbWatch, you can view statistics for each of the statements running under them (same SQL handle) and the SQL code. This layout makes spotting trouble statements simple.
Another critical statistic to pay attention to is the number of executions. With this data point, you can focus analysis efforts on high-impact queries rather than something trivial that runs once a month or yearly. Finally, overblown executions might mean your apps call the statement more than it should. It’s easy for app developers to make mistakes like this, but with dbWatch, they are easy to spot.
CPU Usage
When someone calls or sends me a message about a slow application, CPU usage is one of the first stats I review. High CPU usage might mean you need to:
- Increase the server’s core count.
- Update stale statistics.
- Add covering indexes.
Examining issues from a historical view is difficult without a robust monitoring tool. Imagine the slowness happening yesterday, and you just now see a message from the support team.
With dbWatch, navigating to a problem timeframe and determining the cause is easy. For example, imagine years ago, you configured full database backups to run during off hours. But you recently opened your application to users across the globe. Now, these new users are experiencing terrible performance during their working hours. dbWatch allows you to verify whether the backups were the cause of the high CPU. Don’t wait for users to complain. Look at the activity and act.
Other CPU
dbWatch even distinguishes between SQL Server activity and other CPU activity. In a perfect world, you only want SQL Server running on the server. Other CPU activity highlights if someone snuck in another application. Your issue might be a virus scanner gone wild; the possibilities are limitless. I spent my early years working in software support, and I’ve seen almost every application you can think of running along with the SQL Server engine. Overall, SQL Server doesn’t like sharing resources.

Session SQL Server Performance Dashboard
While working as an SQL developer many years ago, I sat in the cube next to our company’s lead DBA. He loved watching Activity Monitor for long-running sessions and killing them. Think of the Session Performance dashboard in dbWatch like the Activity Monitor for Management Studio, but light-years better.
Inside dbWatch, you can review the individual sessions with the Session Performance dashboard. Like the performance dashboard, the Sessions dashboard collects stats about individual sessions. Click on the Session performance node to determine which applications or users are causing performance issues.

As with almost everything in dbWatch, you can customize the timeframe. Was the slowness in the last 24 hours, or was it a few days ago? Maybe you’re coming back from a long holiday weekend? The line chart below represents the total active sessions for the timeframe. It looked steady during the last 24 hours, with only a few minor dips.

The screenshot below shows the session statistics, each displayed in the grid. All the critical stats are ready for you to review:
- Logical reads
- CPU time
- Elapsed time
- Login
- Host

Additionally, you can drill down further into the statistics for each session period. Do you notice the issue in the screenshot below? Nearly three million logical reads, that’s one big statement. Naturally, this one caused CPU and elapsed time to increase.

Is Barbara in accounting refreshing her Excel workbook for the tenth time today? I know this can be frustrating. Here’s an idea: we could add indexes or suggest filters to help reduce the workload. dbWatch makes locating these problem sessions a breeze.
Real-time Reporting
Whenever my internet goes out, I want to know how long it will take to get online again. My internet provider offers real-time dashboards highlighting affected users and the anticipated downtime. This info may not make the service return faster, but knowing someone is aware and working to resolve it gives me peace of mind.
Like my internet provider, dbWatch offers a rich reporting system. You can schedule static reports detailing the overall health of your SQL environment. Here are a few of the built-in reports:
- Database environment information.
- Health check report.
- Microsoft SQL Server backups.
Also, you can schedule and email any report to a select group of users. They offer countless options to customize every aspect of the layout. Want to put your company logo on the first page? No problem, you can do that. A report-savvy person will geek out over the possibilities for hours. For any database dbWatch connects to, use the report editor (pictured below) and some SQL code to build actionable insights.
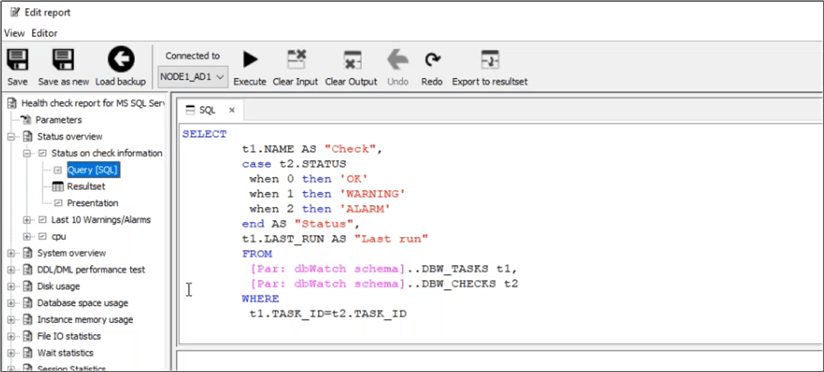
One last thing I found helpful is they allow you to create a copy of their existing reports to customize them. Maybe for the Health check report, you want to add a section or even remove some areas you don’t care to see; you can do all that and more.
Client Dashboards
The reports in dbWatch are not limited to static data. You can build dynamic dashboards highlighting useful metrics for clients. Picture a single database instance acting as the backend for software supported by a team of engineers. Day after day, they reply to emails and take incoming customer calls. The support team only cares about their application, not the other SQL instances on your farm. With the dashboards in dbWatch, you can create a view for them to see the instance’s health in real-time. Now, when customers call in, the support staff has all the details at the click of a button.
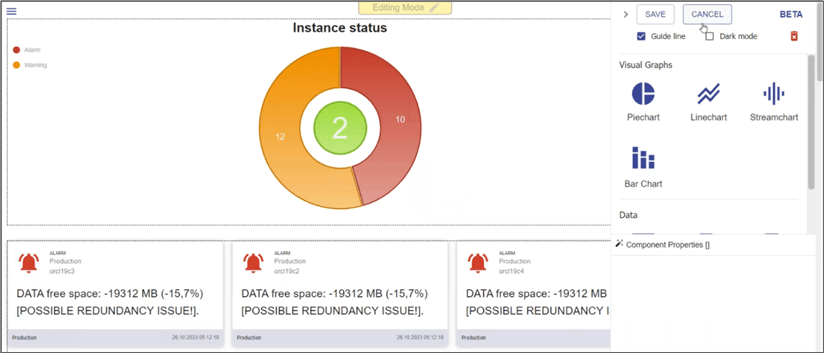
The bottom line is that clients want to see their application’s health. There is no easier way to present the stats than with the dashboards in dbWatch. If you’ve created reports in Power BI or SQL Reporting Services, the possibilities built into dbWatch might surprise you.
Getting Started
The hardest part of anything meaningful is getting started. Working with new software is the same. But dbWatch makes getting started easy for you. Their website offers a detailed wiki covering every feature in detail. Also, their YouTube channel provides hours of free educational content. And they offer a free 30-day trial of the software, no credit card required. Are you worried about the time investment to install the demo?
As an experiment, I timed how long it took for me to download, install, and configure the demo. I spent 15 minutes getting everything up and running for one SQL Server instance. I didn’t expect it to be so easy to get started.
Now, where should you go from here? Here are three easy steps:
- Download and install dbWatch, which comes with a 30-day free trial. I felt no pressure to buy, a big win in my book.
- Check out the dbWatch YouTube channel. They have a 16-minute video featuring the Performance Pack.
- Contact a sales representative to learn how they can save you 50% compared to competitors.
Key Takeaways
- After you build a solid disaster recovery plan, identifying, and fixing database SQL Server performance issues is the most impactful way to improve a user’s experience with an application.
- You owe it to your clients to have real-time robust SQL performance monitoring in place. Do you know the health of your SQL farm?
- dbWatch doesn’t only work with SQL Server. You can connect it to platforms like Oracle, MySQL, Sybase, and PostgreSQL. In fact, you can see all your different instances in the same view for easy administration.
- The built-in SQL Server Activity Monitor doesn’t cut it when you need historical data or to check the health of several instances at once. Do yourself a favor and download dbWatch Control Center today.
Next Steps
- Everyone wants to increase their productivity in work and life. Jeremy Kadlec wrote the article, The Secret to Doubling DBA Productivity with dbWatch Control Center.
- To learn more about the performance features in dbWatch, read the article, Enterprise SQL Server Performance Tuning and Management with dbWatch.
- I spend lots of free time watching videos on YouTube. If, like me, you need to include useful videos into the mix, dbWatch has an in-depth channel with hours of informative content. Go and subscribe to their channel now.
MSSQLTips.com Product Spotlight sponsored by dbWatch makers of dbWatch Control Center.

Jared Westover is a SQL Server specialist with two decades of industry experience covering T-SQL development, performance tuning, administration and Microsoft Fabric. He is currently a software architect at Crowe, an author at Pluralsight and primary contributor at sqlhabits.com. On MSSQLTips.com, Jared is a respected award-winning author for his clever T-SQL solutions and bringing to light new real-world solutions to age-old development problems.
- MSSQLTips Awards
- Achiever Award (75+ tips) – 2026
- Author of the Year – 2023
- Author Contender – 2024/2025


It’s a pity you don’t have a donate button! I’d without a doubt donate to this superb blog!
I guess for now i’ll settle for book-marking and adding your RSS
feed to my Google account. I look forward to brand new updates and
will share this website with my Facebook group. Chat soon!
This information is invaluable. How can I find out more?