Using PerfMon for SQL Server Reporting Services Performance Management

By:   |   Comments (1)   |   Related: > Reporting Services Performance


Problem

How can I manage and evaluate the performance of my SSRS report server?  Do you recommend any native SQL Server tools? 

Solution

Over the past few tips, we have been exploring many of the various tools and methods available to evaluate, troubleshoot, and monitor your SQL Server Reporting Services (SSRS) instance. The most basic place to start when troubleshooting your SSRS instance is with the SSRS Execution Log; you can see details about the use of the Execution log at: http://www.mssqltips.com/sqlservertip/2722/sql-server-report-server-2008-r2-execution-log-reports/.

Next, you can see one of the important steps in backing up your SSRS database is to backup your SSRS Encryption Key which is published on MSSQLTips.com at: http://www.mssqltips.com/sqlservertip/3312/sql-server-reporting-services-ssrs-encryption-key/.  

Finally, several SSRS logs are available to identify errors that surface and you can use this tip http://www.mssqltips.com/sqlservertip/3348/sql-server-reporting-services-ssrs-log-files-for-troubleshooting/ to help you review the available SSRS logs.

For this tip, we are going to focus on using Performance Monitor commonly known as PerfMon to track and monitor your SSRS performance statistics. As with many tasks, PerfMon is a tool that provides a wealth of information, but must be used cautiously as data collection can slow the performance of the SSRS server.

SSRS and PerfMon Performance Tuning

SSRS has two main PerfMon collection sets; one set for SSRS in stand alone mode, and one set for SharePoint integration mode. The actual list of counters available for stand alone mode is shown in the next set of screen shots. 

Perfmon List 1

Perfmon List 2

Perfmon list 3

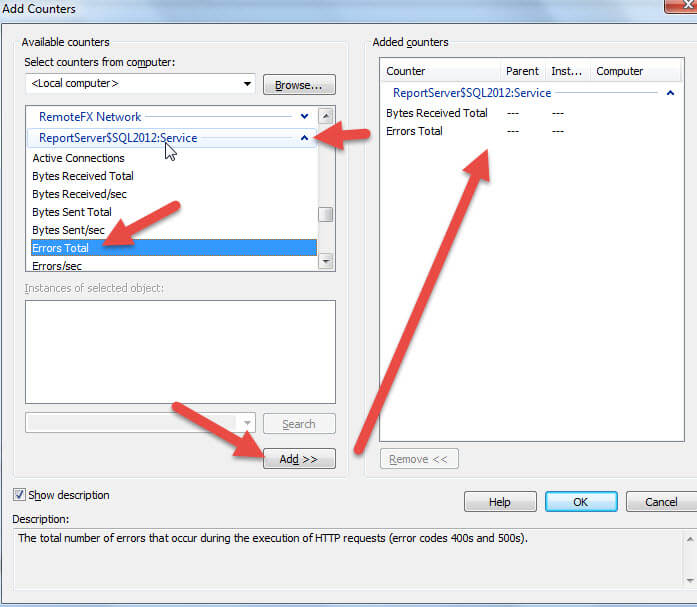
In order to add any of these counters to our PerfMon screen, we first must click the green plus sign to add new counters. 

Add Perfmon Counter

As illustrated next, the counters available are actually categorized into major groups. In the below illustration, the ReportServer:Service group is actually suffixed with "$" and the instance name "SQL2012". To add the entire group, you can highlight the groups and click on the Add button. It is also helpful to click on the Show description checkbox, so you have a better idea of what you are adding.

Add Counter

Alternately, we can add the individual counter by using the down arrow next to the group name, selecting the appropriate counter, and finally clicking Add. Notice again in the below screen print, I have the Show description box checked. Of course, as you also see in the below screen print, you can remove counters by clicking on a counter in the Added counters window, and then clicking Remove.

Add Perfmon Counter

Important PerfMon Counters for SSRS

As noted earlier, there are twenty-one SSRS specific counters that can be used to monitor your SSRS instance. Of these twenty-one, the following should be especially noted:

  • Active Connections - Number of active connections.
  • Errors Total - Number of errors received in total and per second. These data are handy if you are experiencing website issues including 400 level errors. Per second versions of these counters are also available.
  • Memory Pressure State - This counter is a rating of 1 to 5 with 1 meaning no pressure and 5 meaning extreme pressure. If you are seeing performance issues on your server, this counter and the number of active connections noted above are key baseline figures.
  • Login Attempts Total and Login Success Total - These counters give you a good idea if someone is attempting to unsuccessfully login to your server. Only RSWindowsNegotiate, RSWindowsNTLM, RSWindowsKerberos, and RSWindowsBasic authentications are monitored and per second versions of these counters are also available.
  • Requests Executing - Number of requests currently being processed.
  • Requests Total - Total number of requests logged by the report server from the report manager since startup (last reboot).
  • Requests Rejected - This counter is an important key if many users are complaining about the report server not serving their reports; it provides the number of requests which were not completed due to insufficient server resources.
  • Requests Disconnected and Requests Not Authorized - Number of requests which failed because of a communication error and the number of requests which produced 401 errors.
  • Tasks Queued -  Number of request currently in queue to be processed.
  • Bytes Received Total and Bytes Sent Total - Number of bytes received and sent respectively by the report server and report manager. Per second versions of these counters are also available.

TechNet also suggest that a good way to get a list of available counters for SSRS is to use the following PowerShell script: CounterSetName (get-counter -listset "ReportServer`$SQL2012:Service").paths. I had to modify the command slightly in order to add the SQL2012 instance, and the results are show below.

PS Counter List

Now that we have described the counters let us take a look at two ways to view the data. As shown in the below illustration, we can first use the PerfMon charts to show our counter values. This method is handy for watching for trends in the data, although when many counters are added at one time, it is often hard to read especially when the scale of the counters varies widely.

Perfmon Graph

Alternately, we can look at the data in a report format as displayed below. Although this method is handy for seeing hard break point in time values, it does not show trending data. Notice, since I am running SSRS on my laptop, the number of total requests is pretty small as I reboot this machine often.

PERFMON Report

SSRS Data Collector Set

One alternative we can use to get data in the same format and include the same counters for each PerfMon run is to create a SSRS Data Collector Set. This set creates a model template with the included counters. This process is shown below.

new data collector set

The Collector can then be started and stopped at will by right clicking the set in the User Defined list and selecting start or stop.  Once the set has run, a report can be generated by opening the User Defined folder under Reports and drilling into the appropriate report, called System Monitor in the below screen shot.

ssrs collector set

PerfMon and these data are great methods for monitoring and base lining your SSRS instance.  

Conclusion

In order to troubleshoot the performance of your SSRS server, PerfMon is another valuable tool in your toolbox to keep your SSRS server running at its peak. In addition to the SSRS Execution Log and System logs mentioned in previous tips, PerfMon provides a method for recording and displaying twenty-one different counters which can help you determine what has been and is now occurring on your server. These counters include recording the number of login attempts, successful logins, SSRS website errors, and number of executing, rejected, disconnected, and total requests. A memory pressure state is also available. Once you add the SSRS counters to PerfMon, a Data Collection Set can be created which builds a model or template with your included counters; this collection set can then be run at will and subsequently used as a basis for a collection set report.

Next Steps


sql server categories

sql server webinars

subscribe to mssqltips

sql server tutorials

sql server white papers

next tip


About the author
MSSQLTips author Scott Murray Scott Murray has a passion for crafting BI Solutions with SharePoint, SSAS, OLAP and SSRS.

This author pledges the content of this article is based on professional experience and not AI generated.

View all my tips


Comments For This Article


Tuesday, October 14, 2014 - 3:04:39 PM - anil Back To Top (34959)

Excellent explanation..Thank you.


get free sql tips
agree to terms