Problem
As you design and deploy more and more reports to your Report Server, how do you review which reports are being run, how often, and how long the reports take to render?
Solution
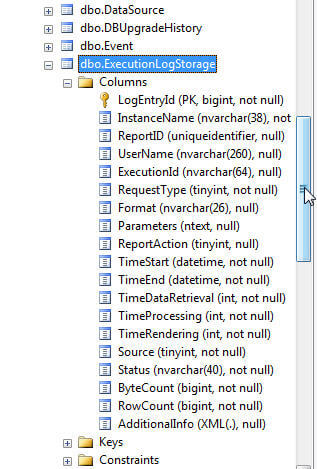
SQL Server Reporting Services (SSRS) installs a ReportServer database which houses the nuts and bolts of the Reporting Services Infrastructure. In particular, the Report Server Database contains the ExecutionLogStorage table. With each run of a Report Server report, the ExecutionLogStorage table is populated with important details about the report execution.
To make the details of the report run easier to comprehend and ultimately query against, Microsoft provides three views which should be used: ExecutionLog, ExecutionLog2, and ExecutionLog3.

These views contain additional case expressions and criteria which simplify Execution Log reporting. ExecutionLog and ExecutionLog2 are provided for backward compatibility to SQL 2005 and SQL 2008, and thus it is recommended that you use the ExecutionLog3 view. The code below shows the DDL for the ExecutionLog3 view.
CREATE VIEW [dbo].[ExecutionLog3]
AS
SELECT
InstanceName,
COALESCE(C.Path, ‘Unknown’) AS ItemPath,
UserName,
ExecutionId,
CASE(RequestType)
  WHEN 0 THEN ‘Interactive’
  WHEN 1 THEN ‘Subscription’
  WHEN 2 THEN ‘Refresh Cache’
  ELSE ‘Unknown’
END AS RequestType, — SubscriptionId,
Format, Parameters,
CASE(ReportAction) WHEN 1 THEN ‘Render’
  WHEN 2 THEN ‘BookmarkNavigation’
  WHEN 3 THEN ‘DocumentMapNavigation’
  WHEN 4 THEN ‘DrillThrough’
  WHEN 5 THEN ‘FindString’
  WHEN 6 THEN ‘GetDocumentMap’
  WHEN 7 THEN ‘Toggle’
  WHEN 8 THEN ‘Sort’
  WHEN 9 THEN ‘Execute’
  ELSE ‘Unknown’
END AS ItemAction,
TimeStart,
TimeEnd,
TimeDataRetrieval,
TimeProcessing,
TimeRendering,
CASE(Source)
  WHEN 1 THEN ‘Live’
  WHEN 2 THEN ‘Cache’
  WHEN 3 THEN ‘Snapshot’ WHEN 4 THEN ‘History’
  WHEN 5 THEN ‘AdHoc’
  WHEN 6 THEN ‘Session’
  WHEN 7 THEN ‘Rdce’
  ELSE ‘Unknown’
END AS Source,
Status,
ByteCount,
[RowCount],
AdditionalInfo
FROM ExecutionLogStorage EL WITH(NOLOCK)
LEFT OUTER JOIN Catalog C WITH(NOLOCK) ON (EL.ReportID = C.ItemID
GO
You can easily navigate to http://msdn.microsoft.com/en-us/library/ms159110(v=sql.105).aspx to review MSDN’s description of each of the fields; further Robert Bruckner’s ExecutionLog2 View – Analyzing and Optimizing Reports, provides additional details about the view’s fields even though it references the ExecutionLog2 view.
Specifically, the following fields are of note:
- Instance Name – If you are in a web farm environment, this field will display the exact instance for the report request.
- ExecutionID – Identifies the request; however this field is not unique as a request can have multiple lines in the log for a single request.
- Format – often this field will be RPL or HTML4.0 as these convey an interactive rendering of the report (which most users do first), but other formats could include Excel, Word, or PDF.
- AdditionalInfo – This field is an XML datatype and contains a hodge podge of different information including ScalabilityTime, which identifies reports which may be under memory pressure, and EstimatedMemoryUsageKB, which records the peak memory usage.
Although the ExecutionLog3 view is a good base start for SSRS reporting, I have found creating a second view provides additional details required for reporting on the execution log. Specifically, as noted in the code listing below, Name (Report Name), CreatedByID, ModifiedByID, Description, CreationDate, and ModifiedDate from the Report Server database Catalog table have been added to a new view called ExecutionLog3_Modified. Furthermore, Year, Month, Month Number, Day of Week, and Day of Week Number have been added to create some additional date context. Please note the Catalog table is undocumented and could change in the future.
USE [ReportServer]
GO

SET ANSI_NULLS ON
GO

SET QUOTED_IDENTIFIER ON
GO

CREATE VIEW [dbo].[ExecutionLog3_Modified]
AS
SELECT
EL.InstanceName,
COALESCE(C.Path, ‘Unknown’) AS ItemPath,
EL.UserName,
EL.ExecutionId,
CASE(EL.RequestType)
  WHEN 0 THEN ‘Interactive’
  WHEN 1 THEN ‘Subscription’
  WHEN 2 THEN ‘Refresh Cache’
  ELSE ‘Unknown’
END AS RequestType,
— SubscriptionId,
EL.Format,
Parameters,
CASE(EL.ReportAction)
  WHEN 1 THEN ‘Render’
  WHEN 2 THEN ‘BookmarkNavigation’
  WHEN 3 THEN ‘DocumentMapNavigation’
  WHEN 4 THEN ‘DrillThrough’
  WHEN 5 THEN ‘FindString’
  WHEN 6 THEN ‘GetDocumentMap’
  WHEN 7 THEN ‘Toggle’
  WHEN 8 THEN ‘Sort’
  WHEN 9 THEN ‘Execute’
  ELSE ‘Unknown’
END AS ItemAction,
EL.TimeStart,
YEAR(EL.TimeStart) AS Start_Year,
MONTH(EL.TimeStart) AS Start_Month,
DATENAME(MONTH,EL.TimeStart) AS Start_Month_Name,
DATENAME(DW,EL.TimeStart) AS Start_Day_Of_Week,
DATEPART(WEEKDAY,EL.TimeStart) AS Start_Day_Number_of_Week,
EL.TimeEnd,
EL.TimeDataRetrieval,
EL.TimeProcessing,
EL.TimeRendering,
CASE(EL.Source)
  WHEN 1 THEN ‘Live’
  WHEN 2 THEN ‘Cache’
  WHEN 3 THEN ‘Snapshot’
  WHEN 4 THEN ‘History’
  WHEN 5 THEN ‘AdHoc’
  WHEN 6 THEN ‘Session’
  WHEN 7 THEN ‘Rdce’
  ELSE ‘Unknown’
END AS Source,
EL.Status,
EL.ByteCount,
EL.[RowCount],
EL.AdditionalInfo,
C.Name,
C.CreatedByID,
C.ModifiedByID,
C.Description,
C.CreationDate,
C.ModifiedDate,
CASE
  WHEN C.TYPE=1 THEN ‘Folder’
  WHEN C.TYPE=2 THEN ‘Report’
  WHEN C.TYPE=3 THEN ‘XML’
  WHEN C.TYPE=4 THEN ‘Linked Report’
  WHEN C.TYPE=5 THEN ‘Data Source’
  WHEN C.TYPE=6 THEN ‘Model’
  WHEN C.TYPE=8 THEN ‘Shared Dataset’
  WHEN C.TYPE=9 THEN ‘Report Part’
END AS Type_Description
FROM
  ExecutionLogStorage AS EL
  LEFT OUTER JOIN Catalog AS C ON (EL.ReportID = C.ItemID)

GO
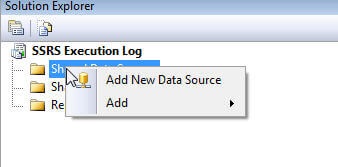
Now we can move onto making use of this information for actual reporting using Business Intelligence Design Studio or BIDS. First, create a new Reporting Services Project. We will utilized shared data sources, so right click on Shared Data Source, and Select Add New Data Source.
You will fill in the New Data Source Name and change the Type to Microsoft SQL Server. Next select the Connection String Edit button. Fill in your Server Name and then select or type in the appropriate database name, generally ReportServer. Be sure to test the connection using the Test Connection button.

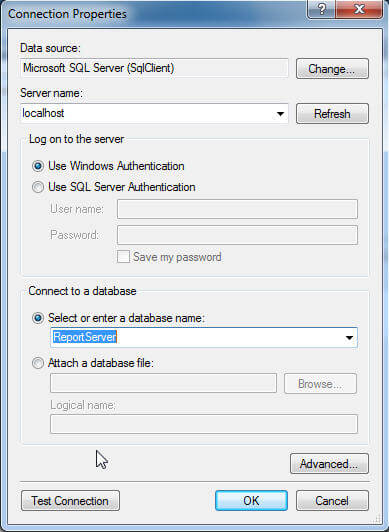
Depending on the roles created for the server you are connecting to, you may have to change the access details noted in the Credentials window. In our demo we will use Windows Authentication Integrated Security, so on the Connection Properties dialog box, click OK and then OK again.
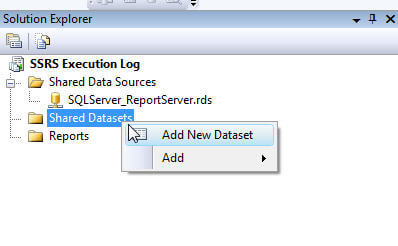
We will now create the dataset to be used in the report. This step requires planning and forethought as to what fields will be displayed on the report and what fields will be used to filter the data both when establishing the dataset and during report generation as parameters. These decisions will impact how the data is returned to the design grid and ultimately to the report itself. To create the data set, right click on Shared Datasets and then select Add New Dataset.
The Shared Dataset Properties windows opens; enter a data set name, and be sure the Data Source field displays the data source mentioned in the above step. Next, click on Query Designer to open the Query Designer window as displayed in the below figure.

The query designer has several options and methods that will ultimately affect your end report. For this query though, we want to just add the ExecutionLog3_Modified view, and then select all the fields from that view. See the figure below for the exact query; finally, click OK, and OK.

At this point, our data source and dataset are created, we are now ready to begin creating a report based on our ExecutionLog3_Modified view. Thus, right mouse click on Reports, Select Add, then New Item. Name the new report and select the Report (not Report Wizard) template. Finally, click Add.


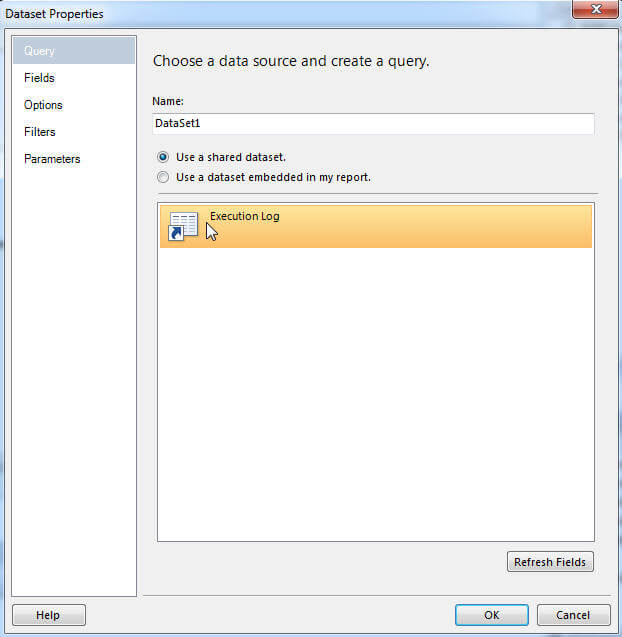
The last two steps in the Add Report Process is to add our shared data source and shared data set. First, right click on the Report Data Sources and select Add Data Source. Name your Report data source and then click on the Use shared data source reference radio button, and select the previously created data source from the list. Set your credentials if needed.


Follow the same process with the data set. Right click on Datasets, and select Add Dataset. Name your dataset ( I left mine as the default ), select the Use a shared dataset radio button, and then highlight / select the shared data set previously created and finally click OK.

We now proceed to actually creating a report with a few tables; this report will be called our SSRS Performance Summary and will include several TOP 10 tables. The first step is to prepare the report by adding a Report Header and Report Footer. Right Click on the report area, and Select Insert, Page Header. Do the same for Page Footer.

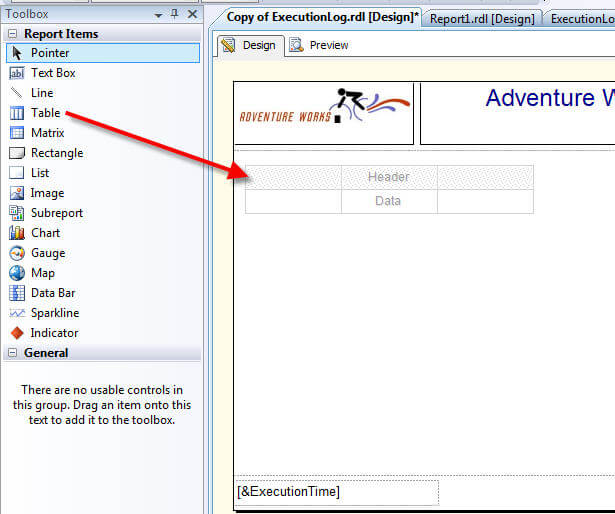
Next, add an Image in the Page Header along with a Text box with the Report Title. In the Page Footer, add the Report Execution Time. You can add the report Execution Time by dragging it from the Report Data Tab’s Built-in Fields list.

Next from the Toolbox, drag a Table onto the design surface.
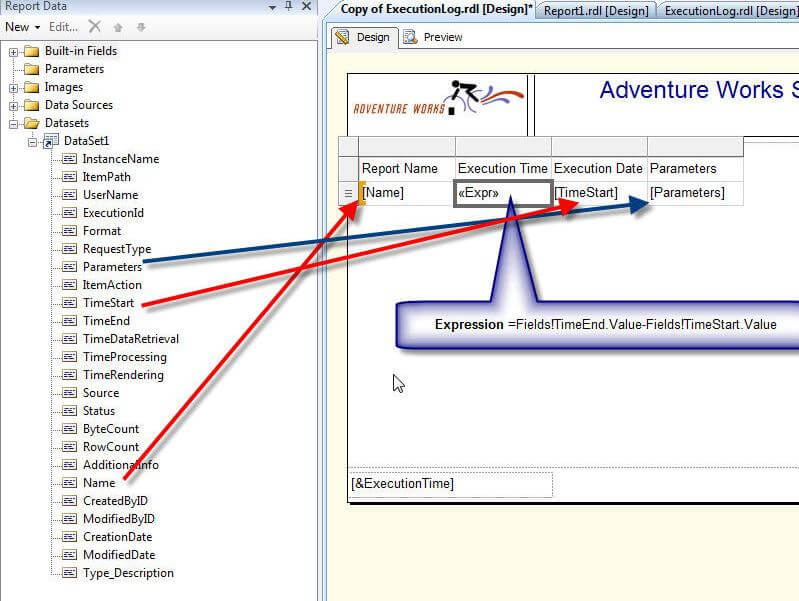
To complete the table, drag the Name Field onto Column 1, in Column 2 Enter =Fields!TimeEnd.Value-Fields!TimeStart.Value, drag the TimeStart field to Column 3, and drag Parameters to Column 4.
Next, we will add the Top 10 Filter Criteria to the Table. Right click on the upper left corner box of the table and Select Tablix Properties. Additionally add the Filter Properties as described in the below figure.

Subsequently, add the Sorting functionality as shown in the figure below. As we want the longest running queries, be sure to change the Order to Z to A.

Finally for this table, a few formatting items are completed. First, the column names and column widths are adjusted and the column headers font and background colors are changed to white and blue respectively. Also, a row is inserted above the existing column headers which describes the data displayed in this particular portion of the report.
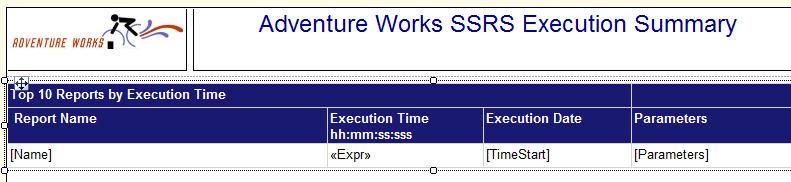
A preview of our report is shown in the figure below.

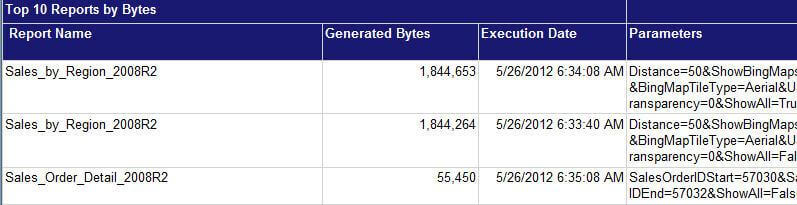
Next, using the same process described above, add two additional tables, one for Generated Bytes and one for Row Counts. One short cut you could take is to copy and paste first table (twice), and then change the column 2 header and value, and then adjust the Filtering and Sorting options to reflect the current Top 10 Item. The ensuing figure displays the three tables for our report.
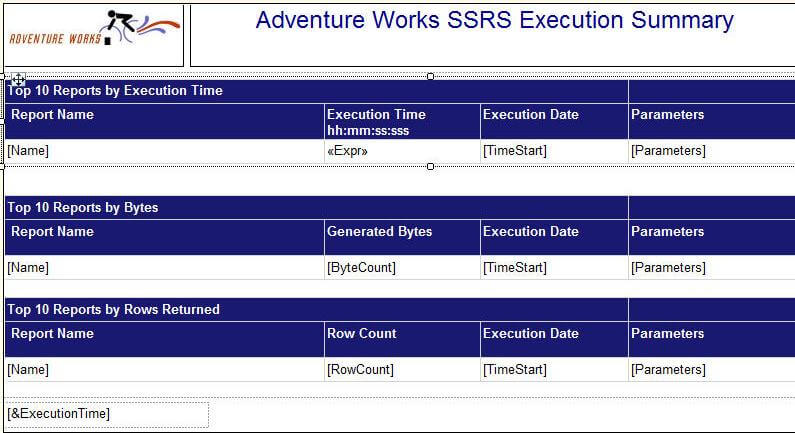
The second and third tables resemble the following figures.

The variation of the reports from this point are only limited by the data in the ExecutionLogStorage table. Some additional report ideas can be found at SQL 2008 R2 RTM! Time to look at some new Execution Log Reports. A group of tables or charts by day of the week, day of month, and time of day would likely be beneficial.
Conclusion-Creating an Execution Log SSRS Report
In this tutorial, we reviewed the ExecutionLog tables and views Microsoft provides when installing SSRS 2008R2. We focused on what additional items could be added to the views, and then used a modified view as the basis for creating a group of Top 10 Reports by Execution Time, Bytes Generated, and Rows Returned.
Next Steps
- Review these other articles:
- Channel 9’s What’s execution log in Reporting Services
- Ray Barley’s Analyze Report Execution and Usage Statistics in SQL Server Reporting Services
- Siddharth Mehta’s SQL Server Reporting Services Reports Performance Debugging and Analysis
- SQL 2008 R2 RTM! Time to look at some new Execution Log Reports – http://blogs.msdn.com/b/lukaszp/archive/2010/04/22/sql-2008-r2-rtm-time-to-look-at-some-new-execution-log-reports.aspx
- Check out these related resources:

I have a passion for crafting Business Intelligence Solutions for my user groups. My experience includes almost 15 years of SQL Server involvement with the last 12 years focused specifically on Business Intelligence, SharePoint, OLAP, SSRS, and Decision Support solutions. Currently, I am a Business Intelligence Architect in the healthcare industry, and I also teach database and analytics classes for Kennesaw State University, Southern New Hampshire University, and Reinhardt University. My education includes an MBA and an undergraduate in Accounting (yes I am a reformed accountant!), both from Kennesaw State University. I enjoy every day by trying to grow my faith and spend precious time with my family. I have been happily married to my wife of over 20 years, and we have two teenagers one who we home school with the help of a University Model School, Cornerstone Prep in Acworth, GA (cornerstoneprep.org). Our other child is a Construction Management major at KSU’s Southern Poly / Marietta campus. We are a soccer and Cross Country (XC) family who play, coach, and referee soccer or run for fun most every day. For several years, our family has volunteered (and played with the dogs and cats) at Etowah Valley Humane Society in Cartersville, GA.
- MSSQLTips Awards: Champion (100+tips) – 2016 | Author of the Year – 2015 | Author Contender – 2014, 2016-2021

I’ve got a project with a suite of reports to query the report server in GitHub.
https://github.com/SQL-Server-projects/Reporting-Services-examples