By: MSSQLTips | Comments | Related: > Reporting Services Monitoring
Problem
Reporting Services is one way of providing important business information to those who need it most. But there are certain questions to ask yourself when utilizing Reporting Services as a delivery mechanism:
- Who is accessing what reports?
- How often are reports being accessed?
- How many reports are being executed at any given time?
Knowing the answers to these questions can help you further restrict access, plan for additional hardware resources as the server's utilization increases, and troubleshoot failed connections and delivery issues. Reporting Services has a number of logging options to assist you in finding the answers to these questions.
Solution
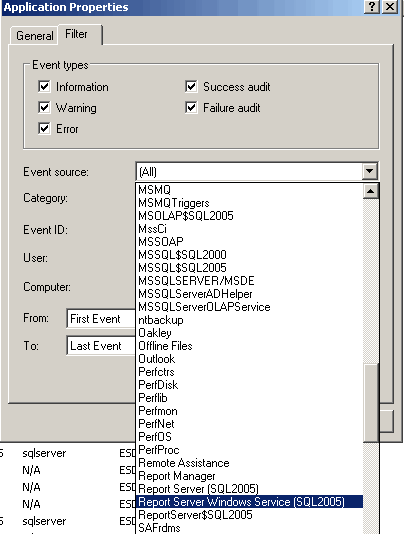
The first and most obvious choice is Event Viewer's Application log. This logging requires no configuration and gives you clues to why the service as a whole may have failed. As you well know there are many entries made in the Application Log, but Reporting Services has its own set of sources you can use to filter the service as shown below:

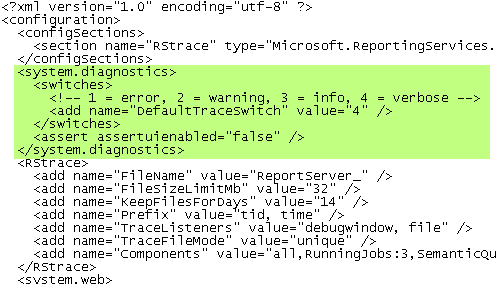
In addition to Event Viewer, Reporting Services also offers numerous logs to cover the finer aspects of operations. To use tracing and logging in Reporting Services 2005 you should first consider to what level you want to log and audit the service. Depending on what you decide, you may have to change a couple of parameters in configuration files. All configuration files for Reporting Services are located in the following folder: [drive_letter]:\Program Files\Microsoft SQL Server\[instance] \Reporting Services\ folder. For Report Manager you have to change the DefaultTraceSwitch to the appropriate level you wish. Once you open the file, the switch is located in the [systems.diagnostics] node and can be set to one of these settings: Error (1), Warning (2), Info (3), and Verbose (4). The default setting is "3". The other parameter to be changed is in the other web.config file located in the ReportServer subfolder. It too, is located in the systems.diagnostics node and has the same levels and default setting:

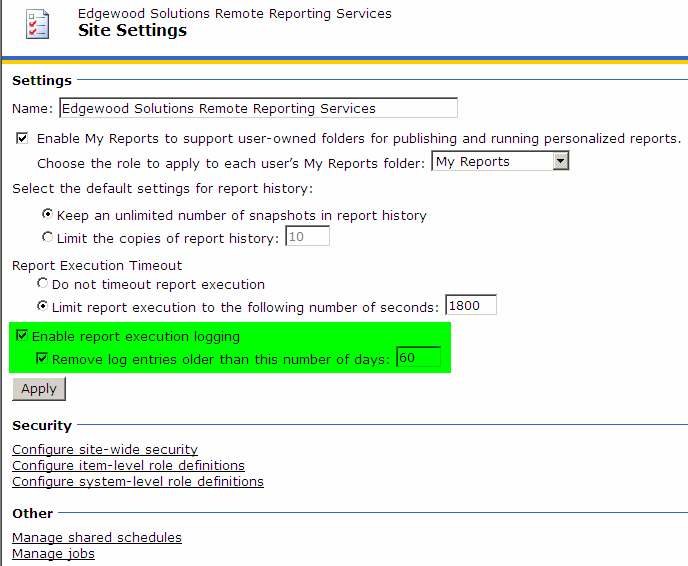
In addition to setting the logging level in the web.config files, you must also set the Report Execution settings to the level you wish, although there isn't much to it. Open the Report Server main page and click Site Settings in the top right section. On the Site Settings page toward the bottom is a section where you can specify whether you want to log report execution and how long you wish to keep the records. By default this feature is enabled with the log cleaning out records older than 60 days (this cleaning task is performed at 2:00AM everyday):

The execution log contains a plethora of information about the report that was executed, including the name of the report server, the user that requested it, and the size of the report, to name a few.
Next Steps
- When deploying a Reporting Services solution, consider what level of logging you will want and need to monitor report access and other issues related to performance
- Take a look at the various logs created by the Report Server to find out what valuable information is in them
- Read about Reporting Services Trace Logs in Books Online or on MSDN
- Look to MSSQLTIPS for more tips on Reporting Services
About the author
 MSSQLTips.com was started in 2006 to provide SQL Server content about various aspects of SQL Server and other database platforms.
This author pledges the content of this article is based on professional experience and not AI generated.
View all my tips


